

Graphene Oxide@3D Hierarchical SnO2 Nanofiber/Nanosheets Nanocomposites for Highly Sensitive and Low-Temperature Formaldehyde Detection
- PMID: 31861906
- PMCID: PMC6983051
- DOI: 10.3390/molecules25010035
Graphene Oxide@3D Hierarchical SnO2 Nanofiber/Nanosheets Nanocomposites for Highly Sensitive and Low-Temperature Formaldehyde Detection
Abstract
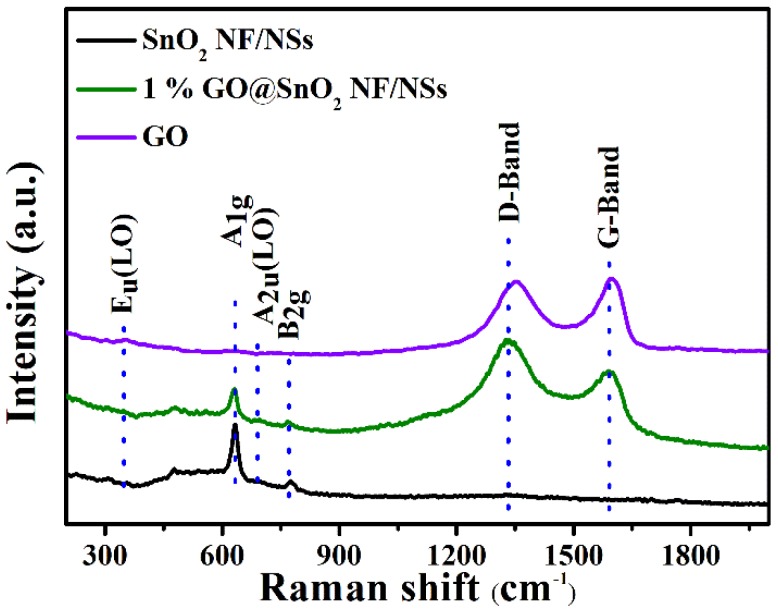
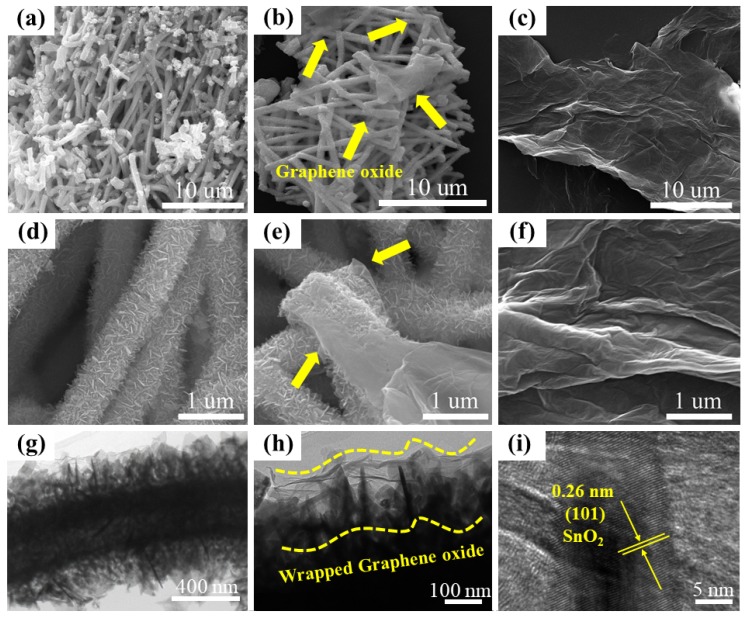
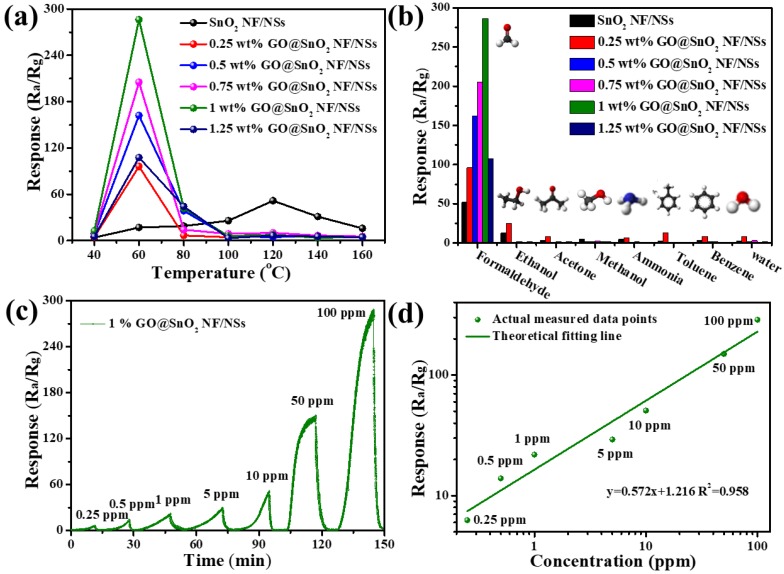
In this work, we reported a formaldehyde (HCHO) gas sensor with highly sensitive and selective gas-sensing performance at low operating temperature based on graphene oxide (GO)@SnO2 nanofiber/nanosheets (NF/NSs) nanocomposites. Hierarchical SnO2 NF/NSs coated with GO nanosheets showed enhanced sensing performance for HCHO gas, especially at low operating temperature. A series of characterization methods, including X-ray diffraction (XRD), Field emission scanning electron microscopy (FE-SEM), Transmission electron microscope (TEM), X-ray photoelectron spectroscopy (XPS) and Brunauer-Emmett-Teller (BET) were used to characterize their microstructures, morphologies, compositions, surface areas and so on. The sensing performance of GO@SnO2 NF/NSs nanocomposites was optimized by adjusting the loading amount of GO ranging from 0.25% to 1.25%. The results showed the optimum loading amount of 1% GO in GO@SnO2 NF/NSs nanocomposites not only exhibited the highest sensitivity value (Ra/Rg = 280 to 100 ppm HCHO gas) but also lowered the optimum operation temperature from 120 °C to 60 °C. The response value was about 4.5 times higher than that of pure hierarchical SnO2 NF/NSs (Ra/Rg = 64 to 100 ppm). GO@SnO2 NF/NSs nanocomposites showed lower detection limit down to 0.25 ppm HCHO and excellent selectivity against interfering gases (ethanol (C2H5OH), acetone (CH3COCH3), methanol (CH3OH), ammonia (NH3), methylbenzene (C7H8), benzene (C6H6) and water (H2O)). The enhanced sensing performance for HCHO was mainly ascribed to the high specific surface area, suitable electron transfer channels and the synergistic effect of the SnO2 NF/NSs and GO nanosheets network.
Keywords: GO@SnO2 NF/NSs; formaldehyde gas sensors; nanocomposites; three-dimensional nanostructure.
Conflict of interest statement
The authors declare that they have no competing interests.
Figures


Similar articles
-
Breakthroughs in the Design of Novel Carbon-Based Metal Oxides Nanocomposites for VOCs Gas Sensing.Nanomaterials (Basel). 2020 Jul 29;10(8):1485. doi: 10.3390/nano10081485. Nanomaterials (Basel). 2020. PMID: 32751173 Free PMC article. Review.
-
Mesoporous Ultrathin SnO2 Nanosheets in Situ Modified by Graphene Oxide for Extraordinary Formaldehyde Detection at Low Temperatures.ACS Appl Mater Interfaces. 2019 Apr 3;11(13):12808-12818. doi: 10.1021/acsami.9b01465. Epub 2019 Mar 21. ACS Appl Mater Interfaces. 2019. PMID: 30740975
-
Hierarchical In2O3@SnO2 Core-Shell Nanofiber for High Efficiency Formaldehyde Detection.ACS Appl Mater Interfaces. 2019 Dec 4;11(48):45214-45225. doi: 10.1021/acsami.9b16599. Epub 2019 Nov 19. ACS Appl Mater Interfaces. 2019. PMID: 31710803
-
Room temperature detection of aspergillus flavus volatile organic compounds (VOCs) under simulated conditions using graphene oxide and tin oxide Nanorods (SnO2 NRs-GO).Food Chem. 2024 Oct 30;456:140068. doi: 10.1016/j.foodchem.2024.140068. Epub 2024 Jun 11. Food Chem. 2024. PMID: 38878549
-
Chemiresistive gas sensors based on electrospun semiconductor metal oxides: A review.Talanta. 2022 Aug 15;246:123527. doi: 10.1016/j.talanta.2022.123527. Epub 2022 May 9. Talanta. 2022. PMID: 35588644 Review.
Cited by
-
Three-Dimensional MoS2/Reduced Graphene Oxide Nanosheets/Graphene Quantum Dots Hybrids for High-Performance Room-Temperature NO2 Gas Sensors.Nanomaterials (Basel). 2022 Mar 9;12(6):901. doi: 10.3390/nano12060901. Nanomaterials (Basel). 2022. PMID: 35335714 Free PMC article.
-
Breakthroughs in the Design of Novel Carbon-Based Metal Oxides Nanocomposites for VOCs Gas Sensing.Nanomaterials (Basel). 2020 Jul 29;10(8):1485. doi: 10.3390/nano10081485. Nanomaterials (Basel). 2020. PMID: 32751173 Free PMC article. Review.
-
High-Performance Cataluminescence Sensor Based on Nanosized V2O5 for 2-Butanone Detection.Molecules. 2020 Aug 4;25(15):3552. doi: 10.3390/molecules25153552. Molecules. 2020. PMID: 32759660 Free PMC article.
References
-
- Zhang D., Liu J., Jiang C., Liu A., Xia B. Quantitative detection of formaldehyde and ammonia gas via metal oxide-modified graphene-based sensor array combining with neural network model. Sens. Actuators B. 2017;240:55–65. doi: 10.1016/j.snb.2016.08.085. - DOI
-
- Meng F., Zheng H., Chang Y., Zhao Y., Li M., Wang C., Sun Y., Liu J. One-step synthesis of Au/SnO2/RGO nanocomposites and their VOC sensing properties. IEEE Trans. Nanotechnol. 2018;17:212–219. doi: 10.1109/TNANO.2017.2789225. - DOI
-
- Yoosefian M., Raissi H., Mola A. The hybrid of Pd and SWCNT (Pd loaded on SWCNT) as an efficient sensor for the formaldehyde molecule detection: A DFT study. Sens. Actuators B. 2015;212:55–62. doi: 10.1016/j.snb.2015.02.004. - DOI
-
- Rong X., Chen D., Qu G., Li T., Zhang R., Sun J. Effects of graphene on the microstructures of SnO2@rGO nanocomposites and their formaldehyde-sensing performance. Sens. Actuators B. 2018;269:223–237. doi: 10.1016/j.snb.2018.04.176. - DOI
MeSH terms
Substances
Grants and funding
- 19XD1422900/Shanghai Academic/Technology Research Leader Program
- 51572173, 51602197, 51771121 and 51702212/National Natural Science Foundation of China
- 19ZR1435200, 18511110600 and 19JC1410402/Science and Technology Commission of Shanghai Municipality
- 2019-01-07-00-07-E00015/Innovation Program of Shanghai Municipal Education Commission
LinkOut - more resources
Full Text Sources
