. 2020 Feb 1;204(3):644-659.
doi: 10.4049/jimmunol.1901211. Epub 2019 Dec 20.

IL-10 Impairs Local Immune Response in Lung Granulomas and Lymph Nodes during Early Mycobacterium tuberculosis Infection

Affiliations

IL-10 Impairs Local Immune Response in Lung Granulomas and Lymph Nodes during Early Mycobacterium tuberculosis Infection

Eileen A Wong et al. J Immunol. .

Abstract

Tuberculosis (TB), caused by Mycobacterium tuberculosis, continues to be a major global health problem. Lung granulomas are organized structures of host immune cells that function to contain the bacteria. Cytokine expression is a critical component of the protective immune response, but inappropriate cytokine expression can exacerbate TB. Although the importance of proinflammatory cytokines in controlling M. tuberculosis infection has been established, the effects of anti-inflammatory cytokines, such as IL-10, in TB are less well understood. To investigate the role of IL-10, we used an Ab to neutralize IL-10 in cynomolgus macaques during M. tuberculosis infection. Anti-IL-10-treated nonhuman primates had similar overall disease outcomes compared with untreated control nonhuman primates, but there were immunological changes in granulomas and lymph nodes from anti-IL-10-treated animals. There was less thoracic inflammation and increased cytokine production in lung granulomas and lymph nodes from IL-10-neutralized animals at 3-4 wk postinfection compared with control animals. At 8 wk postinfection, lung granulomas from IL-10-neutralized animals had reduced cytokine production but increased fibrosis relative to control animals. Although these immunological changes did not affect the overall disease burden during the first 8 wk of infection, we paired computational modeling to explore late infection dynamics. Our findings support that early changes occurring in the absence of IL-10 may lead to better bacterial control later during infection. These unique datasets provide insight into the contribution of IL-10 to the immunological balance necessary for granulomas to control bacterial burden and disease pathology in M. tuberculosis infection.


Figures

Figure 1.
Figure 1.. Anti-IL-10 antibody neutralizes macaque IL-10
A) D36 mouse mast cells are IL-10 dependent for cell proliferation. Mast cells with 20ng/ml rhesus IL-10 proliferate, while mast cells with rhesus IL-10 neutralized by varying concentrations of macaque anti-IL-10 antibody have reduced proliferation, as measured by tritiated-thymidine uptake levels. Bars represent means of duplicates, error bars represent standard deviations. B) There is a wide range of IL-10 concentrations in lung granulomas and clusters from Mtb-infected NHPs (n=12) with infection times 4-52 weeks. Each point is a granuloma, each different shade of gray represents a NHP. C) Excised granulomas with detectable levels of IL-10 (>0.19 pg/ml) were treated with anti-IL-10 antibody (10ug/ml) ex vivo and compared to their untreated media controls for frequencies of cytokine response by flow cytometry. Wilcoxon matched-pairs signed rank test p-values reported. D) Experimental setup for study of IL-10 neutralization in vivo in cynomolgus macaquesAnti-IL-10 antibody infusions began one day before Mtb infection and continued throughout the course of infection, for every 10 days (+/−3 days).
Figure 2.
Figure 2.. Inflammation in individual granulomas of anti-IL-10 treated NHPs is lower early in Mtb infection, but IL-10 neutralization does not affect overall disease outcome.
A) Total lung inflammation (total 18F-FDG activity) during the course of infection for anti-IL-10 treated and untreated controls. Each color is a NHP. Gray points indicate historical controls. B) 18F-FDG avidity (SUVR) in individual lung granulomas from the 8 week infection NHP cohort, excluding 20516 (medium blue symbol in A and at 4 weeks in B) due to tuberculous disease related lung collapse. Each point is a granuloma, each color is a NHP. Lines at medians. C) In the 8 week infection cohort, individual granulomas were categorized as LowFDG (SUVR < 5) or HighFDG (SUVR ≥ 5) at 3-4 weeks p.i. (see 2B) and bacterial burden was quantified from these individual lung granulomas at 8 weeks post-infection. Lines at medians. Red dots represent granulomas from anti-IL-10 treated animals and blue dots represent granulomas from control animals. D) Gross pathology at necropsy (necropsy score). Each point indicates a NHP, lines at medians. E) Total thoracic CFU quantified at necropsy. Each point indicates a NHP, lines at medians. F) CFU per granuloma at 4 and 8 weeks post-infection. Each point indicates a granuloma, colors indicate NHPs, lines at medians. For B and C, Mann-Whitney test p-values reported. For D, E, and F, Kruskal-Wallis Test was performed and either Kruskal-Wallis p-value (if not statistically significant) or Dunn’s Multiple Comparisons adjusted p-values were reported.
Figure 3.
Figure 3.. T cell populations and cytokine response in granulomas are similar between anti-IL-10 treated and untreated animals at early time points after Mtb infection.
Cells from excised granulomas were analyzed by intracellular cytokine staining and flow cytometry to identify different cell markers and functionality frequencies in individual granulomas. Each point represents a lung granuloma or cluster, each color is a NHP, lines are at medians. Kruskal-Wallis Test was performed and either Kruskal-Wallis p-value (if not statistically significant) or Dunn’s Multiple Comparisons adjusted p-values were reported.
Figure 4.
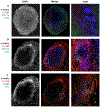
Figure 4.. IL-10R co-localizes with non-T cells in TB granulomas.
A representative granuloma from 4 weeks A) or 8 weeks (B) post Mtb infection has more co-localization of IL-10R (red) with CD11c-expressing cells (blue) than CD3-expressing cells (green). (C) The same granuloma as in (B) shows that the CD20 B cells (blue) are IL10R-positive (red), along with a few CD3 cells (green) also expressing IL-10R. Scale bar in DAPI indicates 500um.
Figure 5.
Figure 5.. Total cytokine response in lung granulomas are higher in anti-IL-10 treated animals at 4 weeks, but lower at 8 weeks.
Total cytokine concentrations were measured from supernatants from granuloma homogenates by multiplex cytokine assays. Each point represents a granuloma, each color is a NHP. LL= lower limit of quantification, UL = upper limit of quantification. Mann-Whitney test p-values reported and shaded boxes indicate p > 0.05.
Figure 6.
Figure 6.. IL-10 inhibits early bacterial burdens, cell recruitment, and immune response in lymph nodes.
A) Bacterial burden is higher in Mtb-infected LNs from anti-IL-10 animals at 4 weeks post-infection. Each point represents a Mtb-infected LN, each color is a NHP (gray indicates historical control). Lines at medians. B) At 4 and 8 weeks post-infection, Mtb-infected LNs of anti-IL-10 treated animals have skewed CD4+/CD4− ratios compared to control animals. Each point represents a Mtb-infected LN, each color is a NHP (gray indicates historical control). Lines at medians. C) Mtb-infected LNs from anti-IL-10 NHPs have higher frequencies of Th17 cells compared to controls at 8 weeks post-infection. Each point represents a Mtb-infected LN, each color is a NHP. Lines at medians. D, E) Total cytokine or chemokine concentrations were measured from supernatants from Mtb-infected LNs by multiplex cytokine assays. LNs of anti-IL-10 treated animals at 4 weeks post-infection had higher cytokine (D) and chemokine (E) levels as compared to controls. Each point represents a Mtb-infected LN, each color is a NHP (gray indicates historical control). LL = lower limit of quantification. For A, B, and C, Kruskal-Wallis Test was performed and Dunn’s Multiple Comparisons adjusted p-values were reported. D and E, p-values determined by Mann-Whitney test.
Figure 7.
Figure 7.. IL-10 neutralization leads to increased collagenization and fibrosis in lung granulomas.
A) Anti-IL-10 treated animals have more fibrosis in lung granulomas compared to control animals at the time of necropsy (both 4 and 8 weeks of infection), using a semi-quantitative assessment by a pathologist (EK). Fisher’s exact test p-value was reported. B) Lung granulomas from anti-IL-10 treated animals have more collagen at 8 weeks post- Mtb infection than control animals at the time of necropsy, as quantified by mean pixel intensity of blue from Masson’s trichrome staining of a random subset of granulomas. Each point represents a granuloma, each color is a NHP (gray indicates historical control). Lines at medians. Kruskal-Wallis Test was performed and Dunn’s Multiple Comparisons adjusted p-values were reported. C) Representative granulomas from each treatment group at each time post-infection (4 and 8 weeks) were stained for collagen by Masson’s trichrome staining, fibroblast (vimentin), macrophage (CD68), myofibroblast (α-SMA) markers, collagen and macrophage (CD163, CD68) markers, IL-4/IL-13 signaling (pSTAT6) and myeloid (CD11c) markers, and TGF-β signaling (pSMAD3) and myeloid (CD11c) markers as labeled in the figure. White boxes show inset of the area boxed in the granuloma for more detail of representative area with collagen, scale bars in trichrome images represent 500μm.
Figure 8.
Figure 8.. Simulated granulomas recapitulate range of granulomas found in vivo.
A) Representative 20 week snapshots of GranSim-simulated granulomas under WT and IL-10 KO conditions with average cell counts in each treatment group. Images are taken from a simulation of a 2mm × 2mm piece of lung tissue. Simulated cells colored to show the type of cell they are representing: resting macrophages are green, activated macrophages are blue, infected macrophages are orange, chronically infected macrophages are red, IFN-γ producing T cells are pink, cytotoxic T cells are violet, regulatory T cells are cyan. Caseum is represented as brown compartments and areas of high Mtb burden are shown in white. Bars are colored to correspond to cell types and show mean (solid bar) and standard deviation (error bar) of cell types in all granulomas from each treatment group at 20 weeks post-infection. Range of simulated IL-10 concentrations (B), and CFU profiles (C) in the 636 simulated granulomas at 4, 8, and 20 weeks post-infection in virtual granulomas. Actual amount (gray circles) and distributions within each quantile (boxplots). Error lines demonstrate range of data up to 1.5x the interquartile range, outliers are indicated by black circles.
Figure 9.
Figure 9.. IL-10 depletion increases proportion of sterile granulomas but not time to sterilization.
(A) Sterilization frequencies in granulomas over time at varying levels of IL-10. (B) Time to sterilization for the sterile granulomas within each of the quartiles. Dashed line highlights the 4 week time point used for grouping by quartile. Simulated granulomas with zero CFU were considered to be sterile and the time at which sterilization occurs was recorded (in weeks). Granulomas were grouped by the quantiles of IL-10 in the environment at 4 weeks post infection. Error lines demonstrate range of data up to 1.5x the interquartile range, outliers are indicated by black circles.

Similar articles

Cited by

References

    1. WHO. Tuberculosis Fact Sheet.
    1. Clay H, Davis JM, Beery D, Huttenlocher A, Lyons SE, and Ramakrishnan L. 2007. Dichotomous role of the macrophage in early Mycobacterium marinum infection of the zebrafish. Cell host & microbe 2: 29–39. - PMC - PubMed
    1. Tsai MC, Chakravarty S, Zhu G, Xu J, Tanaka K, Koch C, Tufariello J, Flynn J, and Chan J. 2006. Characterization of the tuberculous granuloma in murine and human lungs: cellular composition and relative tissue oxygen tension. Cellular microbiology 8: 218–232. - PubMed
    1. Srivastava S, Ernst JD, and Desvignes L. 2014. Beyond macrophages: the diversity of mononuclear cells in tuberculosis. Immunological reviews 262: 179–192. - PMC - PubMed
    1. Wolf AJ, Linas B, Trevejo-Nuñez GJ, Kincaid E, Tamura T, Takatsu K, and Ernst JD. 2007. Mycobacterium tuberculosis infects dendritic cells with high frequency and impairs their function in vivo. The Journal of Immunology 179: 2509–2519. - PubMed

Publication types