

Can risk be predicted? An umbrella systematic review of current risk prediction models for cardiovascular diseases, diabetes and hypertension
- PMID: 31862737
- PMCID: PMC6937066
- DOI: 10.1136/bmjopen-2019-030234
Can risk be predicted? An umbrella systematic review of current risk prediction models for cardiovascular diseases, diabetes and hypertension
Abstract
Objective: To provide an overview of the currently available risk prediction models (RPMs) for cardiovascular diseases (CVDs), diabetes and hypertension, and to compare their effectiveness in proper recognition of patients at risk of developing these diseases.
Design: Umbrella systematic review.
Data sources: PubMed, Scopus, Cochrane Library.
Eligibility criteria: Systematic reviews or meta-analysis examining and comparing performances of RPMs for CVDs, hypertension or diabetes in healthy adult (18-65 years old) population, published in English language.
Data extraction and synthesis: Data were extracted according to the following parameters: number of studies included, intervention (RPMs applied/assessed), comparison, performance, validation and outcomes. A narrative synthesis was performed. Data were reported according to the Preferred Reporting Items for Systematic Reviews and Meta-Analyses guidelines.
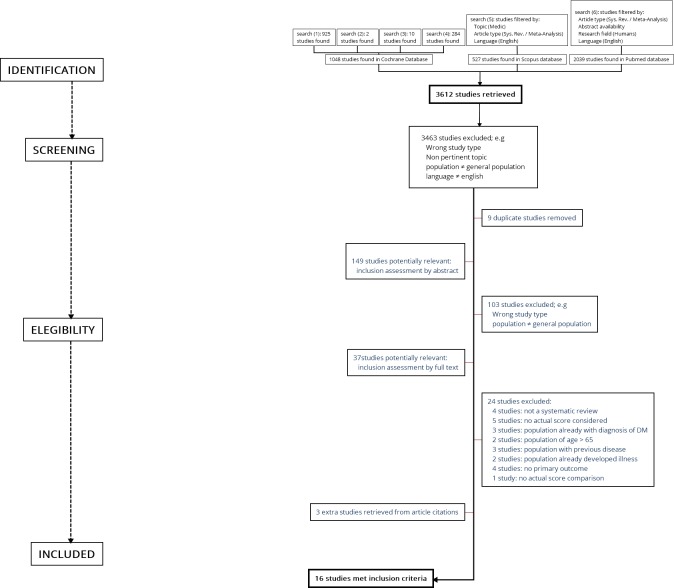
Study selection: 3612 studies were identified. After title/abstract screening and removal of duplicate articles, 37 studies met the eligibility criteria. After reading the full text, 13 were deemed relevant for inclusion. Three further papers from the reference lists of these articles were then added.
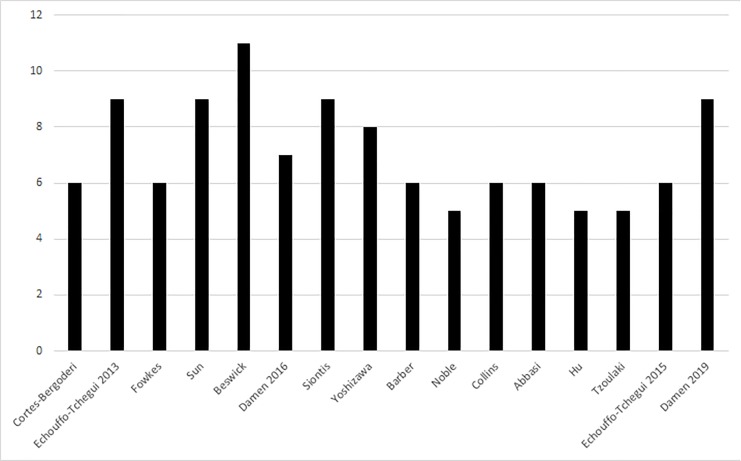
Study appraisal: The methodological quality of the included studies was assessed using the AMSTAR tool.
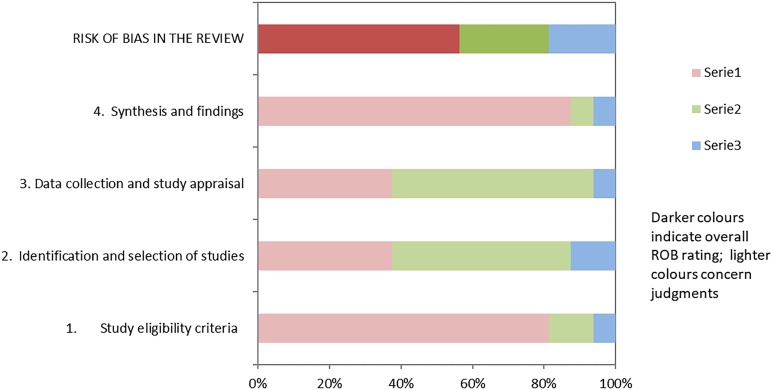
Risk of bias in individual studies: Risk of Bias evaluation was carried out using the ROBIS tool.
Results: Sixteen studies met the inclusion criteria: six focused on diabetes, two on hypertension and eight on CVDs. Globally, prediction models for diabetes and hypertension showed no significant difference in effectiveness. Conversely, some promising differences among prediction tools were highlighted for CVDs. The Ankle-Brachial Index, in association with the Framingham tool, and QRISK scores provided some evidence of a certain superiority compared with Framingham alone.
Limitations: Due to the significant heterogeneity of the studies, it was not possible to perform a meta-analysis. The electronic search was limited to studies in English and to three major international databases (MEDLINE/PubMed, Scopus and Cochrane Library), with additional works derived from the reference list of other studies; grey literature with unpublished documents was not included in the search. Furthermore, no assessment of potential adverse effects of RPMs was carried out.
Conclusions: Consistent evidence is available only for CVD prediction: the Framingham score, alone or in combination with the Ankle-Brachial Index, and the QRISK score can be confirmed as the gold standard. Further efforts should not be concentrated on creating new scores, but rather on performing external validation of the existing ones, in particular on high-risk groups. Benefits could be further improved by supplementing existing models with information on lifestyle, personal habits, family and employment history, social network relationships, income and education.
Prospero registration number: CRD42018088012.
Keywords: cardiovascular diseases; diabetes; hypertension; risk prediction models.
© Author(s) (or their employer(s)) 2019. Re-use permitted under CC BY-NC. No commercial re-use. See rights and permissions. Published by BMJ.
Conflict of interest statement
Competing interests: None declared.
Figures
References
-
- Health statistics and information systems Disease burden and mortality estimates. Cause-specific mortality, 2000–2016. Available: http://www.who.int/healthinfo/global_burden_disease/estimates/en/index1.... [Accessed 17 Jan 2019].
-
- Global Health Observatory (GHO) data Raised blood pressure. Situation and trends. Available: http://www.who.int/gho/ncd/risk_factors/blood_pressure_prevalence_text/en/ [Accessed 18 Jun 2018].
-
- WHO - Health statistics and information systems Disease burden, 2000–2016. Available: https://www.who.int/healthinfo/global_burden_disease/estimates/en/index1... [Accessed 17 Jan 2019].
Publication types
MeSH terms
LinkOut - more resources
Full Text Sources
Medical
Research Materials
Miscellaneous