. 2020 Feb 5;40(6):1332-1343.
doi: 10.1523/JNEUROSCI.0194-19.2019. Epub 2019 Dec 20.

The Nucleus Accumbens Core Is Necessary for Responding to Incentive But Not Instructive Stimuli

Affiliations

The Nucleus Accumbens Core Is Necessary for Responding to Incentive But Not Instructive Stimuli

Mehdi Sicre et al. J Neurosci. .

Abstract

An abundant literature has highlighted the importance of the nucleus accumbens core (NAcC) in behavioral tasks dependent on external stimuli. Yet, some studies have also reported the absence of involvement of the NAcC in stimuli processing. We aimed at comparing, in male rats, the underlying neuronal determinants of incentive and instructive stimuli in the same task. We developed a variant of a GO/NOGO task that reveals important differences in these two types of stimuli. The incentive stimulus invites the rat to engage in the task sequence. Once the rat has decided to initiate a trial, it remains engaged in the task until the end of the trial. This task revealed the differential contribution of the NAcC to responding to different types of stimuli: responding to the incentive stimulus depended on NAcC AMPA/NMDA and dopamine D1 receptors, but the retrieval of the response associated with the instructive stimuli (lever pressing on GO, withholding on NOGO) did not. Our electrophysiological study showed that more NAcC neurons responded more strongly to the incentive than the instructive stimuli. Furthermore, when animals did not respond to the incentive stimulus, the induced excitation was suppressed for most projection neurons, whereas interneurons were strongly activated at a latency preceding that found in projection neurons. This work provides insight on the underlying neuronal processes explaining the preferential implication of the NAcC in deciding whether and when to engage in reward-seeking rather than to decide which action to perform.SIGNIFICANCE STATEMENT The nucleus accumbens core (NAcC) is essential to process information carried by reward-predicting stimuli. Yet, stimuli have distinct properties: incentive stimuli orient the attention toward reward-seeking, whereas instructive stimuli inform about the action to perform. Our study shows that, in male rats, NAcC perturbation with glutamate or dopamine antagonists impeded responses to the incentive but not to the instructive stimulus. NAcC neuronal recordings revealed a stronger representation of incentive than instructive stimuli. Furthermore, we found that interneurons are recruited when rats fail to respond to incentive stimuli. This work provides insight on the underlying neuronal processes explaining the preferential implication of the NAcC in deciding whether and when to engage in reward-seeking rather than to decide which action to perform.

Keywords: dopamine; electrophysiology; interneurons; motivation; nucleus accumbens core; stimuli.


Figures

Figure 1.
Figure 1.
Behavioral performance in the GO/NOGO task. A, Task diagram showing the sequence of events during a trial. B, Temporal structure of the task. Numbers on top relate to the event sequence presented in A. C, Average correct response probabilities (number of responses/number of stimuli presented) for the three stimuli. For INC stimuli, a response was considered correct if the animal pressed the initiation lever within 10 s. For GO trials, a response was considered correct if there was a lever press during the presentation of the response lever. For NOGO trials, a response was considered correct if there was no lever press during the presentation of the response lever. Gray lines represent individual values. *p < 0.05 (Bonferroni post hoc test). D, Average response latency (time between the initiation lever extension to the initial lever press and between GO or NOGO onsets to the press on the response lever). For NOGO trials, the latency was computed for error trials. Gray lines represent individual values. *p < 0.05 (Bonferroni post hoc test). E, Relative timings of all behavioral events for correct and error trials. All events are aligned to GO and NOGO onsets. Left and right edges of the blue rectangle represent the onset and offset [triggered by the initiation lever press (Initi LP)] of the INC stimulus, respectively. Gray rectangles represent the periods where the response lever is extended. The light brown line represents the times in which the animal had its head in the reward receptacle. The left edge of the yellow rectangles marks the onset of the reward delivery and the right edge, the exit of the reward receptacle. F, Average response probability to the INC stimulus (10 min bins). Gray lines represent individual values. +p < 0.1, *p < 0.05, *p < 0.01 (Bonferroni post hoc tests). G, Average response latency to the INC stimulus (10 min bins). Gray lines represent individual values. +p < 0.1, *p < 0.05 (Bonferroni post hoc tests). H, Average response probability to the GO stimulus (10 min bins). Gray lines represent individual values. I, Average response latency to the INC stimulus (10 min bins). Gray lines represent individual values.
Figure 2.
Figure 2.
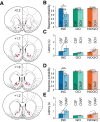
Effect of glutamate and dopamine D1 receptor antagonists on performance in the GO/NOGO task. A, Histological reconstruction of cannulae placements shown on coronal sections. SCH23390 group, purple; CNQX/AP5 group, brown. B, Effect of SCH23390 on average correct response probabilities for INC, GO, and NOGO stimuli. Gray lines represent individual animals. *p < 0.05 (Bonferroni post hoc test). C, Effect of SCH23390 on average response latencies. For NOGO, latencies were computed on error trials. Gray lines represent individual animals. D, Effect of CNQX/AP5 (CNAP) on average correct response probabilities for INC, GO, and NOGO stimuli. Gray lines represent individual animals. **p < 0.01 (Bonferroni post hoc test). E, Effect of CNQX/AP5 on average response latencies. For NOGO, latencies were computed on error trials. Gray lines represent individual animals.
Figure 3.
Figure 3.
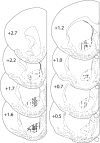
Histological reconstruction of electrode placements shown on coronal sections.
Figure 4.
Figure 4.
NAcC neurons respond more strongly to the incentive than the instructive stimuli. A, Heatmaps showing stimuli-evoked activity of all excited neurons. Each row represents an individual neuron's response to the stimulus averaged across all correct trials during the session. Neurons are sorted from top to bottom by the duration of their response. Colors indicate the z-score-normalized firing rate; hot colors represent excitation (z-score > 0), cool colors represent inhibition (z-score < 0). Data are plotted with 20 ms bins and smoothed with a LOWESS method (span = 6) for display purposes. ILP and RLP represent the average time of the initiation and response lever presses, respectively; En and Ex, average time of the entry and exit into the reward receptacle, respectively. B, Average PSTH for all neurons shown in A. Lines represent the mean response; shaded regions represent ± SEM. C, Same representation than in A but for stimuli-inhibited neurons. D, Same representation than in B but for stimuli-inhibited neurons. E, Percentage and average z-score (for the first 250 ms following stimulus onset) for excited (top) and inhibited (bottom) neurons. The number of neurons responsive to stimuli are indicated in the bar graphs. **p < 0.01 (Bonferroni post hoc tests). F, Response onsets and durations for INC, GO and NOGO stimuli excitations (top) and inhibitions (bottom). G, Percentage of neurons excited (purple) or inhibited (yellow) or nonresponsive (gray) to the instructive stimuli for all neurons, neurons nonresponsive to the INC stimulus, neurons excited by the INC stimulus, and neurons inhibited by the INC stimulus. The number of neurons are indicated in the pie charts.
Figure 5.
Figure 5.
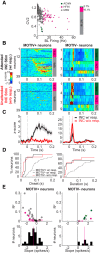
Neuronal responses to the incentive stimulus depend on the willingness to engage in the task. A, Basal firing rate plotted against the coefficient variation 2. Colors indicate the cellular type. The colored bar on the right show the proportion of each cell type on the entire population of neurons (n = 336). B, Heatmaps showing incentive stimulus-evoked activity when the animals initiated a trial (top) and when they did not (bottom) for MOTIV+ (left) and MOTIV− (right) neurons. Neurons are sorted by the cell type and latency of the excitation. Right bars indicate the percentage of AChINs, HFINs, and MSNs. Note: the same neurons are plotted for attended (top) and unattended (bottom) trials. C, Average PSTH for MOTIV+ and MOTIV− neurons for attended (black) and unattended (red) INC stimuli. D, Onset and duration of INC stimulus-evoked responses in MOTIV+ and MOTIV− neurons. E, Top, Regression coefficient plotted against R2 of the regression. Colors indicate the cellular type and filled symbol label significantly correlated neurons. Bottom, Distribution of the regression coefficient in significantly correlated (black bars) and non-significantly correlated (gray bars) neurons.
Figure 6.
Figure 6.
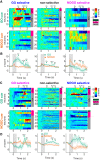
Selectivity of GO and NOGO stimuli-evoked excitations. A, Heatmaps showing GO (top row) and NOGO (bottom row) responses for GO selective neurons (left), nonselective neurons (middle), or NOGO selective neurons (right). Neurons are sorted by the neuronal type (shown on the right colored bar as in Fig. 4) and the onset latency of the response. RLP represents the average time of the initiation lever press; En and Ex, average time of the entry and exit into the reward receptacle, respectively. B, Average PSTH aligned to the GO (green) and the NOGO (orange) stimulus for GO selective (left), nonselective (middle), and NOGO selective (right) neurons. C, Same as A for GO and NOGO stimuli-evoked inhibitions. D, Same as B for GO and NOGO stimuli-evoked inhibitions.

Similar articles

Cited by

References

    1. Amalric M, Koob GF (1987) Depletion of dopamine in the caudate nucleus but not in nucleus accumbens impairs reaction-time performance in rats. J Neurosci 7:2129–2134. 10.1523/JNEUROSCI.07-07-02129.1987 - DOI - PMC - PubMed
    1. Ambroggi F, Ishikawa A, Fields HL, Nicola SM (2008) Basolateral amygdala neurons facilitate reward-seeking behaviour by exciting nucelus accumbens neurons. Neuron 59:648–661. 10.1016/j.neuron.2008.07.004 - DOI - PMC - PubMed
    1. Ambroggi F, Ghazizadeh A, Nicola SM, Fields HL (2011) Roles of nucleus accumbens core and shell in incentive-cue responding and behavioral inhibition. J Neurosci 31:6820–6830. 10.1523/JNEUROSCI.6491-10.2011 - DOI - PMC - PubMed
    1. Aosaki T, Tsubokawa H, Ishida A, Watanabe K, Graybiel AM, Kimura M (1994) Responses of tonically active neurons in the primate's striatum undergo systematic changes during behavioral sensorimotor conditioning. J Neurosci 14:3969–3984. 10.1523/JNEUROSCI.14-06-03969.1994 - DOI - PMC - PubMed
    1. Apicella P. (2007) Leading tonically active neurons of the striatum from reward detection to context recognition. Trends Neurosci 30:299–306. 10.1016/j.tins.2007.03.011 - DOI - PubMed

Publication types

LinkOut - more resources