. 2019 Dec 20;10(1):5818.
doi: 10.1038/s41467-019-13730-0.

Relaxed purifying selection in autopolyploids drives transposable element over-accumulation which provides variants for local adaptation

Affiliations

Relaxed purifying selection in autopolyploids drives transposable element over-accumulation which provides variants for local adaptation

Pierre Baduel et al. Nat Commun. .

Abstract

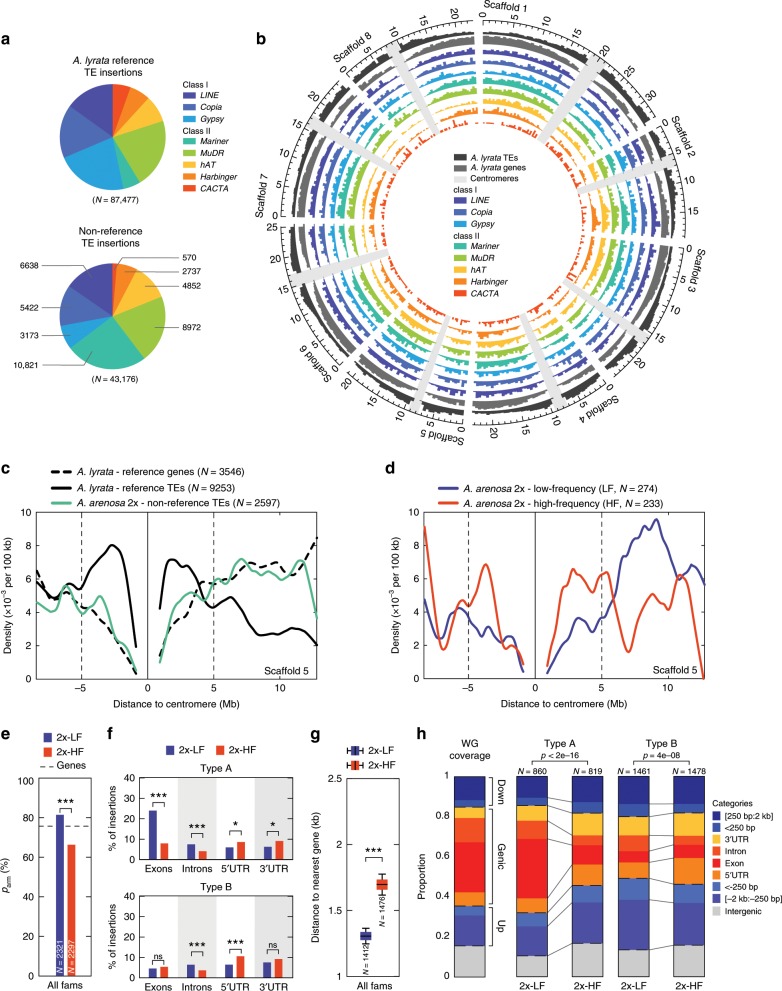
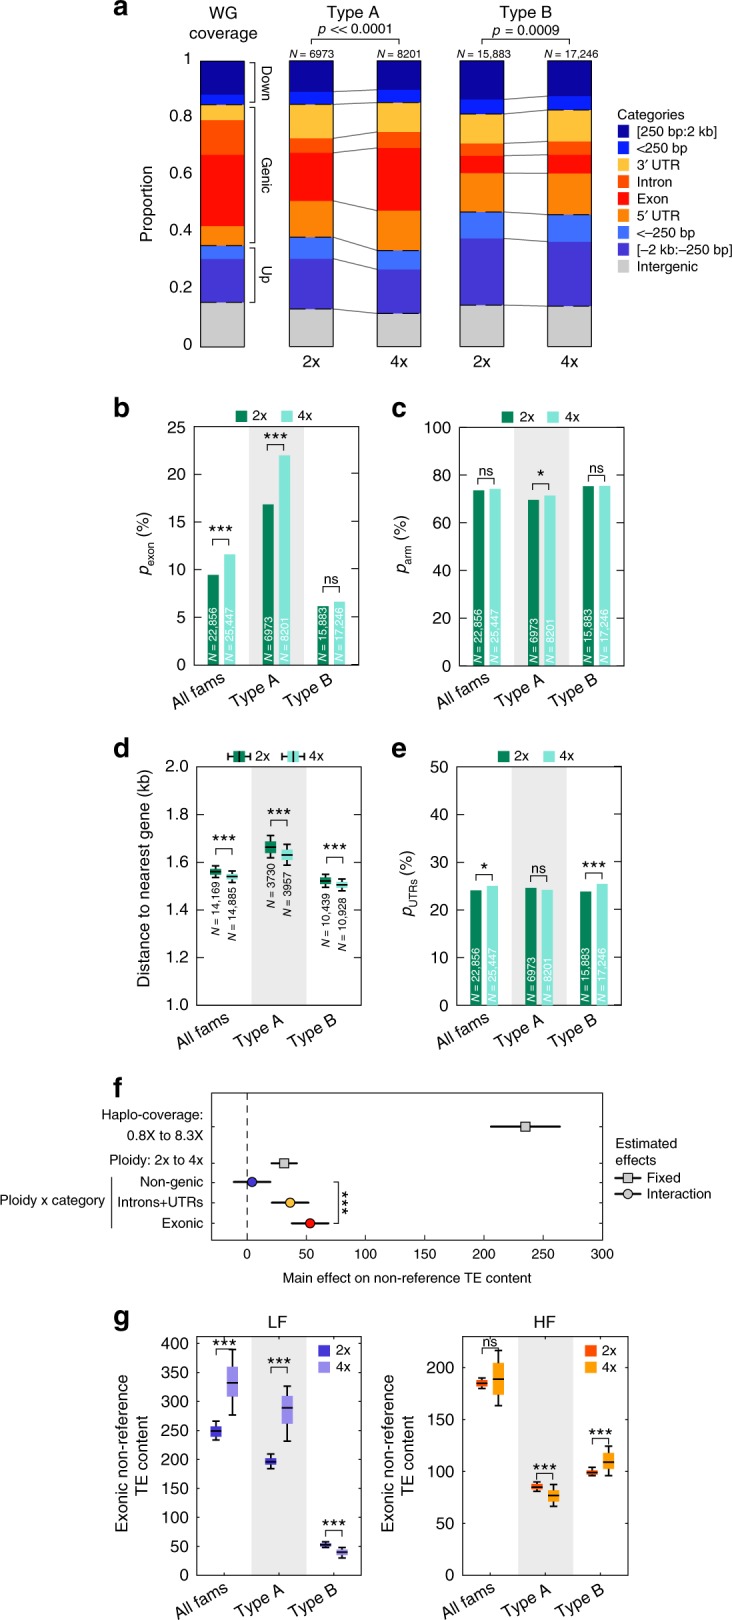
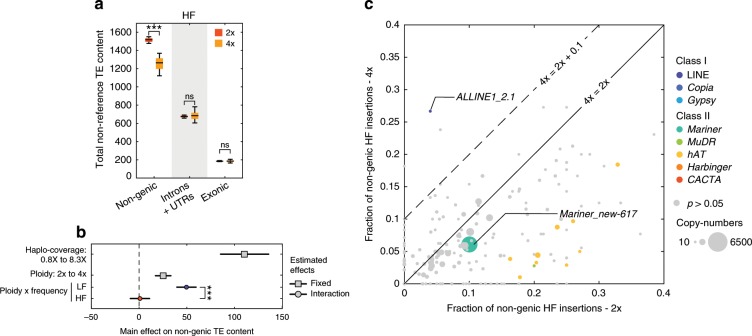
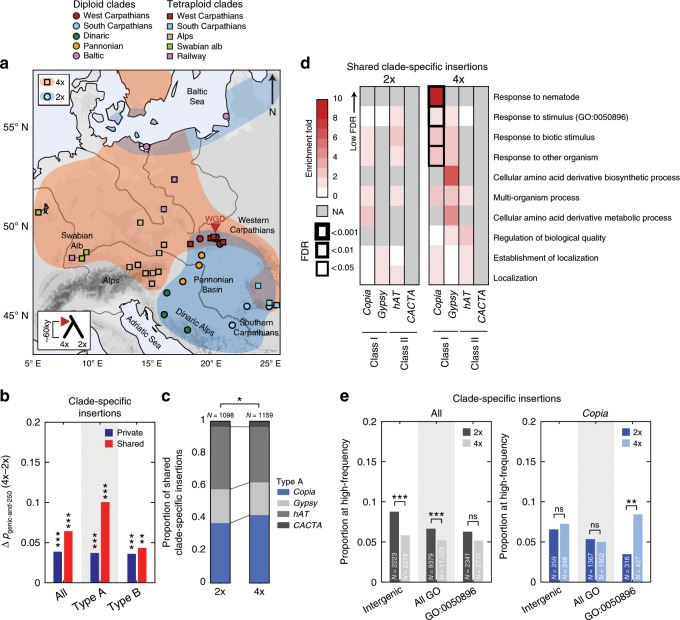
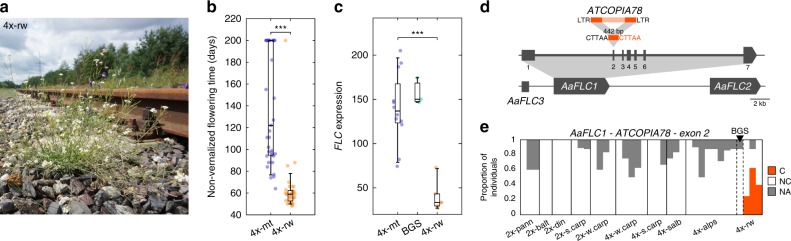
Polyploidization is frequently associated with increased transposable element (TE) content. However, what drives TE dynamics following whole genome duplication (WGD) and the evolutionary implications remain unclear. Here, we leverage whole-genome resequencing data available for ~300 individuals of Arabidopsis arenosa, a well characterized natural diploid-autotetraploid plant species, to address these questions. Based on 43,176 TE insertions we detect in these genomes, we demonstrate that relaxed purifying selection rather than transposition bursts is the main driver of TE over-accumulation after WGD. Furthermore, the increased pool of TE insertions in tetraploids is especially enriched within or near environmentally responsive genes. Notably, we show that the major flowering-time repressor gene FLC is disrupted by a TE insertion specifically in the rapid-cycling tetraploid lineage that colonized mainland railways. Together, our findings indicate that tetrasomy leads to an enhanced accumulation of genic TE insertions, some of which likely contribute to local adaptation.


Conflict of interest statement

The authors declare no competing interests.

Figures

Fig. 1
Fig. 1. Natural selection shapes the TE landscape of A. arenosa diploids.
a Distribution of reference TEs (upper chart) and non-reference (lower chart) TE insertions identified by SPLITREADER across the 8 class I & II TE superfamilies. b Chromosomal distributions of reference genes and TEs and of non-reference TE insertions by TE superfamily across the 8 scaffolds of the A. lyrata reference genome. c Density per 100 kb of reference genes and TEs and of non-reference diploid TE insertions across scaffold 5. d Density per 100 kb across scaffold 5 of low- and high-frequency TE insertions in diploids. e Fraction, parm, within chromosome arms (>5 Mb away from centromeres) of low- and high-frequency TE insertions in diploids with p-values of χ2-test. (f) Fraction of low- and high-frequency TE insertions in diploids overlapping exons, introns, 5′ or 3′ UTRs for type A (upper panel, n = 860 2x-LF and n = 819 2x-HF) and type B (lower panel, n = 1461 2x-LF and n = 1478 2x-HF) superfamilies with p-values of χ2-test. g Boxplots of distance to nearest gene (kb) of low- and high-frequency non-genic TE insertions in diploids across 1000 bootstraps and p-value of t-test between ploidies. Boxplot center lines, median; box limits, upper and lower quartiles; whiskers, 9th and 91st quantiles. h Distribution of low- and high-frequency TE insertions in diploids across categories of insertions for type A and type B superfamilies compared to reference genome annotations with p-values of χ2-test. p< 0.001: ***; p < 0.01: **; p < 0.05: *; p ≥ 0.05: ns. The source data underlying Fig. 1b–h are provided as a Source Data file.
Fig. 2
Fig. 2. Increased exonic TE load from relaxed purifying selection in autotetraploids.
a Distribution of TE insertions across categories of insertions for type A and type B superfamilies in diploids and tetraploids compared to reference genome annotations with p-values of χ2-test. b Fraction, pexon, of TE insertions overlapping exons for all, type A, and type B superfamilies in diploids and tetraploids with p-values of χ2-test. c Fraction, parm, within chromosome arms (>5 Mb away from centromeres) of TE insertions for all, type A, and type B superfamilies in diploids and tetraploids with p-values of χ2-test. d Boxplots of distance to nearest gene of non-genic TE insertions for all, type A, and type B superfamilies in diploids and tetraploids across 1000 bootstraps and p-value of t-test between ploidies. Boxplot center lines, median; box limits, upper and lower quartiles; whiskers, 9th and 91st quantiles. e Fraction, pUTRs, of TE insertions overlapping UTRs (5′ and 3′) for all superfamilies, type A, and type B TE superfamilies in diploids and tetraploids with p-values of χ2-test. f Estimated MLM effects and interaction terms of haplo-coverage, ploidy, and category of insertions (non-genic, introns and UTRs, or exonic) on non-reference TE content. Horizontal lines indicate 95% confidence intervals for each effect value. p-values for each coefficient corresponds to the t-statistic of the hypothesis test that the corresponding coefficient is equal to zero or not. g Number of TE insertions within exons carried by 100 individuals for all, type A, and type B superfamilies in diploids and tetraploids at low-frequency (LF, left panel) and high-frequency (HF, right panel) with standard deviations across 100 random samples and p-value of t-test between ploidies. Boxplot center lines, median; box limits, upper and lower quartiles; whiskers, 9th and 91st quantiles. p < 0.001: ***; p < 0.01: **; p < 0.05: *; p ≥ 0.05: ns. The source data underlying Fig. 2a–e are provided as a Source Data file.
Fig. 3
Fig. 3. Absence of genome-wide or family specific transposition burst hallmarks in autotetraploids.
a Number of TE insertions carried by 100 individuals by category (non-genic, introns and UTRs, exonic) in diploids and tetraploids at high-frequency (HF) with standard deviations across 100 random samples and p-value of t-test between ploidies. Boxplot center lines, median; box limits, upper and lower quartiles; whiskers, 9th and 91st quantiles. b Estimated MLM effects and interaction effects of haplo-coverage, ploidy, and insertion frequency on non-genic TE content. Horizontal lines indicate 95% confidence intervals for each effect value. p-values for each coefficient corresponds to the t-statistic of the hypothesis test that the corresponding coefficient is equal to zero or not. c Fraction of non-genic insertions at high-frequency (HF) in tetraploids versus diploids by TE family. TE families with χ2 p-values < 0.05 are colored. p < 0.001: ***; p < 0.01: **; p < 0.05: *; p ≥ 0.05: ns. The source data underlying Figs. 3a and 3c are provided as a Source Data file.
Fig. 4
Fig. 4. Local positive selection on Copia genic insertions in tetraploids.
a Map of the tetraploid and diploid populations colored by clade. b Difference between tetraploids and diploids of the proportion of genic and near-genic (<250 bp) insertions present in only 1 clade (clade-specific) and private or shared within the clade for all, type A, and type B superfamilies with p-values of χ2 test between ploidies (type A: 2x n = 4597 private and 1098 shared, 4x n = 5524 private and 1159 shared; type B: 2x n = 8921 private and 2563 shared, 4x n = 9646 private and 2335 shared). c Proportion among shared clade-specific type A insertions from each type A superfamily in diploids and tetraploids with p-value of χ2 test between ploidies. d GO enrichments in diploids and tetraploids among genes carrying or nearby shared clade-specific insertions for type A TE superfamilies. e Proportion in diploids and tetraploids of clade-specific insertions at locally high frequencies (shared by three or more individuals) within intergenic regions, within or near genes, or within or near stimulus response genes (GO:0050896) for all superfamilies or only Copia insertions with p-values of χ2 test between ploidies. p < 0.001: ***; p < 0.01: **; p < 0.05: *; p ≥ 0.05: ns. The source data underlying Fig. 4b–e are provided as a Source Data file.
Fig. 5
Fig. 5. Railway-specific ATCOPIA78 solo-LTR exonic insertion within FLC.
a Picture of a tetraploid A. arenosa individual growing on railway ballasts near Świnoujście, Poland, in July 2017. b Non-vernalized flowering time, measured in days to the first open flower, of mountain (4x-mt) and railway (4x-rw) tetraploid populations. Data was redrawn from Baduel et al.. Boxplot center lines, median; box limits, upper and lower quartiles; whiskers, 9th and 91st quantiles. c FLC expression tetraploid populations from mountain (4x-mt) and railway (4x-rw) and the hybrid mountain-railway population BGS. Data were redrawn from Baduel et al.. Boxplot center lines, median; box limits, upper and lower quartiles; whiskers, 9th and 91st quantiles. d Map of FLC region with 442bp-long ATCOPIA78 solo-LTR insertion in 2nd exon of AaFLC1 identified by fosmid sequencing. e Proportion of individuals across populations by clade (pann pannonian, balt baltic, din = dinaric, s.carp = south-carpathians, w.carp = west carpathians, salb = swabian alb, rw = railway) carrying (C) or not-carrying (NC) the ATCOPIA78 solo-LTR insertion or not-assigned (NA). Hybrid mountain-railway population BGS is indicated with black triangle. The source data underlying Fig. 5e are provided as a Source Data file.

References

    1. GREGORY T. RYAN. The Evolution of the Genome. 2005. Genome Size Evolution in Animals; pp. 3–87.
    1. Wood TE, et al. The frequency of polyploid speciation in vascular plants. Proc. Natl Acad. Sci. U. S. A. 2009;106:13875–13879. doi: 10.1073/pnas.0811575106. - DOI - PMC - PubMed
    1. Wendel JF. The wondrous cycles of polyploidy in plants. Am. J. Bot. 2015;102:1753–1756. doi: 10.3732/ajb.1500320. - DOI - PubMed
    1. Casacuberta E, González J. The impact of transposable elements in environmental adaptation. Mol. Ecol. 2013;22:1503–1517. doi: 10.1111/mec.12170. - DOI - PubMed
    1. McClintock B. The significance of responses of the genome to challenge. Science. 1984;226:792–801. doi: 10.1126/science.15739260. - DOI - PubMed

Publication types

Substances

LinkOut - more resources