. 2019 Dec 20;10(1):5822.
doi: 10.1038/s41467-019-13786-y.

Structural basis for Fullerene geometry in a human endogenous retrovirus capsid

Affiliations

Structural basis for Fullerene geometry in a human endogenous retrovirus capsid

Oliver Acton et al. Nat Commun. .

Abstract

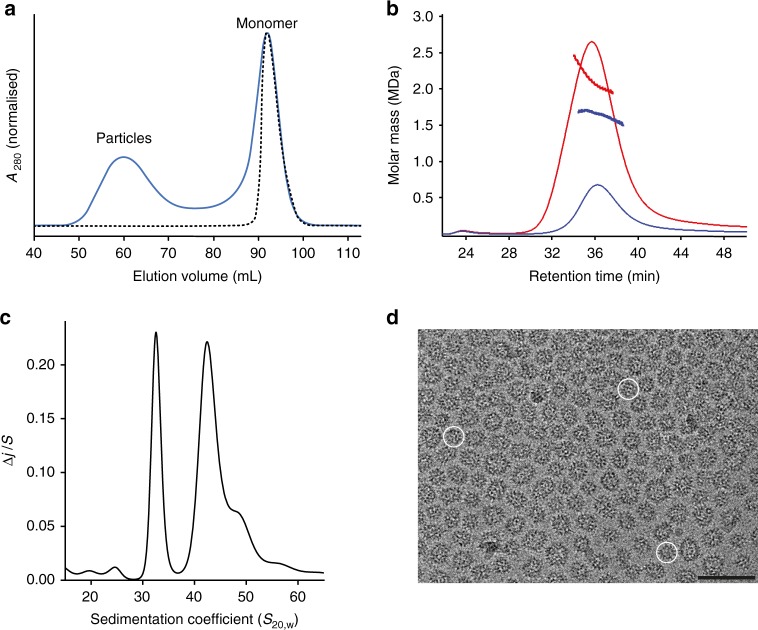
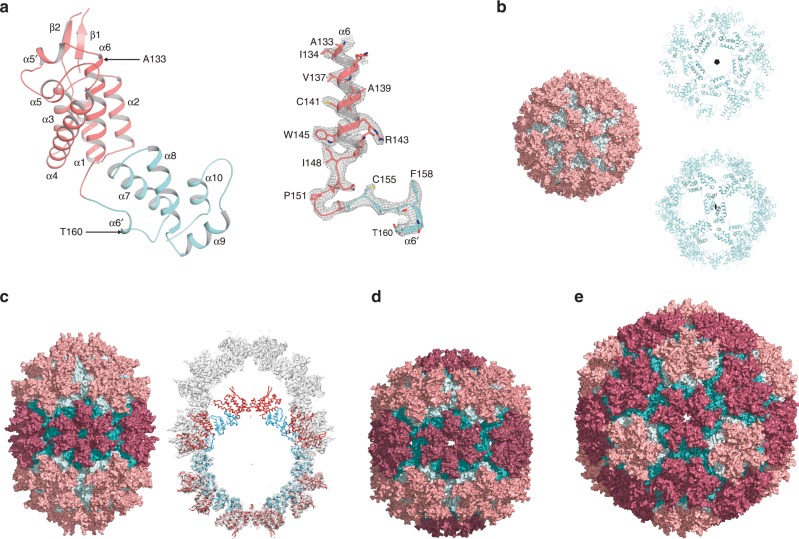
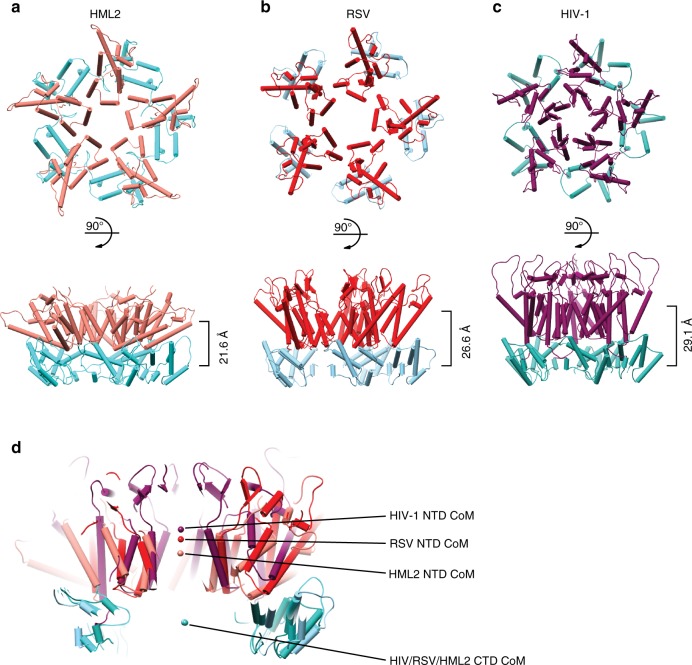
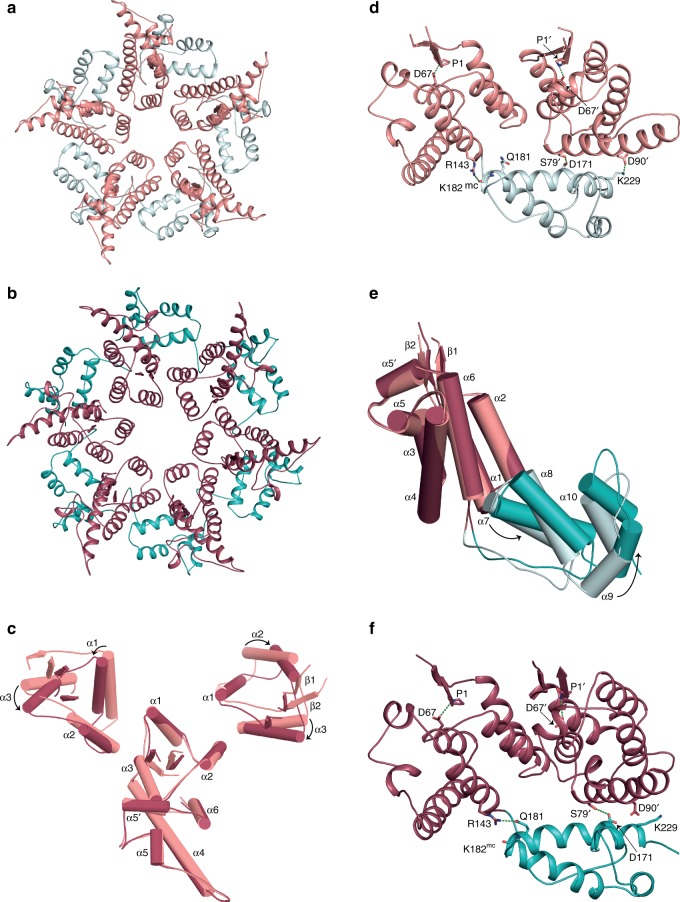
The HML2 (HERV-K) group constitutes the most recently acquired family of human endogenous retroviruses, with many proviruses less than one million years old. Many maintain intact open reading frames and provirus expression together with HML2 particle formation are observed in early stage human embryo development and are associated with pluripotency as well as inflammatory disease, cancers and HIV-1 infection. Here, we reconstruct the core structural protein (CA) of an HML2 retrovirus, assemble particles in vitro and employ single particle cryogenic electron microscopy (cryo-EM) to determine structures of four classes of CA Fullerene shell assemblies. These icosahedral and capsular assemblies reveal at high-resolution the molecular interactions that allow CA to form both pentamers and hexamers and show how invariant pentamers and structurally plastic hexamers associate to form the unique polyhedral structures found in retroviral cores.


Conflict of interest statement

The authors declare no competing interests.

Figures

Fig. 1
Fig. 1. Hydrodynamic and EM analysis of HML2 CArec particles.
a Gel filtration chromatogram (A280) of an HML2 CArec assembly reaction (1.4 M NaCl; solid blue line) and the unassembled monomer (0.1 M NaCl; dashed black line) separated on a Superose 6 16/60 GL column. The peaks containing HML2 CArec monomer and early eluting assembled particles are labelled. b Solution molecular mass of HML2 CArec particles. The molar mass distribution of HML2 CArec particles analysed by SEC-MALLS employing a Superose 6 10/30 column equilibrated in 1 M NaCl. The chromatograms were recorded from the 90° detector of the photometer from samples of HML2 CArec assembly reactions carried out at 2 mg mL−1 (blue) and 10 mg mL−1 (red). The points, colour-coded the same as the chromatograms, are the molar mass measured at 1-s intervals throughout the elution of the chromatographic peaks and show the presence of heterogeneous species ranging from 1.5 to 3.0 MDa. c Continuous distribution function of sedimentation coefficients. The plot shows the 20–60S region derived from sedimentation velocity analysis of a HML2 CArec particle preparation. HML2 CArec particles with sedimentation coefficients of 32S, 42S and 50S are the major species. d Cryo-electron micrograph of a field of HML2 CArec particles showing a predominance of small (T = 1) particles (circled examples) and larger capsular particles, scale bar is 50 nm.
Fig. 2
Fig. 2. Structure of HML2 CArec monomer and assembled particles.
a (Left) Cartoon representation of the HML2 CArec monomer from the T = 1 particle. The CArec-NTD, residues P1 to S153, and CArec-CTD, residues A154 to Q246, are coloured in pink and cyan, respectively. (Right) Experimental electron potential map (grey mesh) and model for the region indicated between α6 and α6′. Residues G152 to P156 in the linker region were built de novo into the density. b (Left) Surface representation of the T = 1 particle (60 monomers arranged as 12 pentamers) viewed along the five-fold symmetry axis with the NTDs and CTDs coloured as in a. (Right) The inner CTD “cage” viewed along the five-fold (upper) and the two-fold (lower). c (Left) D5 particle (90 monomers arranged as 12 pentamers and 5 hexamers) viewed along an equatorial pseudo-hexamer at the two-fold symmetry axis. Pentamer NTDs and CTDs are coloured as in a, and hexamer NTDs and CTDs are coloured in red and teal, respectively. (Right) Central slab of the D5 density map (grey surface) with the T = 1 particle aligned on the D5 polar pentamer. d D6 particle (108 monomers arranged as 12 pentamers and 8 hexamers) viewed along an equatorial pseudo-hexamer at the two-fold symmetry axis. Pentamers and hexamers are coloured as in c. e T = 3 particle (180 monomers arranged as 12 pentamers and 20 hexamers) viewed along an icosahedral two-fold symmetry axis. Pentamers and hexamers are coloured as in c.
Fig. 3
Fig. 3. Comparison of HIV-1, RSV and HML2 CA pentamers.
ac Top and side view cartoon representations of CA pentamers with α-helices shown as cylinders, from a HML2 CArec, b RSV (built from PDB: 1EM9 and 3G1I docked into EMD 5772) and c HIV-1 (PDB: 5MCY). NTDs are coloured pink, red and purple and CTDs are coloured light cyan, light blue and cyan for HML2, RSV and HIV-1, respectively. Pentamers are aligned with respect to their CTDs. In the lower panels, the distance between the centre of mass (CoM) for each NTD and CTD ring is shown on the right. d Central section through CA pentamers aligned with respect to CTDs. The CoM for NTD and CTD rings is represented by the spheres, colour coded as in ac and shows the coincident CoM for CTDs and the difference in CTD–NTD vertical displacement for each pentamer.
Fig. 4
Fig. 4. Intra-pentamer and intra-hexamer interactions in HML2 CArec particles.
a, b Cartoon representations of a the T = 1 pentamer and b the D6 polar hexamer viewed along the five-fold and six-fold symmetry axes, respectively. The NTDs and CTDs are coloured as in Fig. 2. c Alignment of the NTDs from a T = 1 pentamer (pink) and a D6 “polar” hexamer (red). The central NTD is aligned and the arrows indicate the relative displacement of helices α1, α2 and α3 in adjacent monomers at the intra-pentamer or intra-hexamer interface. d NTD–CTD interactions in the T = 1 pentamer. e NTD domain superposition showing the relative displacement of the CTD in the T = 1 pentamer (pink/cyan) and the D6 “polar” hexamer (red/teal). f NTD–CTD interactions in the D6 polar hexamer. In d, f residues making interactions are shown as sticks, with hydrogen bonds shown as dashes, the prime (′) notation indicates the adjacent NTD and “mc” indicates a main-chain interaction. The conserved N-terminal P1 to α3–D67 interaction is also shown in each NTD for orientation.
Fig. 5
Fig. 5. Structure-based sequence alignment of HML2 CArec with alpha and betaretroviral CAs.
The alignment was performed domain-wise using PROMALS3D, numbering refers to the HML2 CArec sequence and Uniprot accession codes for each aligned sequence are shown on the left. The five betaretroviral: HML2 CArec, JSRV, MPMV, mouse mammary tumour virus (MMTV), Simain type D retrovirus (SRV1) and squirrel monkey retrovirus (SMRV), and two alpharetroviral: RSV and avian leukosis virus (ALV) CAs are grouped separately (upper and lower). The regions corresponding to HML2 CArec secondary structures are shaded red for α-helices and green for β-strands and also displayed pictorially above the sequences. Residues with ≥50% identity are highlighted in black, and ≥50% similarity in grey. The major homology region (MHR) identified in the CA of all the orthoretroviruses is boxed. Residues in HML2 CArec that make inter-molecular CTD–CTD, NTD–CTD or intramolecular NTD–CTD contacts and those that form the conserved NTD β-hairpin hydrogen bond are indicated with the coloured asterisks (black, green, red and blue, respectively).
Fig. 6
Fig. 6. Variation of hexamer–pentamer and hexamer–hexamer interfaces in the T = 3 particle.
a A hexamer–pentamer–hexamer subassembly from the T = 3 particle shown in surface representation viewed from the exterior of the shell (upper) and from the side, highlighting the curvature (lower). NTDs and CTDs in the pentamer and those in the hexamer that interface with pentamers are coloured pink and cyan, respectively. NTDs and CTDs in the hexamer that interface with hexamers are coloured red and teal, respectively. b Cartoon representation of a hexamer from the T = 3 particle viewed down the icosahedral three-fold axis (colouring as in a). c, d NTD–CTD intra-hexamer interactions in the T = 3 hexamer. c A CA monomer, NTD (pink) and CTD (cyan) that interfaces with a neighbouring pentamer, and the adjacent NTD shown in red. d A CA monomer, NTD (red) and CTD (teal) that interfaces with a neighbouring hexamer, and the adjacent NTD is shown in pink. Residues making interactions are shown as sticks with hydrogen bonds shown as dashes, the prime (′) notation indicates the adjacent NTD and “mc” indicates a main-chain interaction. e NTD (pink/red) alignment of monomers in T = 3 hexamers showing the relative displacement of the CTD when the protomer interacts with either a neighbouring pentamer (cyan) or a neighbouring hexamer (teal). f Hexamer surface representation viewed perpendicular to the symmetry axis showing alternate CTDs displaced upwards (cyan, pentamer facing) and downwards (teal, hexamer facing). NTDs are coloured pink or red as in a.
Fig. 7
Fig. 7. Analysis of HML2 CArec CTD–CTD interactions.
a, b Structures of the CTD–CTD dimer interface in solution (lowest-energy NMR structure) (a) and in the T = 1 particle (b) are shown in cartoon representation. Residues involved in the interface are shown as sticks with hydrogen bonds shown as dashes. The boxed region is rotated 90° to show the hydrophobic interactions between helix α8 of each monomer, with the van der Waals radii shown as grey space fill. c Plot of the cross angles and displacements between α8 helices in all CTD–dimer pairs. The circles are colour-coded with respect to particle type, shown in the key. Groups 1, 2 and 3 are ringed and a schematic describing the nomenclature of POLAR, LONG and LAT is shown alongside. The class of interaction seen in each particle type and the group to which they belong is shown in the key below. d Panel of representative CTD dimers from the groups displayed in c. Top to bottom: NMR dimer (group 1); T = 1 pentamer (group 2); T = 3 pentamer on hexamer (group 2); T = 3 hexamer on hexamer (group 3). e alignment of CTD monomers (grey) showing relative displacement of the interacting CTD monomer in T = 1 (red; group 2) and T = 3 hexamer on hexamer (orange; group 3).

References

    1. Stoye JP. Studies of endogenous retroviruses reveal a continuing evolutionary saga. Nat. Rev. Microbiol. 2012;10:395–406. doi: 10.1038/nrmicro2783. - DOI - PubMed
    1. Johnson WE. Origins and evolutionary consequences of ancient endogenous retroviruses. Nat. Rev. Microbiol. 2019;17:355–370. doi: 10.1038/s41579-019-0189-2. - DOI - PubMed
    1. Belshaw R, et al. Long-term reinfection of the human genome by endogenous retroviruses. Proc. Natl Acad. Sci. USA. 2004;101:4894–4899. doi: 10.1073/pnas.0307800101. - DOI - PMC - PubMed
    1. Barbulescu M, et al. Many human endogenous retrovirus K (HERV-K) proviruses are unique to humans. Curr. Biol. 1999;9:861–868. doi: 10.1016/S0960-9822(99)80390-X. - DOI - PubMed
    1. Turner G, et al. Insertional polymorphisms of full-length endogenous retroviruses in humans. Curr. Biol. 2001;11:1531–1535. doi: 10.1016/S0960-9822(01)00455-9. - DOI - PubMed

Publication types

MeSH terms