. 2019 Dec 20;10(1):5808.
doi: 10.1038/s41467-019-13694-1.

Mitochondrial oxidative capacity and NAD+ biosynthesis are reduced in human sarcopenia across ethnicities

Affiliations

Mitochondrial oxidative capacity and NAD+ biosynthesis are reduced in human sarcopenia across ethnicities

Eugenia Migliavacca et al. Nat Commun. .

Abstract

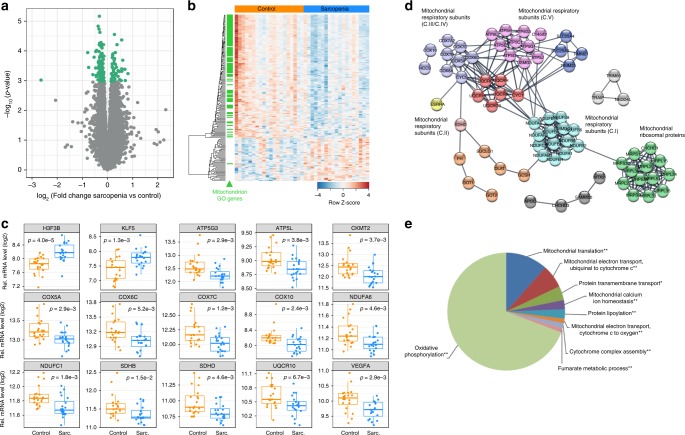
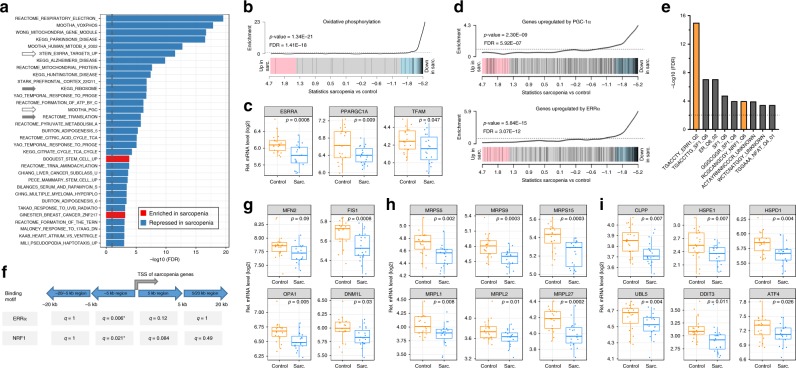
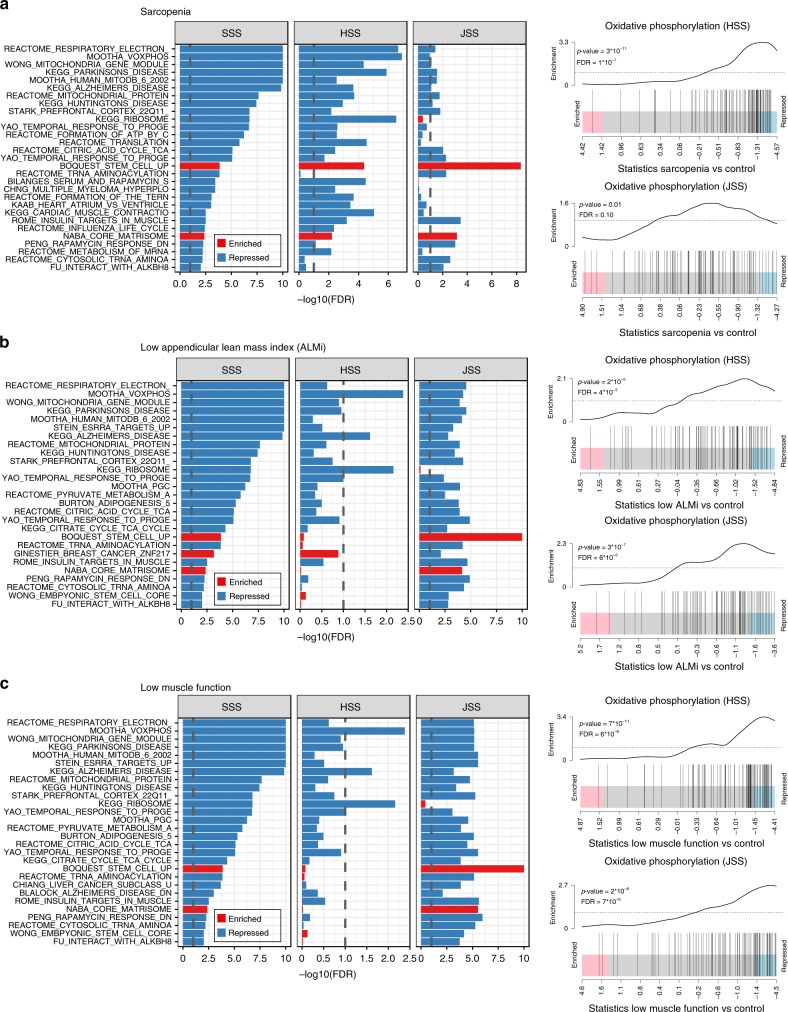
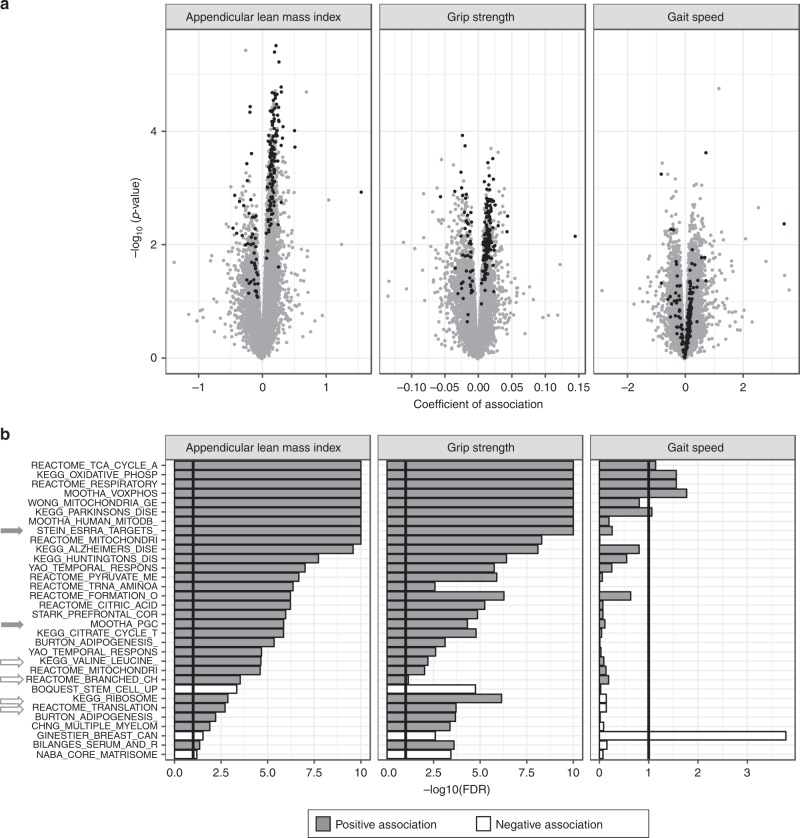
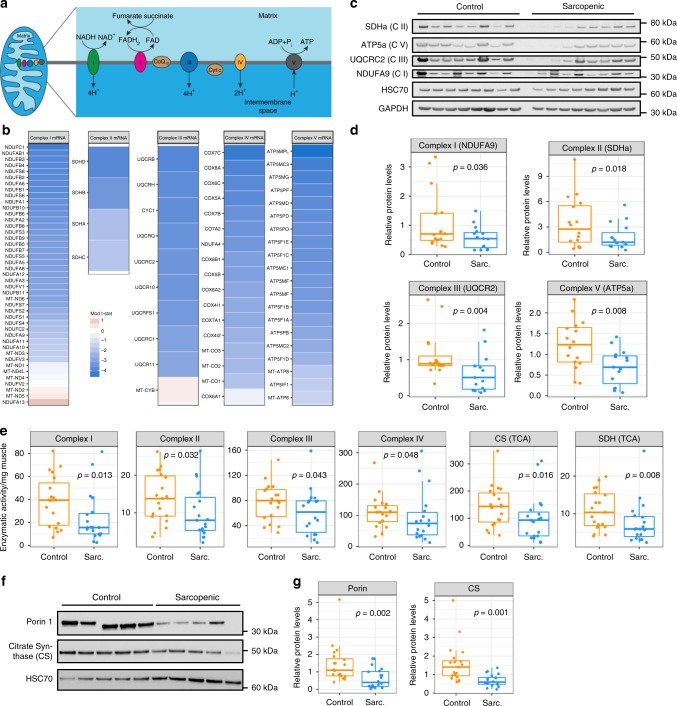
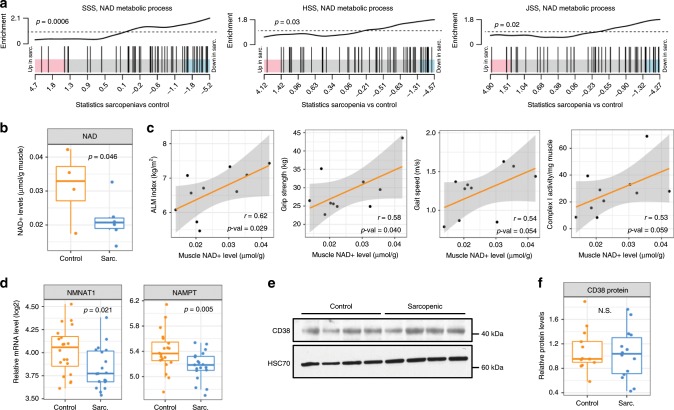
The causes of impaired skeletal muscle mass and strength during aging are well-studied in healthy populations. Less is known on pathological age-related muscle wasting and weakness termed sarcopenia, which directly impacts physical autonomy and survival. Here, we compare genome-wide transcriptional changes of sarcopenia versus age-matched controls in muscle biopsies from 119 older men from Singapore, Hertfordshire UK and Jamaica. Individuals with sarcopenia reproducibly demonstrate a prominent transcriptional signature of mitochondrial bioenergetic dysfunction in skeletal muscle, with low PGC-1α/ERRα signalling, and downregulation of oxidative phosphorylation and mitochondrial proteostasis genes. These changes translate functionally into fewer mitochondria, reduced mitochondrial respiratory complex expression and activity, and low NAD+ levels through perturbed NAD+ biosynthesis and salvage in sarcopenic muscle. We provide an integrated molecular profile of human sarcopenia across ethnicities, demonstrating a fundamental role of altered mitochondrial metabolism in the pathological loss of skeletal muscle mass and function in older people.


Conflict of interest statement

E.M., T.S., G.C., A.C., M.P.G., S.K., S. Mo, S. Me, J.M., F.R., P.D., and J.N.F. are full-time employees of the Société des Produits Nestlé (SPN). SA. K.M.G. and H.P.P. have received reimbursement for speaking at conferences sponsored by companies selling nutritional products. C.C. has received consultancy fees and honoraria from Amgen, Danone, Eli Lilly, GlaxoSmithKline, Medtronic, Merck, Nestlé, Novartis, Pfizer, Roche, Servier, Shire, Takeda, and UCB. K.M.G., Y.S.C., S.J.B., and N.K. are part of academic research programs that have received research funding from Abbott Nutrition, Nestec, and Danone. The remaining authors declare no competing interests.

Figures

Fig. 1
Fig. 1. RNA sequencing of human skeletal muscle in SSS.
a Volcano plot of differentially expressed genes in skeletal muscle of sarcopenic vs. age-matched healthy older people. p-values were calculated using moderated t-statistic. The 133 genes downregulated and 46 genes upregulated in sarcopenic muscle using a false-discovery rate (FDR) < 10% are represented in green. b Heatmap showing the 179 genes differentially expressed from (a) with FDR < 10%. Genes belonging to the cellular component GO term “mitochondrion” (GO:0005739) are labeled with a green tick. c Validation of gene expression changes in sarcopenic muscle of SSS for selected genes using quantitative mRNA profiling by nanoString nCounter; mRNA expression values are normalized to ten stable housekeeping genes. n = 40 muscle samples analyzed with a two sided t test. d Network representation of the protein-protein interactions of genes differentially regulated in sarcopenic muscle at FDR < 10% using STRING. Nodes with an interaction score > 0.9 are represented and colored by biological function. e Gene ontology enrichment of the genes regulated in sarcopenic muscle. Pie-chart represents the % of differentially expressed genes, *p < 0.05 and **p < 0.01 based on hypergeometric distribution tests. In a, b, d, e, n = 19–20 muscle samples per group from SSS participants.
Fig. 2
Fig. 2. Mitochondrial dysfunction is the major transcriptional change during sarcopenia in SSS.
a Gene-set enrichment analysis of sarcopenic vs control muscle using CAMERA and the C2 curated gene set collection from MSigDB. Gene sets are ordered according to the significance of their enrichment; only gene sets with an FDR < 0.1% and a gene overlap < 75% are represented. White arrows highlight gene sets linked to the transcriptional regulation of mitochondrial function; gray arrows highlight gene sets linked to protein synthesis. b Enrichment plot for the oxidative phosphorylation gene set “Mootha_VOxPhos; M18264”. c mRNA expression of transcriptional regulators of mitochondrial function in SSS sarcopenic vs. control muscle. d Enrichment plot for PGC-1α target genes and ERRα target gene set (“Mootha_PGC1a; M9788” and “Stein_ESRRa_Up; M18491”). e Transcription factor binding site enrichment of the 4 kb promoters of genes regulated in sarcopenic muscle at FDR q-value < 0.05. x-axis represents the MsigDB transcription factor gene sets that passed the significance threshold. f ERRα and NRF1 binding motif in the proximal and distal regions flanking the transcriptional start site (TSS) of the genes regulated in sarcopenic muscle at FDR q-value < 0.05. Benjamini Hochberg-corrected median-adjusted q-values were computed by performing 1000 hypergeometric test permutations. gi mRNA expression of genes regulating mitochondrial dynamics (g), mitochondrial ribosomal protein genes (h), and UPRmt genes (i) in SSS sarcopenic vs. control muscle. In c, gi, nominal p values of the moderated t-statistic are reported. For all panels, n = 19–20 muscle samples per group from SSS participants.
Fig. 3
Fig. 3. The transcriptional downregulation of mitochondrial bioenergetics in people with sarcopenia and low physical function is replicated in the HSS and JSS cohorts.
Gene-set enrichment analysis on muscle RNA expression in the discovery cohort (SSS) and two replication cohorts of different ethnicity (HSS and JSS) using CAMERA and the C2 curated gene set collection from MSigDB. a Sarcopenia vs. control in SSS, HSS, and JSS cohorts. b Low appendicular lean mass index vs. control in SSS, HSS, and JSS cohorts. c Low muscle function (grip strength or gait speed) vs. control in SSS, HSS, and JSS cohorts. In the left panels, gene sets are ordered according to the significance of their association in the SSS cohort; only gene sets with an overlap between sets <75% and an FDR < 1% in SSS and at least one other cohort are reported. The significance threshold of 10% FDR is represented by dashed gray lines and FDRs smaller than 10E−10 are trimmed. Right panels represent the enrichment plots for the “Mootha VOXPHOS” oxidative phosphorylation gene sets in the HSS and JSS cohorts (MSigDB reference M18264). For all panels, n = 39 (SSS and JSS) and n = 40 (HSS) muscle samples per cohort were stratified in the different phenotypes as described in Supplementary Table 2.
Fig. 4
Fig. 4. The transcriptional signature of sarcopenia in human muscle is mainly driven by the loss of appendicular lean mass index (ALMi) and grip strength.
a Volcano plot of genes associated with ALMi, grip strength and gait speed as continuous variables. p-values were calculated using moderated t-statistics and coefficients of association represent the log2 fold change of gene expression per unit of variable of interest. Genes which are differentially regulated with sarcopenia at a FDR < 10% (Fig. 1a) are represented in black. b Gene-set enrichment analysis of genes associated with ALMi, grip strength, and gait speed as continuous variables using CAMERA and the C2 curated gene set collection from MSigDB. Gene sets are ordered according to the significance of their association with ALMi; only gene sets with an FDR < 10% in at least one association and with a gene overlap <75% are represented. The significance threshold of 10% FDR is represented by black vertical lines and FDRs smaller than 10E−10 are trimmed at 10E−10. For all panels, n = 39 SSS muscle samples.
Fig. 5
Fig. 5. Mitochondrial bioenergetic activity is decreased in sarcopenic muscle.
a Schematic representation of a mitochondrion and the five respiratory complexes of the electron transport chain. b Gene expression change in sarcopenic vs. control muscle of mRNAs encoding the subunits of the 5 mitochondrial respiratory chain complexes, color coded according to moderated t-statistics (SSS cohort; n = 19–20 per group). c, d Muscle protein expression of representative subunits of mitochondrial respiratory chain complexes and mitochondrial proteins measured by western blot. c Representative blots from one gel, with GAPDH and HSC70 included as house-keeping normalization controls. d Quantification of protein levels relative to GAPDH and HSC70 in all remaining samples analyzed (SSS cohort; n = 15–16 per group; p values calculated using Mann–Whitney tests). e Enzymatic activity per mg muscle tissue of mitochondrial complexes I–IV, citrate synthase (CS) and succinate dehydrogenase (SDH) measured on mitochondrial extracts from remaining muscle biopsies of control and sarcopenic participants (SSS cohort; n = 18 per group; p values calculated with Mann–Whitney tests). f, g Muscle protein expression of porin 1 and CS measured by western blot on remaining muscle samples of the SSS cohort (n = 20 per group; p values calculated with Mann–Whitney tests).
Fig. 6
Fig. 6. NAD+ levels are low in Sarcopenic muscle.
a Gene-set enrichment plot of the “NAD metabolic process” (GO:0019674) on sarcopenic vs. control muscle mRNA in the discovery cohort (SSS, n = 19/20 per group) and 2 replication cohorts of different ethnicity (HSS, JSS; n = 4–28 per group as described in Supplementary Table 2). b NAD+ levels in remaining muscle biopsies of control and sarcopenic participants (SSS cohort, n = 4–6 per group; p values based on t-statistics). c Muscle NAD+ levels positively correlate to ALM-index, grip strength, gait speed, and mitochondrial complex I activity. Spearman rank correlation coefficient and its p value were calculated on n = 10 SSS muscle samples. d Muscle mRNA expression of NAD biosynthesis enzymes nicotinamide mononucleotide adenylyltransferase 1 (NMNAT1) and nicotinamide phosphoribosyltransferase (NAMPT) (SSS cohort; n = 19–20 per group; p values calculated with moderated t-statistics). e, f Muscle protein expression of CD38 by western blot on remaining muscle samples of SSS cohort (n = 13–14 per group; p values calculated with Mann–Whitney tests).

Similar articles

Cited by

References

    1. Goodpaster BH, et al. The loss of skeletal muscle strength, mass, and quality in older adults: the health, aging and body composition study. J. Gerontol. A. 2006;61:1059–1064. doi: 10.1093/gerona/61.10.1059. - DOI - PubMed
    1. Cartee GD, Hepple RT, Bamman MM, Zierath JR. Exercise promotes healthy aging of skeletal muscle. Cell Metab. 2016;23:1034–1047. doi: 10.1016/j.cmet.2016.05.007. - DOI - PMC - PubMed
    1. Distefano, G. & Goodpaster, B. H. Effects of exercise and aging on skeletal muscle. Cold Spring Harb. Perspect. Med.8, a029785 (2018). - PMC - PubMed
    1. Franceschi C, Campisi J. Chronic inflammation (inflammaging) and its potential contribution to age-associated diseases. J. Gerontol. A. 2014;69(Suppl 1):S4–S9. doi: 10.1093/gerona/glu057. - DOI - PubMed
    1. Junnila RK, List EO, Berryman DE, Murrey JW, Kopchick JJ. The GH/IGF-1 axis in ageing and longevity. Nat. Rev. Endocrinol. 2013;9:366–376. doi: 10.1038/nrendo.2013.67. - DOI - PMC - PubMed

Publication types

MeSH terms