. 2019 Dec 20;9(1):19577.
doi: 10.1038/s41598-019-56080-z.

Period doubling as an indicator for ecosystem sensitivity to climate extremes

Affiliations

Period doubling as an indicator for ecosystem sensitivity to climate extremes

Omer Tzuk et al. Sci Rep. .

Abstract

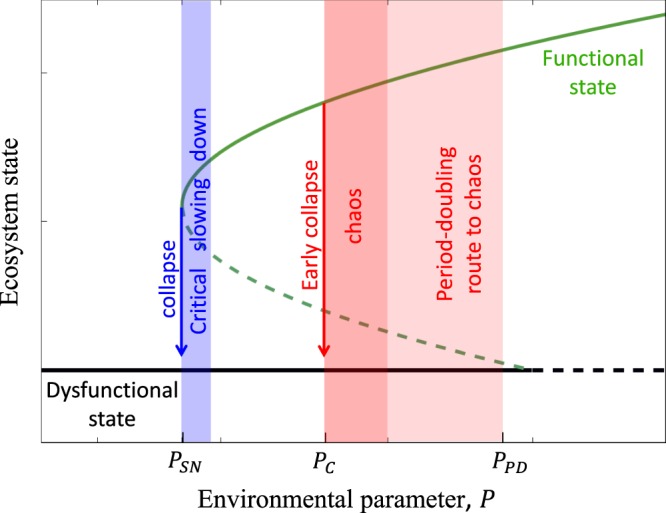
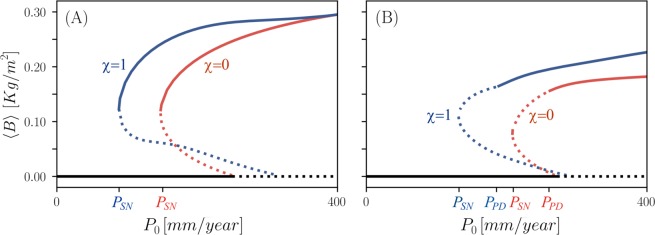
The predictions for a warmer and drier climate and for increased likelihood of climate extremes raise high concerns about the possible collapse of dryland ecosystems, and about the formation of new drylands where native species are less tolerant to water stress. Using a dryland-vegetation model for plant species that display different tradeoffs between fast growth and tolerance to droughts, we find that ecosystems subjected to strong seasonal variability, typical for drylands, exhibit a temporal period-doubling route to chaos that results in early collapse to bare soil. We further find that fast-growing plants go through period doubling sooner and span wider chaotic ranges than stress-tolerant plants. We propose the detection of period-doubling signatures in power spectra as early indicators of ecosystem collapse that outperform existing indicators in their ability to warn against climate extremes and capture the heightened vulnerability of newly-formed drylands. The proposed indicator is expected to apply to other types of ecosystems, such as consumer-resource and predator-prey systems. We conclude by delineating the conditions ecosystems should meet in order for the proposed indicator to apply.


Conflict of interest statement

The authors declare no competing interests.

Figures

Figure 1
Figure 1
A schematic illustration of early ecosystem collapse induced by period-doubling route to chaos in seasonally forced systems. Items in blue color represent the prevailing paradigm of ecosystem collapse across a tipping point, and the narrow range of critical slowing down that precedes the collapse in which existing early-warning signals apply. Items in red represent generic dynamical behaviors of seasonally forced systems. They include a cascade of period-doubling bifurcations, chaotic dynamics and early ecosystem collapse. The label PSN represents a threshold of an environmental parameter, such as precipitation, at which the functional state that describes resonant oscillations ceases to exist, the label PPD represents the threshold at which the oscillation period of the functional state doubles, and the label PC represents the threshold at which collapse to a dysfunctional state occurs.
Figure 2
Figure 2
Bifurcation diagrams of resonant vegetation oscillations under weak (A) and strong (B) seasonal forcing, obtain from Eq. (2). Horizontal and vertical axes represent precipitation rate and annual biomass average, respectively. Solid (dashed) lines represent stable (unstable) solutions. The blue curves describe 1:1 oscillating-vegetation solutions of the functional group χ = 1 (highest investment in tolerance to water stress), while the red curves describe similar solutions of the functional group χ = 0 (highest investment in fast growth). The black lines describe the bare-soil solution, which remains stable up to the bifurcation points with the oscillating-vegetation solutions. The label PSN denotes the saddle-node bifurcation at which the 1:1 oscillating-vegetation solutions cease to exist, which depends on the seasonality strength a. The label PPD denotes a period-doubling instability of 1:1 oscillating-vegetation solutions. Parameters are as in Table 1 and a = 0.01 (A), a = 1.0 (B).
Figure 3
Figure 3
Period-doubling route to chaos along the rainfall gradient and early collapse to bare soil, obtain by numerical integration of Eq. (2), for a fixed seasonality strength a = 1. Bifurcation diagrams (A,B) depict the annual maximal biomass values as functions of the mean annual precipitation value P0 for tradeoff parameter values of χ = 0 and χ = 1 respectively. They show cascades of period-doubling bifurcations as the mean annual precipitation P0 is decreased, followed by a range of chaotic oscillations, and collapse to bare soil at PC. (C,D) typical time series showing 1:1, 2:1 and 4:1 periodic oscillations, chaotic oscillations, and collapse to bare soil. Parameters are as in Table 1.
Figure 4
Figure 4
Period doubling as an early indicator for ecosystem collapse. Top panel shows the sequence of events and resulting dynamical behaviors along the precipitation axis for different functional groups (obtained from Eq. (2)), beginning with 1:1 (annual) oscillations (green), cascade of period-doubling bifurcations leading to 2n:1 (n = 1, 2, ...) oscillations (light green), chaotic oscillations (yellow), and collapse to bare soil (black solid line). Also shown is the early collapse to bare soil induced by adding a stochastic precipitation component (black dashed line). Panels A–C show power spectra (absolute values of the Fourier transform) for 1:1 periodic oscillations (C), 2:1 periodic oscillations (B) and chaotic oscillations (A). The precipitation rates and functional groups for which these power spectra were calculated are shown by the blue triangles in the top panel. Panels (D–F) show power spectra at increasing distances from collapse to bare soil (see red circles in top panel) for stochastic precipitation. The signatures of period doubling get smaller as the distances increase. Parameters are as in Table 1.

Similar articles

Cited by

References

    1. Hansen J., Sato M., Ruedy R. Perception of climate change. Proceedings of the National Academy of Sciences. 2012;109(37):E2415–E2423. doi: 10.1073/pnas.1205276109. - DOI - PMC - PubMed
    1. Seneviratne SI, Donat MG, Mueller B, Alexander LV. No pause in the increase of hot temperature extremes. Nature Climate Change. 2014;4:161–163. doi: 10.1038/nclimate2145. - DOI
    1. AghaKouchak A, Cheng L, Mazdiyasni O, Farahmand A. Global warming and changes in risk of concurrent climate extremes: Insights from the 2014 california drought. Geophysical Research Letters. 2014;41:8847–8852. doi: 10.1002/2014GL062308. - DOI
    1. Cook Benjamin I., Ault Toby R., Smerdon Jason E. Unprecedented 21st century drought risk in the American Southwest and Central Plains. Science Advances. 2015;1(1):e1400082. doi: 10.1126/sciadv.1400082. - DOI - PMC - PubMed
    1. Field, C. B. et al. Managing the risks of extreme events and disasters to advance climate change adaptation: A special report of the intergovernmental panel on climate change. Tech. Rep., Cambridge University Press, Cambridge, UK, and New York, NY, USA (2013).

Publication types