. 2019 Dec 20;10(1):5817.
doi: 10.1038/s41467-019-13805-y.

Agreement between two large pan-cancer CRISPR-Cas9 gene dependency data sets

Affiliations

Agreement between two large pan-cancer CRISPR-Cas9 gene dependency data sets

Joshua M Dempster et al. Nat Commun. .

Abstract

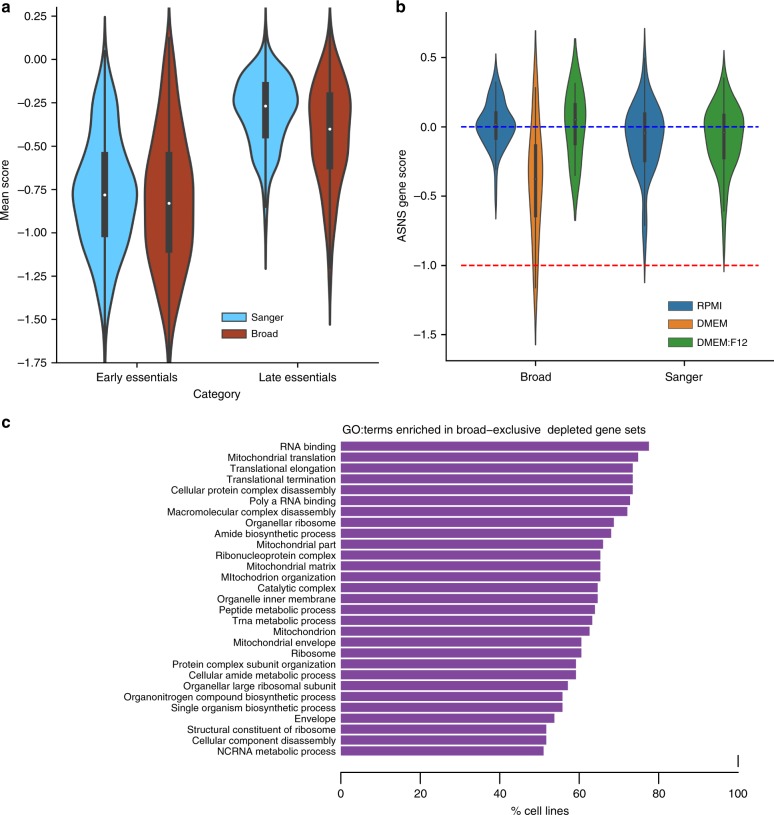
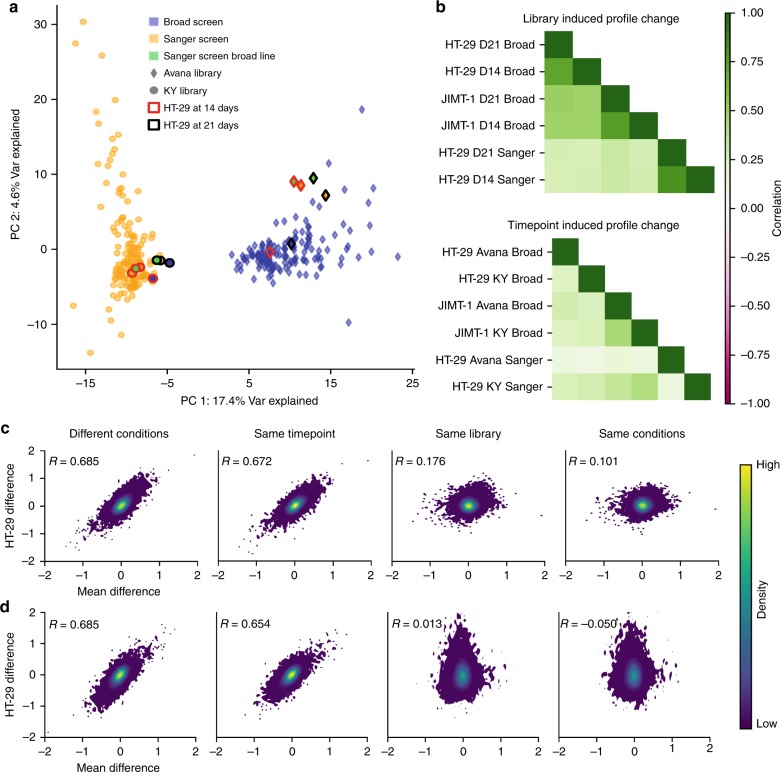
Genome-scale CRISPR-Cas9 viability screens performed in cancer cell lines provide a systematic approach to identify cancer dependencies and new therapeutic targets. As multiple large-scale screens become available, a formal assessment of the reproducibility of these experiments becomes necessary. We analyze data from recently published pan-cancer CRISPR-Cas9 screens performed at the Broad and Sanger Institutes. Despite significant differences in experimental protocols and reagents, we find that the screen results are highly concordant across multiple metrics with both common and specific dependencies jointly identified across the two studies. Furthermore, robust biomarkers of gene dependency found in one data set are recovered in the other. Through further analysis and replication experiments at each institute, we show that batch effects are driven principally by two key experimental parameters: the reagent library and the assay length. These results indicate that the Broad and Sanger CRISPR-Cas9 viability screens yield robust and reproducible findings.


Conflict of interest statement

C.P., F.M.B., H.N., M.J.G. and F.I. receive funding from Open Targets, a public-private initiative involving academia and industry. K.Y. and M.J.G. receive funding from AstraZeneca. M.J.G performed consultancy for Sanofi. J.G.D. and A.T. perform consulting for Tango Therapeutics. W.C.H. performs consulting for Thermo Fisher, AdjulB, MBM Capital, and Paraxel, and is a founder and scientific advisory board member of KSQ Therapeutics. T.R.G. performs consulting for GlaxoSmithKline, Sherlock Biosciences, and Foundation Medicine. F.I. performs consultancy for the joint CRUK - AstraZeneca Functional Genomics Centre. All the other authors declare no competing interests.

Figures

Fig. 1
Fig. 1. Comparison of experimental protocols and gene score results.
a Experimental settings and reagents used in the experimental pipelines underlying the two compared data sets. b Densities of individual gene scores in individual cell lines, in the Broad and Sanger data sets, across processing levels. The distributions of gene scores for previously identified essential genes are shown in red. c Examples of the relationship between a gene’s score rank in a cell line and the cell line’s rank for that gene using Broad unprocessed gene scores, with gene ranks in their 90th percentile of least dependent lines highlighted. Cell lines in the 90th percentile of least dependent lines on RPS8 (a common essential gene) still rank this gene among the strongest of their dependencies. d Distribution of gene ranks for the 90th percentile of least dependent cell lines for each gene in both data sets. Black dotted lines indicate natural thresholds at the minimum gene density along each axis. The y-axis is equivalent to the y-axis in (c) at the 90th percentile mark, as indicated by the arrows.
Fig. 2
Fig. 2. Reproducibility of gene and cell line dependency profiles.
a Examples of gene score pattern comparisons for selected known cancer genes. b Distribution of correlations of scores for individual genes in unprocessed data. c Gene scores for strongly selective dependencies across all cell lines, with the threshold for calling a line dependent set at an FDR of 0.05. d tSNE visualization of cell lines in unprocessed data based on the correlation between cell line profiles of gene scores. Colors represent the cell line while shape denotes the study of origin. e The same as in (d) but for data batch-corrected using ComBat. f Recovery of a cell line’s counterpart in the other data set before (Uncorrected) and after correction (Corrected). Value on the y-axis shows percentages of cell lines whose matching counterpart in the other data set is within its k-nearest cell lines, i.e. the k-neighborhood on the x-axis, based on a Pearson correlation distance metric. nAUC values are shown in brackets. Three different gene sets were considered to calculate the correlation between cell lines. First, using all genes (uncorrected and corrected all), second, using genes that are dependencies for at least one cell line (corrected variable) and third, using strongly selective dependencies (corrected SSD) genes.
Fig. 3
Fig. 3. Reproducibility of biomarkers.
a Results from a systematic association test between molecular features and differential gene dependencies (of the SSD genes) across the two studies. Each point represents a test for differential dependency on a given gene (on the second line of the point label) based on the status of a molecular feature (on the first line). b Precision/Recall and Recall/Specificity curves obtained when considering as positives controls the top significant molecular-feature/gene-dependency associations found in one of the studies and ranking all the tested molecular-feature/gene-dependency associations based on their p-values in the other study. To define top-significant associations different significance thresholds matching the quantile threshold specified in the legend are considered, where 100% includes all associations with FDR less than 5%. c Examples of significant statistical associations between genomic features and differential gene dependencies across the two studies. The box covers the interquartile range with the median line drawn within it. The whiskers of the boxplot extend to a maximum of 1.5 times the size of the interquartile range. d Comparison of results of a systematic correlation test between gene expression and dependency of SSD genes across the two studies. The gray dashed lines indicate the thresholds of significant correlations at a 5% false discovery rate identified for each study. Labeled points show the gene expression marker on the first line and gene dependency on the second line. Each tested association between gene expression and SSD dependency is represented by a single purple point. Regions with higher density of points are shown in white. e Examples of significant correlations between gene expression and dependencies consistently identified in both studies.
Fig. 4
Fig. 4. Influence of reagent library on gene score.
a Distributions of sgRNA depletion score correlations for sgRNAs targeting genes with varying NormLRT scores within each data set (left) and between them (right). Each gene is binned according to the mean of its NormLRT score across the two data sets. The x-axis defines the color gradient. The y-axis reports the average of all correlations between pairs of sgRNAs that belong to the same data set and target that gene. Boxes cover the interquartile range with the median indicated by a horizontal line. Whiskers extend up to 1.5 time the interquartile range with outliers shown as fliers. b Relationship between sgRNA correlation within data sets and gene correlation between data sets. The linear trend is shown for SSD genes. c The mean depletion of guides targeting common dependencies across all replicates vs Azimuth estimates of guide efficacy. The x-axis defines the color gradient. d Comparison of Broad and Sanger unprocessed gene scores for genes matching SSD with highest minimum median estimated sgRNA efficacy (MESE) across both libraries (left, TFA2C), common dependency in either data set and greatest difference between KY and Avana MESE (center, EIF3F), and the SSD with worst KY MESE (right, MDM2).
Fig. 5
Fig. 5. Influence of time point.
a Distribution of early and late common dependency gene scores in the Broad and Sanger data sets averaged across cell lines. Boxes cover the interquartile range with the median indicated by a horizontal line. Whiskers extend up to 1.5 time the interquartile range with outliers shown as fliers. b Distribution of corrected gene scores for asparagine synthetase (ASNS) by media and institute. Blue and orange lines indicate the median of nonessential and essential gene scores, respectively. c GO terms significantly enriched in Broad-exclusive dependencies. For each GO term the bar length indicates the ratio of cell lines showing Broad-exclusive dependencies with a statistically significant enrichment of that GO term.
Fig. 6
Fig. 6. Results of replication experiments.
a Original and replication screens from each institute plotted by their first two principal components. HT-29 screens are highlighted. Axes are scaled to the variance explained by each component. b Correlations of the changes in gene score caused when changing a single experimental condition. c The difference in unprocessed gene scores between Broad screens of HT-29 and the original Sanger screen (Sanger minus Broad), beginning with the Broad’s original screen and ending with the Broad’s screen using the KY library at the 14-day time point. Each point is a gene. The horizontal axis is the mean difference of the gene’s score between the Sanger and Broad original unprocessed data sets. d A similar plot taking the Broad’s original screen as the fixed reference and varying the Sanger experimental conditions (Broad minus Sanger).

Comment in

  • Cancer Screens: Better Together.
    Pruett-Miller SM. Pruett-Miller SM. CRISPR J. 2020 Feb;3(1):12-14. doi: 10.1089/crispr.2020.29084.spm. CRISPR J. 2020. PMID: 32091251 No abstract available.

References

    1. Prasad V. Perspective: the precision-oncology illusion. Nature. 2016;537:S63. doi: 10.1038/537S63a. - DOI - PubMed
    1. Barretina J, et al. The Cancer Cell Line Encyclopedia enables predictive modelling of anticancer drug sensitivity. Nature. 2012;483:603–607. doi: 10.1038/nature11003. - DOI - PMC - PubMed
    1. Garnett MJ, et al. Systematic identification of genomic markers of drug sensitivity in cancer cells. Nature. 2012;483:570–575. doi: 10.1038/nature11005. - DOI - PMC - PubMed
    1. Evers B, et al. CRISPR knockout screening outperforms shRNA and CRISPRi in identifying essential genes. Nat. Biotechnol. 2016;34:631–633. doi: 10.1038/nbt.3536. - DOI - PubMed
    1. Morgens DW, Deans RM, Li A, Bassik MC. Systematic comparison of CRISPR/Cas9 and RNAi screens for essential genes. Nat. Biotechnol. 2016;34:634–636. doi: 10.1038/nbt.3567. - DOI - PMC - PubMed

Publication types

MeSH terms