. 2019 Dec 20;10(1):5825.
doi: 10.1038/s41467-019-13768-0.

Definition of functionally and structurally distinct repressive states in the nuclear receptor PPARγ

Affiliations

Definition of functionally and structurally distinct repressive states in the nuclear receptor PPARγ

Zahra Heidari et al. Nat Commun. .

Abstract

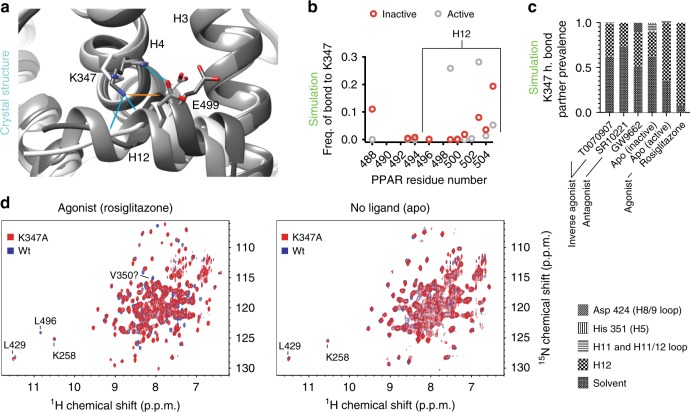
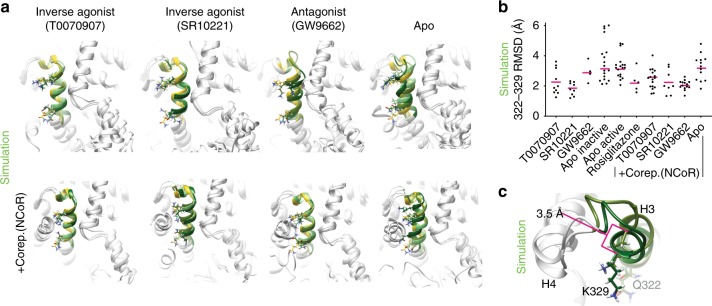
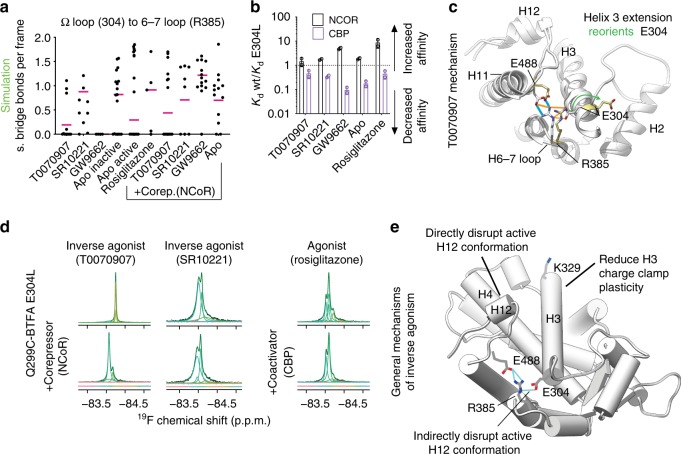
The repressive states of nuclear receptors (i.e., apo or bound to antagonists or inverse agonists) are poorly defined, despite the fact that nuclear receptors are a major drug target. Most ligand bound structures of nuclear receptors, including peroxisome proliferator-activated receptor γ (PPARγ), are similar to the apo structure. Here we use NMR, accelerated molecular dynamics and hydrogen-deuterium exchange mass spectrometry to define the PPARγ structural ensemble. We find that the helix 3 charge clamp positioning varies widely in apo and is stabilized by efficacious ligand binding. We also reveal a previously undescribed mechanism for inverse agonism involving an omega loop to helix switch which induces disruption of a tripartite salt-bridge network. We demonstrate that ligand binding can induce multiple structurally distinct repressive states. One state recruits peptides from two different corepressors, while another recruits just one, providing structural evidence of ligand bias in a nuclear receptor.


Conflict of interest statement

The authors declare no competing interests.

Figures

Fig. 1
Fig. 1. NMR indicates that the Helix 3 and helix 12 structural ensembles are diverse and ligand dependent.
a Overall architecture of a nuclear receptor signaling complex (PDB code 3DZY). The DNA-binding domain (DBD), hinge region, and ligand-binding domain (LBD) of PPARγ are shown bound to a coactivator peptide (coact.) and DNA. The heterodimerization partner of PPARγ is also shown (RXR). b Location of residues that were changed to cysteine and labeled with BTFA (colored spheres) on the PPARγ LBD for the two variants used in panels (d) and (e). Helix 2, 3, 4, and 12 and the omega loop (Ω loop) are indicated. c Illustration of the relationship between energy of a structural conformation, barrier height between conformations, and 19F NMR spectra. Color denotes the exchange rate between conformations in the energy wells. Purple denotes slow exchange (e.g., ms–s lifetime), tan denotes intermediate exchange (e.g., μs–ms lifetime), and olive denotes fast exchange (ps–ns lifetime). d, e 19F NMR spectra of PPARγ labeled on helix 3 (panel d) and helix 12 (panel e) with BTFA and bound to the indicated ligands. Individual deconvoluted peaks are colored according to chemical shift as indicated by the color bars below the spectra. The lower rows of spectra include a 2× molar ratio of CoRNR box peptides derived from the corepressor NCoR or the coactivator CREB-binding protein (CBP). The percentages in panel e refer to the portion of the spectral area found in the left peak. Asterisk denotes unfolded PPARγ, free BTFA, or BTFA labeled contaminating protein.
Fig. 2
Fig. 2. Extensive aMD simulations indicate a diverse PPARγ structural ensemble.
Multiple independent aMD simulations were run for the indicated PPARγ LBD complexes (see Supplementary Table 5). a, d The RMSD of helix 12 was calculated compared to active (chain A) and inactive (chain B) structures (PDB code: 1PRG). The energy of each trajectory snapshot was calculated and overlaid on the 2D RMSD to produce the displayed potential energy landscapes. b, e The aMD trajectory structures within a 0.2 × 0.2 Å RMSD square centered on the lowest energy wells (white circles in panels (a) and (d)) were clustered using k-means clustering into 5 clusters using CPPTRAJ. Arbitrary (i.e., CPPTRAJ chosen) representative structures are shown for the most prevalent clusters. The relative prevalence of the structure is indicated by the color of helix 12 ranging from dark green for the most prevalent to olive drab, light green, light blue, and then deep sky blue for the least prevalent. For reference, an active structure (rosiglitazone bound PPARγ; 2PRG chain A) is shown with helix 12 colored dim gray. c Representative structures from the third and second lowest energy wells in the inactive and active apo simulations, respectively, are shown in orange and dark green. Active and inactive crystal structures are shown in dim gray and light pink, respectively.
Fig. 3
Fig. 3. The apo ensemble contains little active-like helix 12 conformations.
a Examples of three classes of helix 4 to helix 12 bonding observed in deposited crystal structures (PDB codes 1PRG, 2PRG, and 3R5N). Almost all of the 176 active structures (chain A) available show bonding between K347 and the helix 12 backbone. Two of the 176 structures have a salt bridge between K347 and E499. None of the 176 inactive conformations (chain B) showed bonding between K347 and helix 12. b All 58 representative structures shown in Supplementary Fig. 1 were subjectively classified as having active-like or inactive-like helix 12 conformations. Prevalence of bonding between helix 12 residues and K347 calculated from 1 μs simulations of each representative structure in each class are shown. c The Boltzmann average values for interaction of the terminal side chain protons on K347 (i.e., NH3) and all other residues was calculated for PPARγ alone (apo) or bound to the indicated ligands. d Comparison of wt and K347A mutants bound to rosiglitazone or without ligand (apo) using TROSY-HSQC NMR. Source data are provided as a Source Data file (Source data_Heidari.xlsx).
Fig. 4
Fig. 4. Simulation prevalence of NCoR to PPARγ binding correlates with experiment.
a The prevalence of the indicated hydrogen and salt bridge bonds in individual 1μs conventional MD runs of representative structures from low energy wells (black circles) and the overall Boltzmann weighted average (pink) for the indicated complexes. b Boltzmann average prevalence of hydrogen bonding between the helix 3 charge clamp residue (K329) and NCoR and between a helix 4 residue (N340) and NCoR is shown. The average and standard deviation of these 4 values are shown (0.23 ± 0.005 and 0.55 ± 0.16). p = 9E−3; 95% CI for difference magnitude is 0.1–0.5; t = 3.8; df = 6; unpaired two-tailed t test. c The average decrease in affinity is greater for a mutation abolishing the helix 3 charge clamp (K329A) than for one abolishing the helix 4-NCoR bonding (N340A). The average and standard deviation of these 4 values are (1.4 ± 0.14 and 7.3 ± 1.18). p = 6E−5; 95% CI for difference magnitude is 4.4–7.4; t = 9.92; df = 6; unpaired two-tailed t test. These data are also presented in Supplementary Fig. 11. Each open circle represents the average Kd of the indicated mutant from two independent experiments divided by the average Kd of wt from four independent experiments for apo and PPARγ LBD bound to T0070907, SR10221, or GW9662. Source data are provided as a Source Data file (Source data_Heidari.xlsx).
Fig. 5
Fig. 5. Simulations indicate that the apo helix 3 charge clamp is dynamic and is stabilized upon ligand binding.
a The c-terminal portion of helix 3 is highlighted in color. The side chains of the charge clamp (K329) and the BTFA probe location (Q322) are shown. Dark green, olive drab, and light green indicate that the structures are a representative structure from the three lowest energy wells in the aMD energy landscape for the indicated PPARγ-ligand or PPARγ/ligand/NCoR complexes. A representative structure from the only well in the rosiglitazone PPARγ simulation is shown in yellow for reference. b RMSD of residues 322–329 of individual cMD simulations that were started from representative structures from the lowest energy wells for the indicated complexes compared to the same residues in the crystal structure 1PRG (apo PPARγ). Boltzmann averages are shown as magenta bars. c Comparison of representative structures from the lowest (dark green) and second lowest (olive drab) energy wells of inactive apo PPARγ. The distance between the alpha carbon atoms for the charge clamp residue K329 for the two structures is indicated. Source data are provided as a Source Data file (Source data_Heidari.xlsx).
Fig. 6
Fig. 6. A specific omega loop conformation is induced by the inverse agonist T0070907.
a Location of the Q299 probe on the omega loop. b 19F NMR spectra of PPARγQ299C-BTFA alone (apo) or bound to the indicated small molecules (top panel). Either corepressor (CoRNR) or coactivator (LxxLL) peptides were added to the apo and ligand complexes (lower two panels). The color of the deconvoluted peaks denotes chemical shift as shown by the color bar. Asterisk denotes signal that likely originates from the native cysteine (C313; see Supplementary Fig. 3).
Fig. 7
Fig. 7. General and T0070907 specific mechanisms of inverse agonism.
a Prevalence of the helix 6–7 loop (R385) to helix 3 (E304) salt-bridge is shown for the indicated complexes for individual cMD simulations started from representative structures from the lowest energy wells in the aMD potential energy landscapes (black circles). The Boltzmann average is shown by a magenta bar. b The change in affinity induced by mutation E304 is shown for the indicated complexes. The average (bar heights), standard deviation (error bars) and individual values (open circles) from two independent anisotropy experiments using protein from the same purification batch are shown. c Proposed intermediate state induced by T0070907 as illustrated by two crystal structures (1ZEO in khaki/white and 2PRG in white) where helix 3 extension leads to reorientation of E304 and disruption of the tripartite salt bridge network that stabilizes H12 in an active conformation. This reorientation upon helix 3 extension is observed in T0070907 and other simulations (Supplementary Fig. 4c). Blue indicates ideal hydrogen bonds, while orange lines indicate relaxed constraint hydrogen bonds (20° and 0.4 Å). d Omega loop probe fluorine NMR spectrum of E304L (PPARγQ299C_E304L-BTFA) bound to the indicated ligands with or without addition of corepressor (NCoR) or coactivator (CBP) peptide. The SR10221 used for this panel was produced at a different lab than that used in all other figures. The two batches were indistinguishable by proton NMR, mass spectrometry and their effect on affinity of PPARγ for coregulators (Supplementary Fig. 15). The color of the deconvoluted peaks denotes chemical shift as shown by the color bar. e The proposed general mechanisms for how inverse agonists induce higher affinity than apo for SMRT and NCoR CoRNR box peptides is shown. Source data are provided as a Source Data file (Source data_Heidari.xlsx).

Similar articles

Cited by

References

    1. Bookout AL, et al. Anatomical profiling of nuclear receptor expression reveals a hierarchical transcriptional network. Cell. 2006;126:789–799. doi: 10.1016/j.cell.2006.06.049. - DOI - PMC - PubMed
    1. Santos R, et al. A comprehensive map of molecular drug targets. Nat. Rev. Drug Discov. 2017;16:19–34. doi: 10.1038/nrd.2016.230. - DOI - PMC - PubMed
    1. Hua G, Zein N, Paulen L, Chambon P. The glucocorticoid receptor agonistic modulators CpdX and CpdX-D3 do not generate the debilitating effects of synthetic glucocorticoids. Proc. Natl Acad. Sci. 2019;116:14200–14209. doi: 10.1073/pnas.1908264116. - DOI - PMC - PubMed
    1. Soccio RE, Chen ER, Lazar MA. Thiazolidinediones and the promise of insulin sensitization in type 2 diabetes. Cell. Metab. 2014;20:573–591. doi: 10.1016/j.cmet.2014.08.005. - DOI - PMC - PubMed
    1. Kahn SE, et al. Glycemic durability of rosiglitazone, metformin, or glyburide monotherapy. N. Engl. J. Med. 2006;355:2427–2443. doi: 10.1056/NEJMoa066224. - DOI - PubMed

Publication types

MeSH terms