. 2019 Dec 20;10(1):5803.
doi: 10.1038/s41467-019-13835-6.

Ultrastructure of the axonal periodic scaffold reveals a braid-like organization of actin rings

Affiliations

Ultrastructure of the axonal periodic scaffold reveals a braid-like organization of actin rings

Stéphane Vassilopoulos et al. Nat Commun. .

Abstract

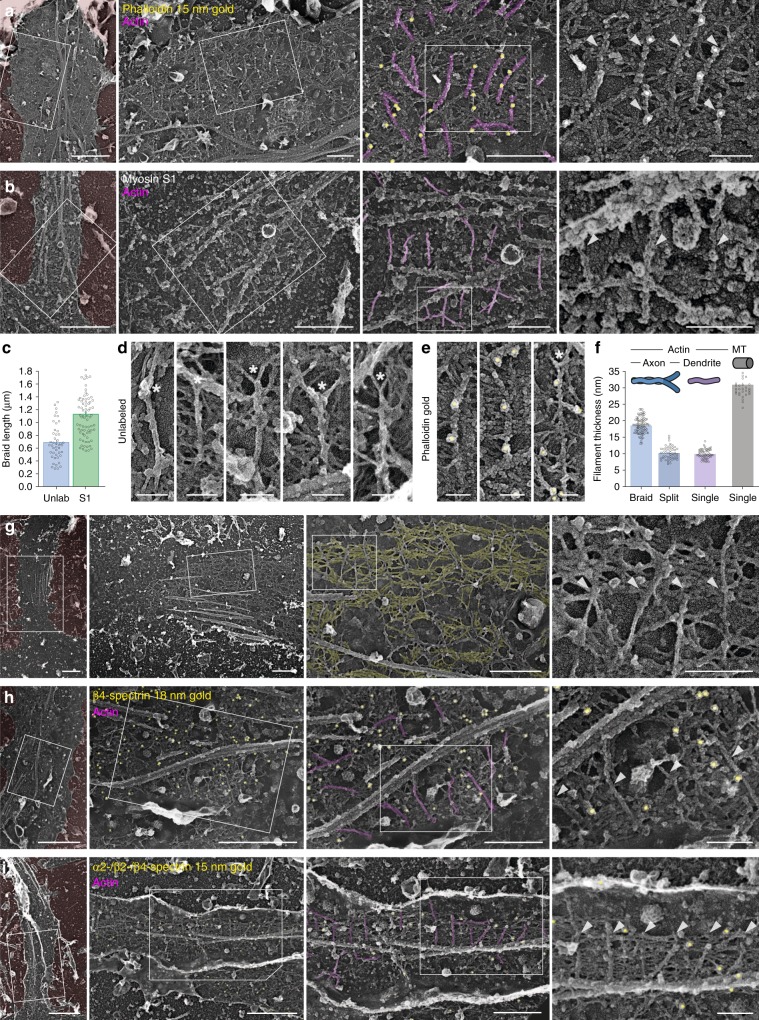
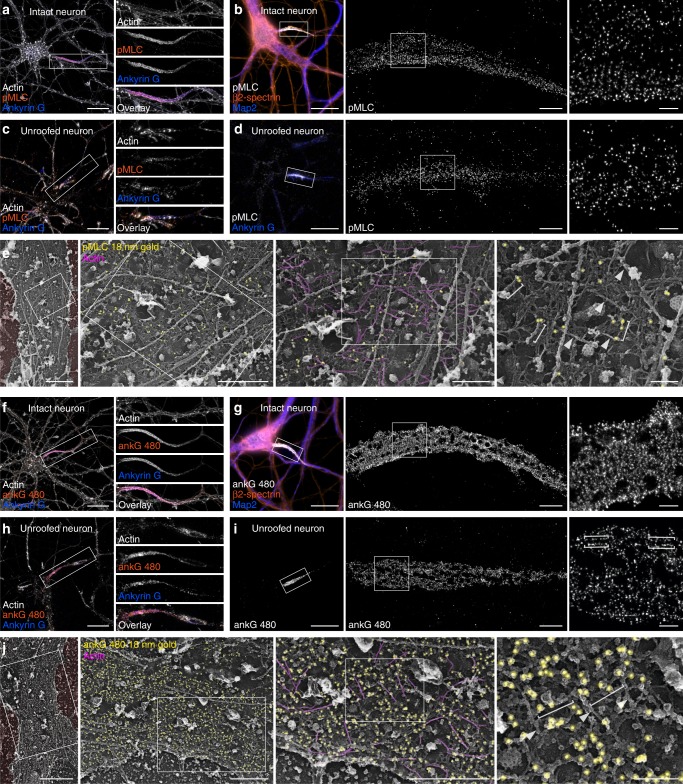
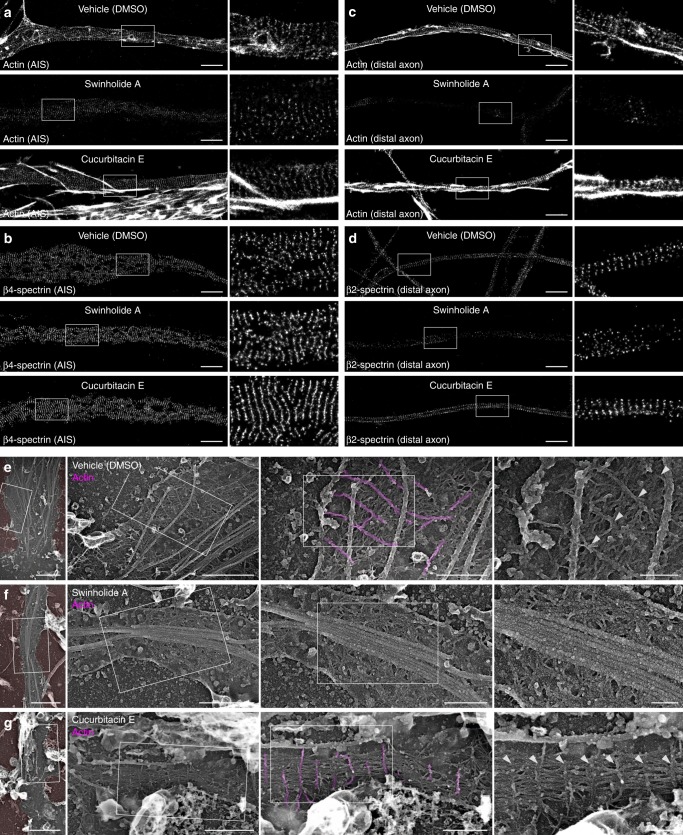
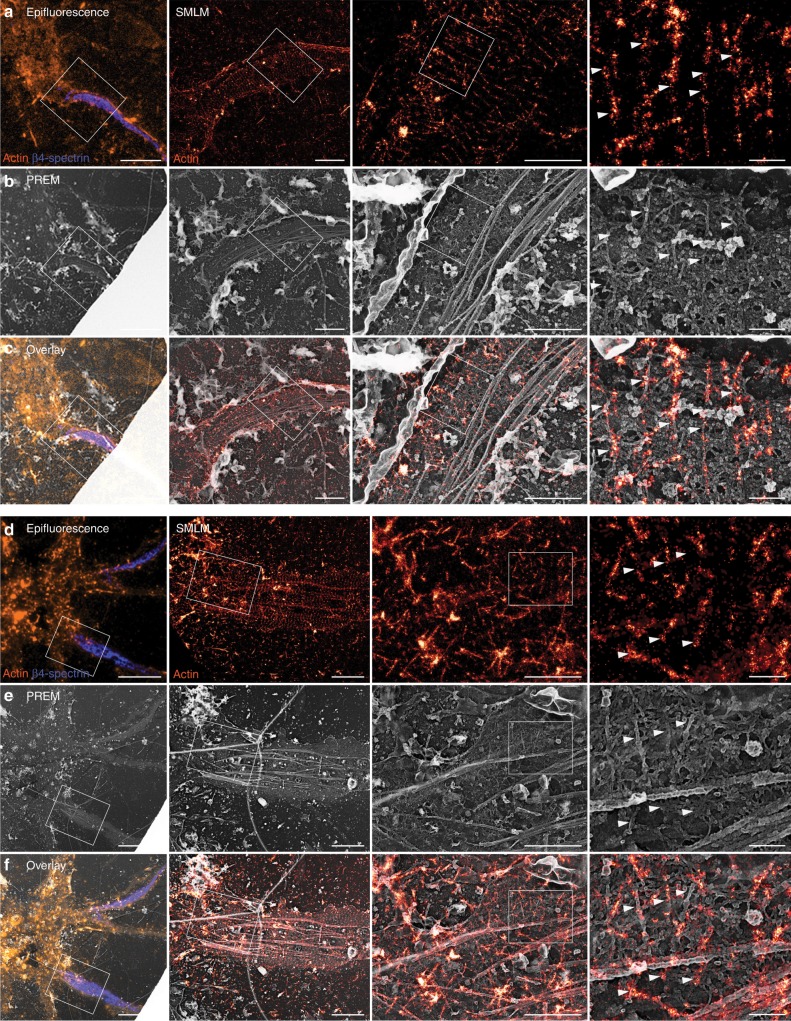
Recent super-resolution microscopy studies have unveiled a periodic scaffold of actin rings regularly spaced by spectrins under the plasma membrane of axons. However, ultrastructural details are unknown, limiting a molecular and mechanistic understanding of these enigmatic structures. Here, we combine platinum-replica electron and optical super-resolution microscopy to investigate the cortical cytoskeleton of axons at the ultrastructural level. Immunogold labeling and correlative super-resolution/electron microscopy allow us to unambiguously resolve actin rings as braids made of two long, intertwined actin filaments connected by a dense mesh of aligned spectrins. This molecular arrangement contrasts with the currently assumed model of actin rings made of short, capped actin filaments. Along the proximal axon, we resolved the presence of phospho-myosin light chain and the scaffold connection with microtubules via ankyrin G. We propose that braided rings explain the observed stability of the actin-spectrin scaffold and ultimately participate in preserving the axon integrity.


Conflict of interest statement

The authors declare no competing interests

Figures

Fig. 1
Fig. 1. The actin-spectrin MPS is conserved in unroofed axons and visible by PREM.
a Epifluorescence image of an unroofed neuron labeled for actin (gray), β4-spectrin (orange), and β2-spectrin (blue). be SMLM images showing the periodic pattern of actin b, β4-spectrin c, β2-spectrin d, and α2/β2/β4-spectrin e along unroofed axons. fh Left, autocorrelation curve of the labeling for actin f, β4-spectrin g, or β2-spectrin h. Spacing (s) is indicated. Right, measurement of the corresponding autocorrelation amplitude (mean ± SEM, n = 18–42 tracings from 4–6 independent experiments, ns non-significant, ***p < 0.001, ANOVA post-hoc test). i Low-magnification PREM view of an unroofed neuron and its axon (yellow). jk PREM views of an unroofed axon showing the regularly spaced braids (magenta, arrowheads) perpendicular to microtubule fascicles. l Distance between regularly spaced actin braids in axons measured on PREM views (mean ± SEM, n = 50 braids from five independent experiments). m PREM view of an unroofed dendrite from the same neuron shown in k containing mostly longitudinal actin filaments (arrowheads). Scale bars 40 µm a, 2 µm be, 20 µm i, 5, 2, 0.5, and 0.2 µm jk, m, left to right). Source data for graphs fh, l are provided as a Source Data file.
Fig. 2
Fig. 2. Actin rings are braids of long filaments connected by a spectrin mesh.
a PREM views of axonal actin braids (magenta, arrowheads) labeled with fluorescent phalloidin and immunogold detection of the fluorophore (15 nm gold beads, pseudo-colored yellow). b PREM views of myosin S1-treated axonal actin braids (magenta, arrowheads). c Length of the actin braids measured on PREM views in unlabeled (unlab) and myosin S1-labeled (S1) axons (mean ± SEM, n = 45–76 braids from 2 to 5 independent experiments). d, e High-magnification views of individual unlabeled d and immunogold-labeled e actin braids showing Y bifurcations (asterisks). f Thickness of filaments measured on PREM views: axonal actin braids before (braid) and after (split) splitting (blue), dendritic single-actin filaments (purple) and axonal microtubules (gray) (mean ± SEM, n = 33–90 braids from 3 to 8 independent experiments). g PREM views of unroofed axons showing the mesh (yellow) connecting actin braids. h PREM views of unroofed axons immunogold-labeled (yellow) for β4-spectrin between actin braids (magenta, arrowheads). i PREM views of unroofed axons simultaneously immunogold-labeled (yellow) for α2/β2/β4-spectrin between actin braids (magenta, arrowheads). Scale bars 2 µm, 1, 0.5, 0.2 µm ab, gi, left to right), 0.1 µm d, e. Source data for graphs c and f are provided as a Source Data file.
Fig. 3
Fig. 3. Localization of pMLC and ankyrin G at the AIS of unroofed neurons.
a Epifluorescence image of an intact neuron labeled for actin (gray), pMLC (orange), and ankyrin G (blue). b SMLM images showing the pattern of pMLC along an intact AIS. c Epifluorescence image of an unroofed neuron labeled for actin (gray), pMLC (orange), and ankyrin G (blue). d SMLM images showing the pattern of pMLC along an unroofed AIS. e PREM views of an unroofed AIS immunogold-labeled (yellow) for pMLC (brackets) apposed to actin braids (magenta, arrowheads). f Epifluorescence image of an intact neuron labeled for actin (gray), 480 kDa ankyrin G tail (ankG 480, orange), and ankyrin G (blue). g SMLM images showing the pattern of ankG 480 along an intact AIS. h Epifluorescence image of an unroofed neuron labeled for actin (gray), ankG 480 (orange), and ankyrin G (blue). i SMLM images showing the pattern of ankG 480 along an unroofed AIS, delineating the profiles of putative microtubules (brackets). j PREM views of an unroofed AIS immunogold-labeled (yellow) for ankG 480 appearing along spectrin filaments (brackets) in between actin braids (magenta, arrowheads). Scale bars 20 µm a, c, f, h; 2 µm, 0.5 µm b, d, g, i, left to right; 2 µm, 1, 0.5, 0.2 µm e, j, left to right.
Fig. 4
Fig. 4. Actin perturbation impacts the MPS ultrastructure.
ad SMLM images of AIS and distal axons treated for 3 h with vehicle (DMSO 0.1%), swinholide A (100 nm) or cucurbitacin E (5 nm), labeled for actin a and c, β4-spectrin b, and β2-spectrin d. eg PREM views of unroofed axons from neurons treated with vehicle e, swinholide A f, or cucurbitacine E g showing the presence or absence of actin braids (magenta, arrowheads). Scale bars 2 µm ad, 2 µm, 1, 0.5, 0.2 µm eg, left to right.
Fig. 5
Fig. 5. Correlative SMLM/PREM resolves the ultrastructure of actin rings.
a Left, epifluorescence image of an unroofed neuron labeled for actin (orange) and β4-spectrin (blue). Right, SMLM images of the unroofed proximal axon labeled for actin. b Corresponding PREM views of the same unroofed neuron and axon. c Overlay of the SMLM image and PREM views showing the correspondence between actin rings in SMLM and braids in PREM (arrowheads). df Correlative SMLM/PREM images similar to ac for an additional unroofed axon. Scale bars 20, 2, 1, 0.2 µm (from left to right).
Fig. 6
Fig. 6. Correlative SMLM/PREM of β4-spectrin and ankyrin G.
Left, epifluorescence image of an unroofed neuron labeled for β4-spectrin (orange) and β2-spectrin (blue). Right, SMLM images of the unroofed proximal axon labeled for β4-spectrin. b Corresponding PREM views of the same unroofed neuron and axon. c Overlay of the SMLM image and PREM views showing the intercalation between spectrin tetramer centers in SMLM and actin breads in PREM (arrowheads). df Correlative imaging of 480 kDa ankyrin G tail (ankG 480) along an unroofed proximal axon by SMLM and PREM. Actin braids are indicated by arrowheads, and contacts between ankyrin G and microtubules are shown by asterisks. Scale bars 20, 2, 1, 0.2 µm (from left to right).

References

    1. Leterrier C, Dubey P, Roy S. The nano-architecture of the axonal cytoskeleton. Nat. Rev. Neurosci. 2017;18:713–726. - PubMed
    1. Tas RP, Kapitein LC. Exploring cytoskeletal diversity in neurons. Science. 2018;361:231–232. - PubMed
    1. Peters, A., Palay, S. L. & Webster, H. D. The fine structure of the nervous system. (Oxford Univ. Press, 1991).
    1. Papandréou M-J, Leterrier C. The functional architecture of axonal actin. Mol. Cell Neurosci. 2018;91:151–159. - PubMed
    1. Sigal YM, Zhou R, Zhuang X. Visualizing and discovering cellular structures with super-resolution microscopy. Science. 2018;361:880–887. - PMC - PubMed

Publication types