. 2019 Dec 20;10(1):5806.
doi: 10.1038/s41467-019-13646-9.

Forty-five patient-derived xenografts capture the clinical and biological heterogeneity of Wilms tumor

Affiliations

Forty-five patient-derived xenografts capture the clinical and biological heterogeneity of Wilms tumor

Andrew J Murphy et al. Nat Commun. .

Abstract

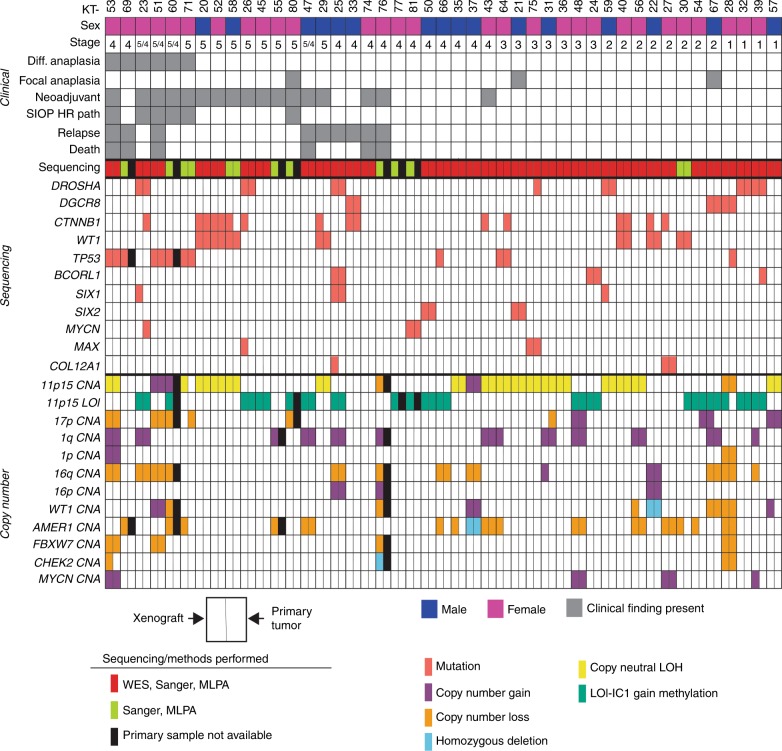
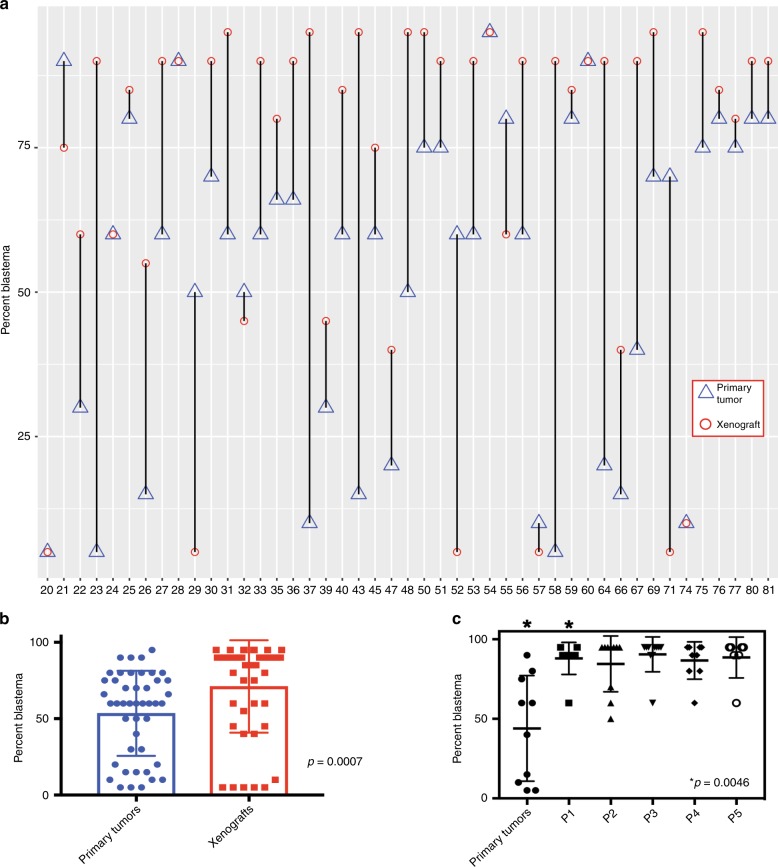
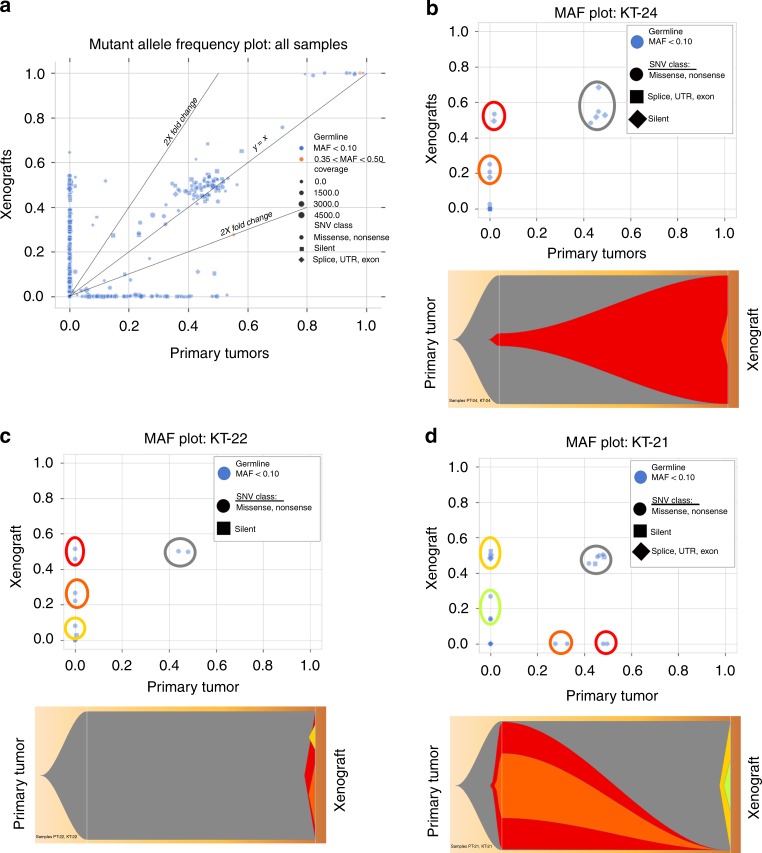
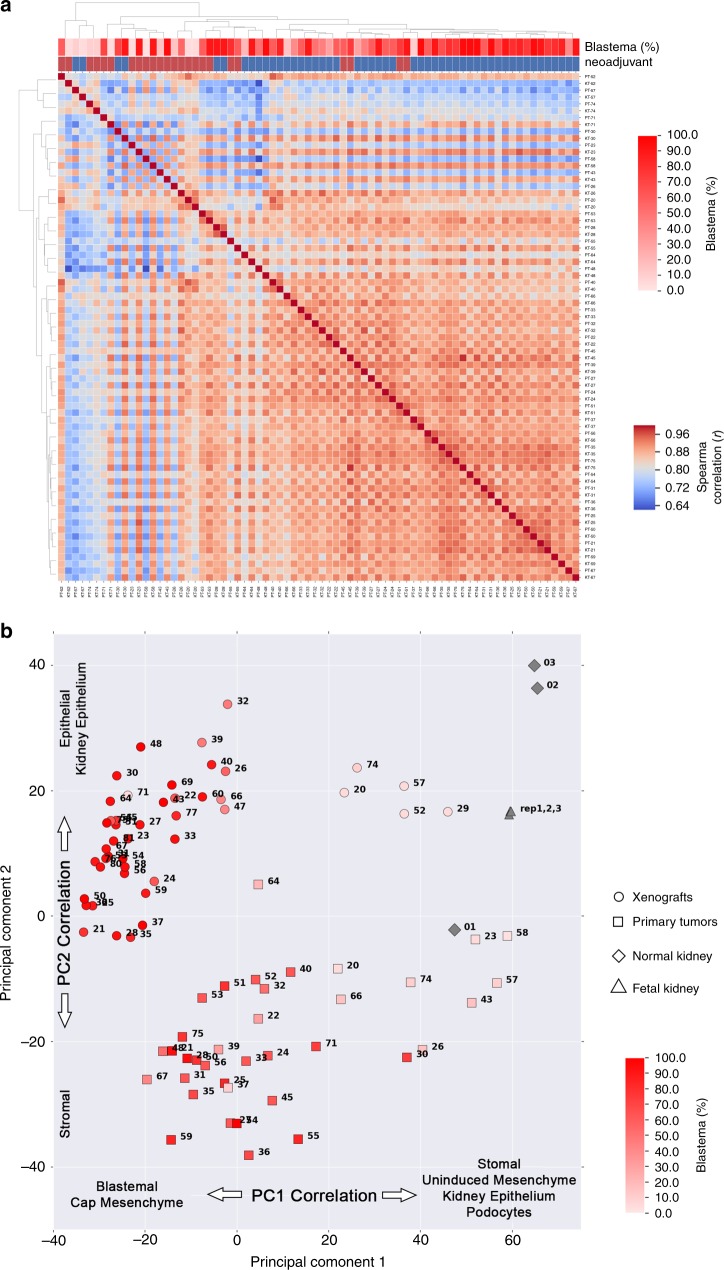
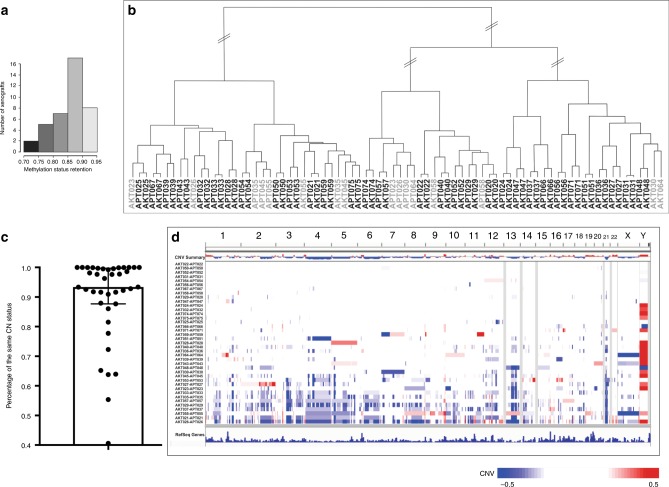
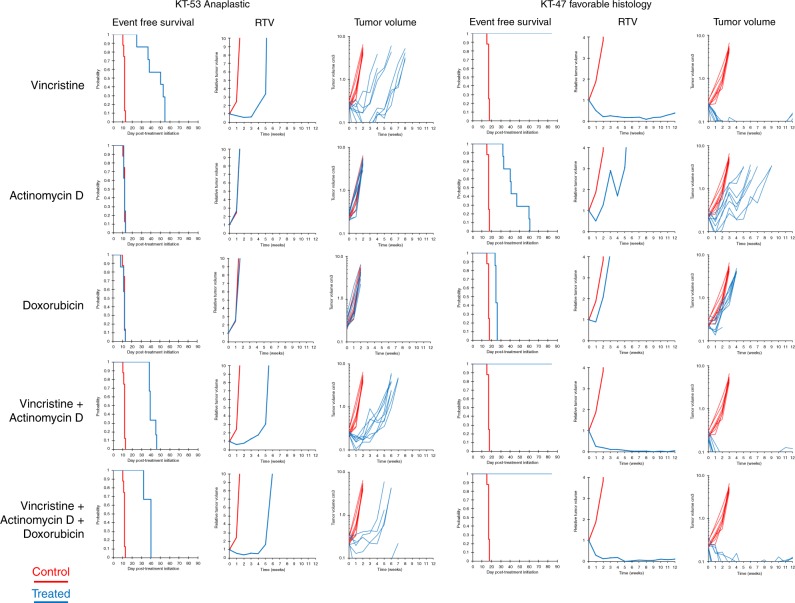
The lack of model systems has limited the preclinical discovery and testing of therapies for Wilms tumor (WT) patients who have poor outcomes. Herein, we establish 45 heterotopic WT patient-derived xenografts (WTPDX) in CB17 scid-/- mice that capture the biological heterogeneity of Wilms tumor (WT). Among these 45 total WTPDX, 6 from patients with diffuse anaplastic tumors, 9 from patients who experienced disease relapse, and 13 from patients with bilateral disease are included. Early passage WTPDX show evidence of clonal selection, clonal evolution and enrichment of blastemal gene expression. Favorable histology WTPDX are sensitive, whereas unfavorable histology WTPDX are resistant to conventional chemotherapy with vincristine, actinomycin-D, and doxorubicin given singly or in combination. This WTPDX library is a unique scientific resource that retains the spectrum of biological heterogeneity present in WT and provides an essential tool to test targeted therapies for WT patient groups with poor outcomes.


Conflict of interest statement

The authors declare no competing interests.

Figures

Fig. 1
Fig. 1. 45 WTPDX and corresponding primary tumors.
Each KT column represents an individual xenograft. Clinical characteristics are outlined in the top panel. Children’s Oncology Group (COG) disease stage is indicated. For bilateral WT cases (stage 5) also with metastasis present, the stage is indicated as 5/4. Neoadjuvant indicates that the patient received neoadjuvant chemotherapy before surgical resection and establishment of the WTPDX. SIOP HR path (as per International Society for Pediatric Oncology Classification) indicates high-risk histology (diffuse anaplasia or blastemal predominance) after neoadjuvant chemotherapy. Relapse indicates that the patient later experienced relapse during the clinical course. Genetic variants and chromosomal copy number alterations (CNAs) are displayed in the lower two panels. The type of sequencing performed (WES with target capture sequencing, Sanger sequencing, or both) is shown. Each finding is depicted for the WTPDX—primary tumor pair, with the left rectangle representing presence of the variant or CNA in the WTPDX, and the right rectangle representing an equivalent finding in the parent primary tumor. An unfilled (white) rectangle indicates absence of this finding in either the WTPDX or primary tumor. Specimens for which primary tumor tissue was not available are indicated by black rectangles.
Fig. 2
Fig. 2. WTPDX recapitulate histologic and molecular phenotypes of primary tumors.
Paired favorable-histology, triphasic primary Wilms tumor (WT) a and WTPDX b corresponding to case KT-45 are shown in the top two rows. WTPDX b maintain the epithelial, stromal, and blastemal triphasic histology of primary WT a. WTPDX maintain blastemal SIX2 expression (middle) and WT1 expression (right) b compared with the primary WT a. Paired unfavorable-histology (diffuse anaplasia) WT c and WTPDX d corresponding to case KT-60. WTPDX d maintain the hyperchromatic, large nuclei, and atypical multipolar mitoses (arrows) of the primary WT c. WTPDX d retain p53 immunostaining that is characteristic of tumors with TP53 missense mutations. Scale bar = 100 μm.
Fig. 3
Fig. 3. Early-passage WTPDX enrich for blastema by histology.
a The percentage of blastema is plotted for primary tumors (triangles) versus corresponding early-passage xenografts (circles), demonstrating that most xenografts enrich for the blastemal component by histology. b A significant increase in the percentage of blastema by histology was found when the entire group of primary tumors versus early-passage xenografts were compared. c The percent blastema was compared between nine triphasic primary tumors and the first five passages of corresponding WTPDX (P1-P5). A significant increase in percent blastema was found at the first passage and maintained through passage 5. Error bars in b and c represent mean ± standard deviation. P values are from a paired two-tailed t-test.
Fig. 4
Fig. 4. Subclonal analysis of WTPDX and parent primary tumors.
a Mutant allele frequency (MAF) plot of the entire target capture validation sequencing dataset depicts clones of mutant alleles shared between WTPDX and primary tumors (along slope y = x line), clones enriched or depleted in the xenografts (2× fold change lines depicted), and clones represented in the primary tumor or xenograft, but not both (clustered along x and y axes). b MAF and Fish plots show that KT-24 demonstrates maintenance of a major clone from the associated primary tumor (gray), expansion of a minor subclone from the primary tumor into a major clone in the xenograft (red), and the presence of a xenograft-specific subclone (orange). c KT-22 demonstrates maintenance of the major clone from the primary tumor (gray), with emergence of xenograft specific clones (red, orange, and yellow). d KT-21 demonstrates maintenance of the major clone from the primary tumor (gray), loss of clones from the primary tumor (red and orange), and emergence of xenograft-specific clones (yellow and green).
Fig. 5
Fig. 5. WTPDX enrich for blastemal gene expression.
a Transcriptomic analysis of RNA-seq data using a Spearman correlation matrix demonstrates highly correlated gene expression between paired WTPDX and primary tumors in most sample pairs. Sample pairs constituting the lowest quartile of Spearman correlation (r < 0.836, blue regions of matrix) were associated with neoadjuvant chemotherapy and blastemal poor primary tumors that often transitioned to blastemal-rich WTPDX (arrows). b Principal component analysis was performed for paired WTPDX (circles) and primary tumors (squares), normal kidney specimens (diamonds), and pooled fetal kidney RNA (triangles) using RNA-seq data. WTPDX clustered distinctly from primary tumors. PC1 explained 21.6% of variance among samples and was inversely correlated with expression of WT blastemal archetype and kidney development cap mesenchyme genes. This increased expression of blastemal genes in WTPDX corresponded to increased percent blastema detected on histologic analysis (heatmap display of percent blastema per specimen shown). PC2 explained 10.5% of variance among samples and was positively correlated with expression of WT epithelial and kidney epithelial genes. KT—xenografts, PT—primary tumor, NK—normal kidney, FK—pooled fetal kidney RNA.
Fig. 6
Fig. 6. Global methylation and chromosomal copy number analysis.
a Methylation retention status of the WTPDX–primary WT pairs ranged from 0.7248 to 0.9167 (median 0.8678). b Hierarchical clustering of primary tumors and xenografts according to global methylation status of the top 20,000 most variable CpG site probes in the dataset resulted in the clustering of 31 of 39 xenograft–primary tumor pairs immediately adjacent to each other (matched specimens shaded in black). c Boxplot representation (median with tails representing interquartile range) of the percentage of shared copy number status between primary tumors and xenografts. d Differential genome-wide chromosomal copy number status comparing primary tumors and xenografts. Each row represents a xenograft–primary tumor pair. Chromosome numbers are given across the top. Blue indicates chromosomal copy number loss in xenografts relative to primary tumors, and red indicates copy number gain. Some xenografts (bottom of graphic) had accumulation of copy number losses (blue) compared with paired primary tumors.
Fig. 7
Fig. 7. Treatment responses in anaplastic versus favorable-histology WTPDX.
The Children’s Oncology Group (COG) EE-4A regimen is modeled by the vincristine and actinomycin-D 2-drug combination treatment, and the COG DD-4A regimen is modeled by the vincristine, actinomycin-D, and doxorubicin 3-drug combination treatment. RTV—median relative tumor volume (cm3).

Similar articles

Cited by

References

    1. Davidoff AM. Wilms tumor. Adv. Pediatr. 2012;59:247–267. doi: 10.1016/j.yapd.2012.04.001. - DOI - PMC - PubMed
    1. Irtan S, Ehrlich PF, Pritchard-Jones K. Wilms tumor: “State-of-the-art” update, 2016. Semin. Pediatr. Surg. 2016;25:250–256. doi: 10.1053/j.sempedsurg.2016.09.003. - DOI - PubMed
    1. Ooms AH, et al. Significance of TP53 mutation in Wilms tumors with diffuse anaplasia: a report from the Children’s Oncology Group. Clin. Cancer Res. 2016;22:5582–5591. doi: 10.1158/1078-0432.CCR-16-0985. - DOI - PMC - PubMed
    1. Maschietto M, et al. TP53 mutational status is a potential marker for risk stratification in Wilms tumour with diffuse anaplasia. PLoS One. 2014;9:e109924. doi: 10.1371/journal.pone.0109924. - DOI - PMC - PubMed
    1. Bardeesy N, et al. Anaplastic Wilms’ tumour, a subtype displaying poor prognosis, harbours p53 gene mutations. Nat. Genet. 1994;7:91–97. doi: 10.1038/ng0594-91. - DOI - PubMed

Publication types