. 2019 Dec 20;10(1):5816.
doi: 10.1038/s41467-019-13812-z.

Dual microglia effects on blood brain barrier permeability induced by systemic inflammation

Affiliations

Dual microglia effects on blood brain barrier permeability induced by systemic inflammation

Koichiro Haruwaka et al. Nat Commun. .

Abstract

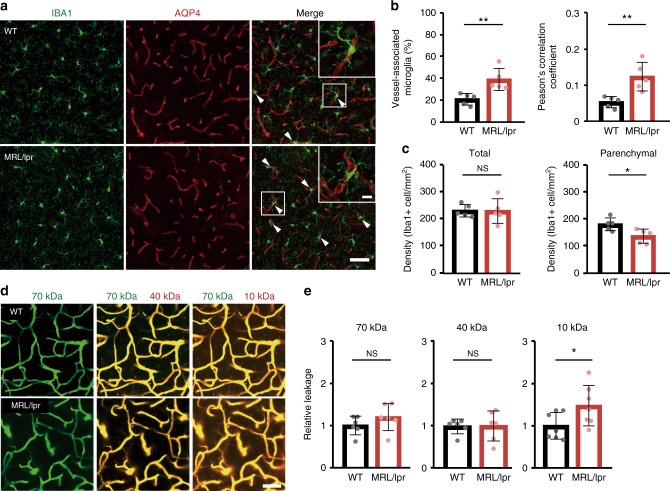
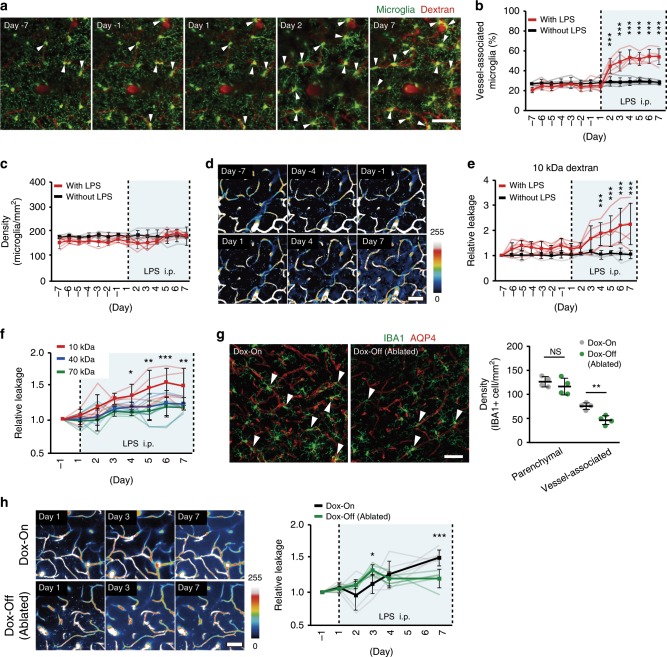
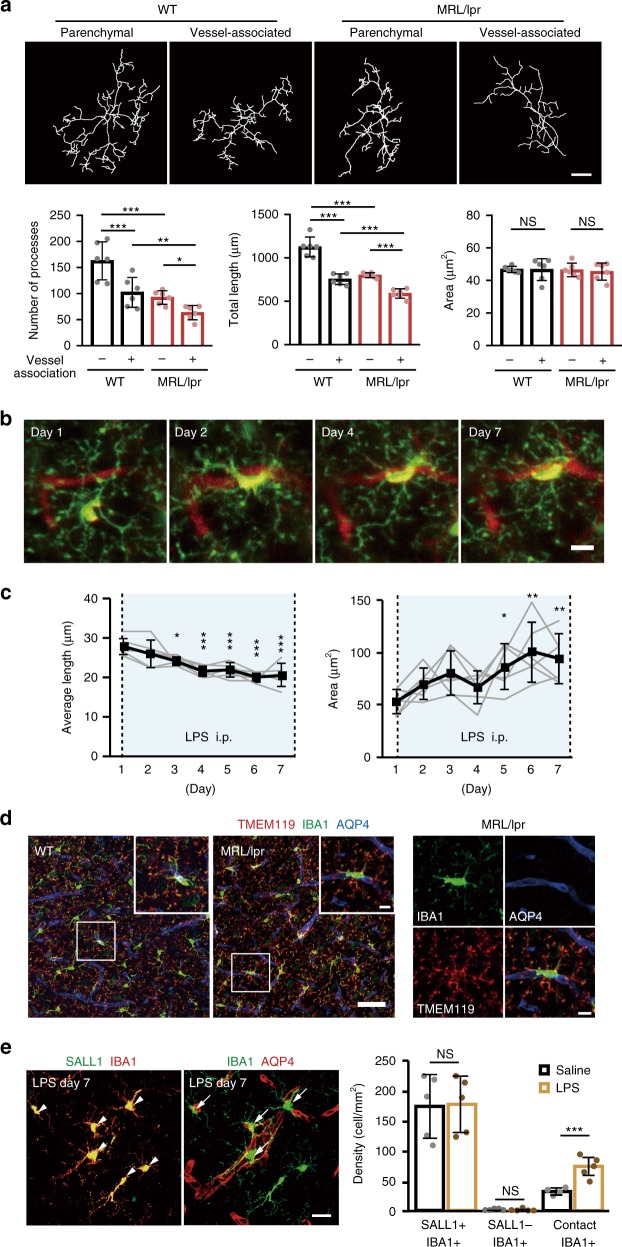
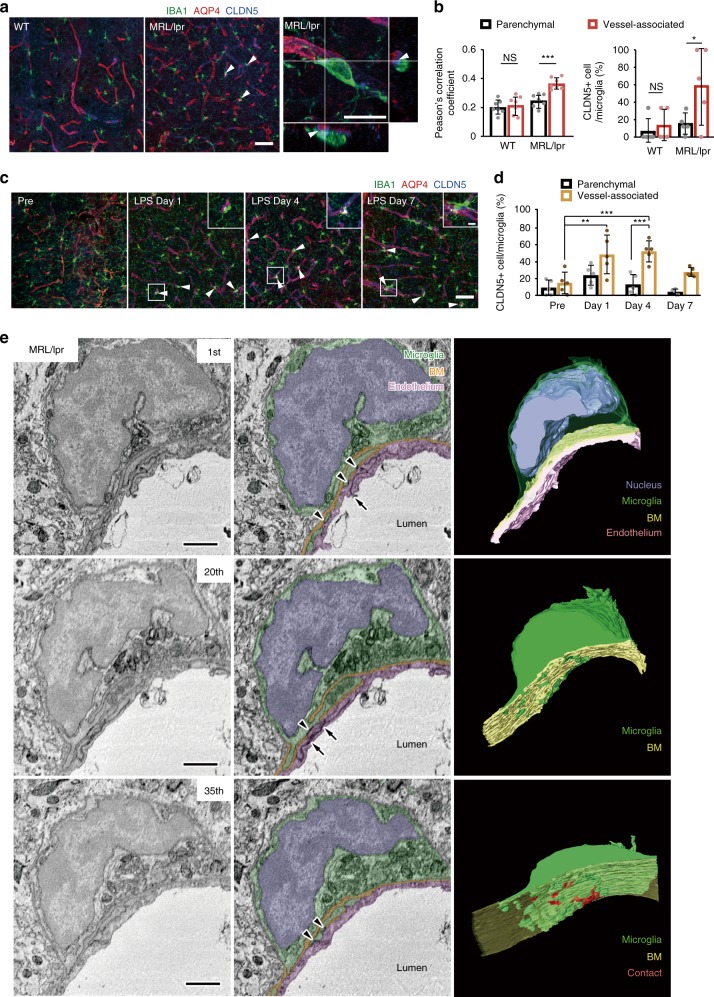
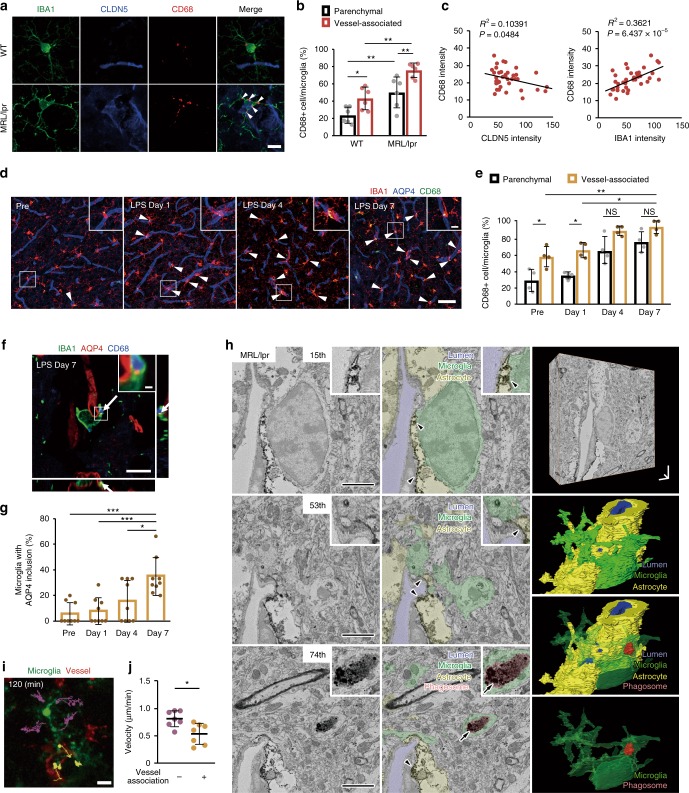
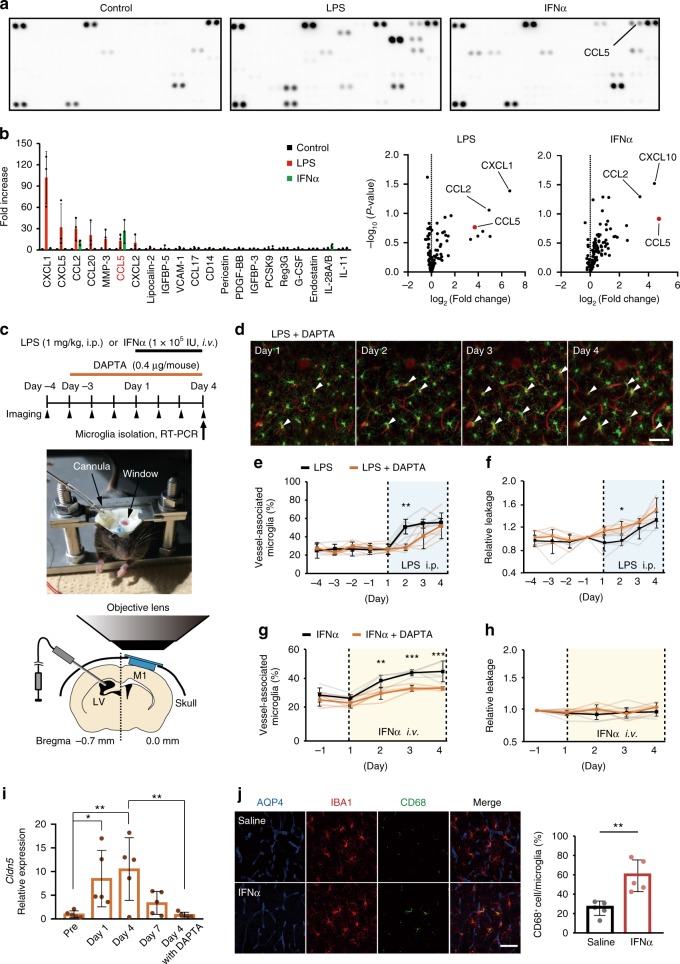
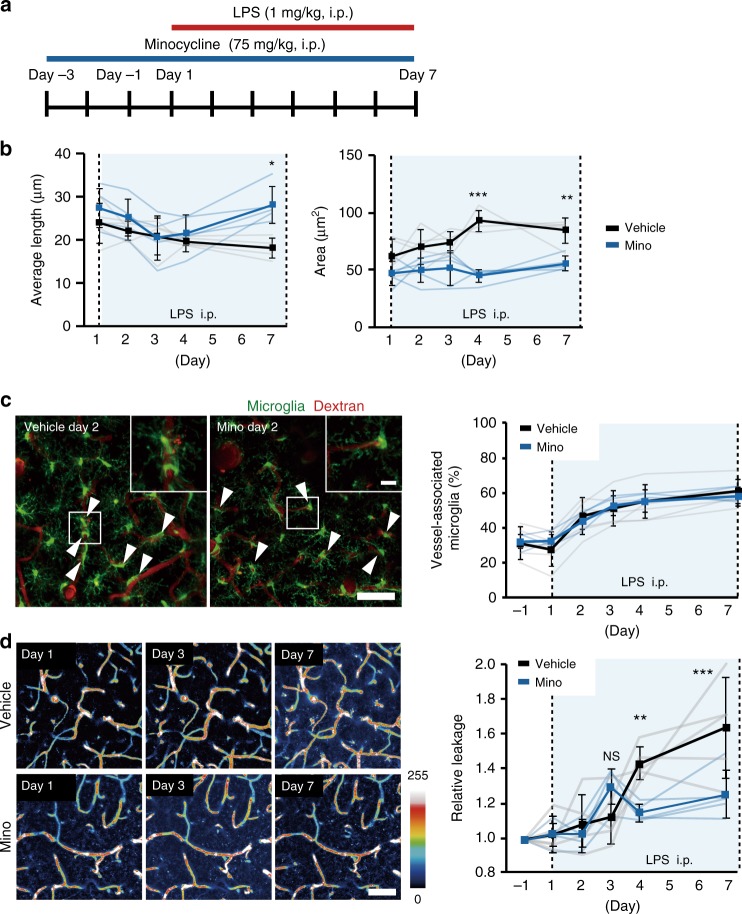
Microglia survey brain parenchyma, responding to injury and infections. Microglia also respond to systemic disease, but the role of blood-brain barrier (BBB) integrity in this process remains unclear. Using simultaneous in vivo imaging, we demonstrated that systemic inflammation induces CCR5-dependent migration of brain resident microglia to the cerebral vasculature. Vessel-associated microglia initially maintain BBB integrity via expression of the tight-junction protein Claudin-5 and make physical contact with endothelial cells. During sustained inflammation, microglia phagocytose astrocytic end-feet and impair BBB function. Our results show microglia play a dual role in maintaining BBB integrity with implications for elucidating how systemic immune-activation impacts neural functions.


Conflict of interest statement

The authors declare no competing interests.

Figures

Fig. 1
Fig. 1. Systemic inflammation is associated with a leaky BBB and a close association between microglia and cerebral blood vessels.
a Fluorescent images of IBA1 (microglia, green) and AQP4 (astrocyte end-feet marker, red) in WT mice and in mice with chronic systemic inflammation (MRL/lpr mice). Upper right boxes in right panels show magnified images of a typical blood vessel with associated microglia. Scale bar, 50 and 10 μm for magnified image. Arrowheads indicate a contact between microglia and blood vessels. b The proportion of microglia in contact with blood vessels and the extent of overlap of IBA1 and AQP4 fluorescence as quantified by a Pearson’s correlation coefficient were both higher in MRL/lpr mice than in WT mice. c The density of parenchymal microglia (right panel) is decreased in MRL/lpr mice, whereas the total density of microglia in the whole field of view (left panel) is the same in WT and MRL/lpr mice. d, e BBB permeability was quantified from the leaking of different molecular size (10, 40, 70 kDa) dextran-conjugated fluorophores into the parenchymal space outside the vessels, with each dextran fluorescing at a different color (and pseudo-colored here as green or red). Vessels were identified by the impermeant 70 kDa fluorophore (green), while leak identified by leakage (red) of fluorescence outside the co-labeled (yellow) vessels. Representative images (left) indicate that blood vessels in WT mice were impermeant to all these fluorophores and only the blood vessels themselves fluoresce (upper panels). Vessels in MRL/lpr mice are permeant to the 10 kDa dextran, which is visible in the parenchymal space adjacent to, and outside, the vessels (lower panels). Relative leakage is quantified by comparing mean parenchymal fluorescence intensity in MRL/lpr mice with that in WT mice (normalized to 1.0). In MRL/lpr mice, vessels leak only the smaller 10 kDa dextran. Scale bars in d, 50 μm. Graphs show data from an individual animal (b, c, e), overlaid with mean ± SD. NS not significant. *P < 0.05 and **P < 0.01.
Fig. 2
Fig. 2. The temporal relationship between microglia-vessel migration and BBB permeability during systemic inflammation.
a Image series from a single mouse demonstrate the time course of microglia migration to cerebral vessels during the development of systemic inflammation induced by daily LPS injections. b Effects of daily LPS injections on the proportion of microglia in contact with cerebral vessels. Graphs show data from control (without LPS) and LPS (with LPS) experiments. Blue shadow indicates LPS injections (i.p.). c Effects of LPS on the total number of microglia in each image field on each day. LPS had no significant effect on total microglial density. d A series of typical images from a single mouse demonstrates the time course of changes in BBB permeability after systemic LPS injection. e Effects of daily LPS injections or control on dextran leakage from blood vessels. The relative leakage of 10 kDa dextran was significantly increased from 4 to 7 days after LPS injection. f Quantification of the size selectivity of BBB permeability after systemic LPS injection using different molecular size dextrans. g Typical images (left panels) and mean data (right panel) show the effects of partial microglia ablation (Dox-Off) on the density of microglia in the brain parenchyma and associated with vessels. The density of vessel-associated microglia was significantly decreased in Dox-Off mice as compared with Dox-On mice. h A series of typical images from a single Dox-On (upper panels) and Dox-Off (lower panels) mouse illustrate the effects of microglia ablation on BBB permeability during systemic inflammation induced by daily LPS injection. Time course of BBB permeability changes during LPS injections Dox-Off and Dox-On mice. Microglia ablation induced a significant increase in BBB permeability during the early phase of systemic inflammation (Day 3) and a significant reduction in the later phase. In all line graphs, light lines indicate data from an individual animal (b, c, e, f, h), while the dark lines and error bars show mean ± SD. NS not significant. *P < 0.05, **P < 0.01 and *** P < 0.001. Scale bars in all panels: 50 μm.
Fig. 3
Fig. 3. Changes in microglia morphology and dynamics during systemic inflammation.
a Different properties of microglia process in vessel-associated and parenchymal microglia in MRL/lpr mice. Upper panels show topological skeletonized images of microglia from WT (left) and MRL/lpr mice (right) in parenchyma or associated with vessels. Microglia were visualized by IBA1 immunostaining and the processes were traced by ImageJ. Scale bar, 10 μm. Bottom panels quantify the number of process (left panel) and the mean cumulative length (center panel) of microglia processes in each mouse and the mean area of the cell soma. b A series of typical images from a mouse during LPS injections showed microglial (green) migration to a vessel (red) and the associated changes in microglia morphology. Scale bar, 10 μm. c Quantitative analysis of the mean length of microglial processes (left panel) and the mean microglial soma area (right panel) during 7 days of LPS injections. d Typical images of microglia stained positive for both IBA1 and TMEM119 in WT (left) and in MRL/lpr (middle) mice. Boxes at the top right show magnified images of the region indicated in the main panel. The right-hand panel shows the individual fluorescent channels (and merged channel) for the magnified image from the MRL/lpr mouse. e Typical images of microglia positive for both IBA1 and SALL1 (left) or IBA1 and AQP4 (right) after 7 days of LPS injections to quantify the progeny of vessel-associated microglia. The right panel shows mean data for the density of cells identified by IBA1 or SALL1. The total number of resident brain microglia counts (SALL1+’ve) or infiltrating macrophages/microglia (SALL1−’ve, IBA1+’ve) were not altered by LPS, while the number of resident microglia associated with vessels (contact IBA1+’ve, colocalized with AQP4) was increased by LPS. Scale bar, 20 μm. In all graphs, each point indicates data from an individual animal (a, c, e), while columns and error bars show mean ± SD. NS not significant. *P < 0.05, **P < 0.01, and ***P < 0.001.
Fig. 4
Fig. 4. Biochemical and structural characterization of microglia associated with BBB protection during early systemic inflammation.
a Typical immunohistochemical images show colocalization of immunofluorescence for IBA1 (green), the tight-junction marker Claudin-5 (CLDN5, blue), and the astrocytic end-feet marker aquaporin-4 (AQP4, red) in WT and in MRL/lpr mice, with magnified images at the different fluorescent channels shown adjacent. Arrowheads indicate vessel-associated microglia expressing CLDN5 around its perimeter (expanded in the right-most panel) while the arrowhead shows a CLDN5 in microglia. The right-most panel shows an orthogonal view of a microglia (green) associated with astrocytic end-feet (red) expressing CLDN5 (blue) in the contacting microglia. Scale bar, 50 μm, or 10 μm (insets). b The proportion of microglia that are positive for CLDN5 among vessel-associated microglia was higher in MRL/lpr mice. c A series of immunohistochemistry images show the effects of LPS on the colocalization of IBA1, AQP4, and CLDN5. Arrowheads indicate microglia showing colocalization with CLDN5. Scale bar, 50 or 10 μm (inset). d Graph showing the proportion of parenchymal (black) and vessel-associated microglia (ocher) that express CLDN5 on different days during the progression of systemic inflammation induced by daily LPS from Day 1. e Representative CLDN5 immuno-electron microscopic images of a blood vessel in an MRL/lpr mouse and the surrounding neurovascular unit. Left column shows raw images, center column shows identified components, and the right column shows 3D reconstruction, of the 1st, 20th, and 35th serial sections. A microglial cell (green) surrounding the surface of the basement membrane (BM, orange-yellow) has small processes that infiltrate the BM to form immunoreactive contacts (arrowheads) with endothelial cells (pink), which resemble the immune-reactive contact between endothelial cells(arrows, tight junctions). The 3D reconstruction illustrates protrusions through the BM (center) and the endothelial cell contacts (lower panel, red). Scale bars: 1 μm. In all graphs, each point indicates data from an individual animal (b, d), while columns and error bars show mean ± SD. NS not significant. *P < 0.05, **P < 0.01, and ***P < 0.001.
Fig. 5
Fig. 5. Characterization of phagocytic microglia during late systemic inflammation.
a Typical immunohistochemistry images showing colocalization of IBA1, CLDN5, and CD68 immunofluorescence. Arrowheads in the merged image indicates CD68+’ve puncta in microglia. b Quantification of the proportion of parenchymal and vessel-associated microglia that express CD68 was significantly increased in MRL/lpr mice and in MRL/lpr vessel-associated microglia. c Correlations between the expression intensities of CLDN5 and CD68 (left), and IBA1 and CD68 (right), for vessel-associated microglia in MRL/lpr mice. d A series of immunohistochemistry images showing the effects of LPS on the colocalization of IBA1, AQP4, and CD68. Arrowheads indicate microglia with triple colocalization for these markers. Scale bar, 50 μm. e Graph shows the proportion of parenchymal and vessel-associated microglia that express CD68 with systemic inflammation. f Orthogonal view of a microglia associated with astrocytic end-feet (AQP4) showing AQP4 and CD68 double-positive vesicles in a contact microglia (as indicated by arrow) suggesting phagocytosis of astrocyte end-feet components. Scale bar, 3 μm (inset). g Plots show the proportion of vessel-associated microglia in which such AQP4 puncta were observed with systemic inflammation. h Sample AQP4 immuno-electron microscopic images of neurovascular unit in an MRL/lpr mouse. Left column shows raw images (insets show magnified immunopositive segments), and the center column shows identified components while the right column shows 3D reconstruction. A microglial cell is shown directly adjacent to the surface of the capillary (lumen), which is surrounded by astrocyte end-feet (arrowheads). The lower panel shows an immunopositive microglial phagosome (red, arrow), demonstrating astrocyte fragments as microglial inclusions. Scale bars: 2 μm. i Typical images to quantify the effects of vessel contact on microglial process motility. Yellow and purple dots and line trajectories indicate the process movements in two different microglia. j The graph shows the microglial process motility. In all graphs, each point indicates averaged data from an individual animal (b, c, e, g, j), while columns and error bars show mean ± SD. NS not significant. *P < 0.05, **P < 0.01 and ***P < 0.001. Scale bar in a; d, inset; f; i are 10 μm.
Fig. 6
Fig. 6. Signaling pathways mediating microglia migration to vessels and subsequent BBB integrity regulation.
a Sample cytokine array data from control cultured endothelial cells, and cultured endothelial cells treated with LPS or IFNα. Each column represents immunoblots for 111 different cytokines. b The top 21 cytokines that changed with the presence of LPS or IFNα compared to control cells. CCL5 increased with both treatments. c Schematic experimental paradigm and photos and schematics showing the intraventricular DAPTA injection protocol that accompanied the daily in vivo imaging and intraperitoneal LPS injection paradigm. d Typical in vivo images of microglia migration to vessels at different stages of LPS injection protocol in a mouse treated with intraventricular DAPTA injection. e, f Plot of the proportion of microglia in contact with cerebral vessels (e) and relative change in BBB permeability (f), LPS injection protocol (indicated by blue shading) in a mouse treated with the CCR5 antagonist, DAPTA, and compared to the mean values for control mice (LPS only, dashed lines). DAPTA delayed microglia migration and caused earlier loss of BBB integrity. g, h As in e, f, the effects of DAPTA on the proportions of vessel-associated microglia (g) and leaks across the BBB (h) in response to intravenous injection of IFNα. DAPTA reduced vessel migration, although no effect was observed on BBB permeability. i The effect of LPS injections on microglial CLDN5 mRNA expression levels after daily injections of LPS compared with the presence of DAPTA. DAPTA treatment significantly suppressed CLDN5 expression in microglia. j Typical immunohistochemistry of CD68 and colocalization with vessels (AQP4) and microglia after intraparenchymal saline or IFNα injection. The right panel graph quantifies the proportion of microglia colocalized with CD68, showing microglial CD68 increased significantly after intraventricular IFNα injection. Each point in graphs (i, j), and the faint lines in graph (e, f, g, h), indicate data from a single field, while the columns (i, j) or dark lines (e, f, g, h), and error bars show mean ± SD. NS not significant. *P < 0.05, **P < 0.01, and *** P < 0.001. Scale bars in all panels: 50 μm.
Fig. 7
Fig. 7. Inhibition of microglial activation improves BBB integrity during the later phase of systemic inflammation.
a Schematic diagram of the experimental protocol. Minocycline (Mino) (or vehicle) was injected 3 days before LPS injections. From Day 1, LPS and Mino (or vehicle) was co-injected daily for 7 days. Imaging was performed before (Day −1) and on days 1, 2, 3, 4, and 7 days after LPS injections. b Graph plotting the effects of LPS on the mean length of microglial processes and on the mean area of microglia cell soma in vehicle and Mino-treated mice. c Typical in vivo two-photon images (left) and mean data (right) showed the effects on LPS on the proportion of microglia-associated with vessels. Mino did not affect the migration and accumulation of microglia at vessels. Scale bar, 50 or 10 μm (inset). d (Left) A series of typical in vivo two-photon images from a single vehicle- (upper) or Mino- (lower) treated mouse demonstrated the changes in BBB permeability at different days after systemic LPS injection, measured by leakage of 10 kDa dextran from vessels. Scale bar, 50 μm. (right) Plot of the effects of daily LPS injections on the dextran leakage from vessels. The relative leakage of 10 kDa dextran was significantly increased at 7 days after LPS injection in vehicle mice compared to Mino-treated mice. In each graph the faint lines indicate data from an individual animal (b, c, d) while the dark lines and error bars indicate the mean ± SD. NS not significant. *P < 0.05, **P < 0.01, and ***P < 0.001.

References

    1. D’Mello C, Swain MG. Liver-brain interactions in inflammatory liver diseases: implications for fatigue and mood disorders. Brain. Behav. Immun. 2014;35:9–20. doi: 10.1016/j.bbi.2013.10.009. - DOI - PubMed
    1. Yirmiya R, Goshen I. Immune modulation of learning, memory, neural plasticity and neurogenesis. Brain. Behav. Immun. 2011;25:181–213. doi: 10.1016/j.bbi.2010.10.015. - DOI - PubMed
    1. Annane D, Sharshar T. Cognitive decline after sepsis. Lancet Respir. Med. 2015;3:61–69. doi: 10.1016/S2213-2600(14)70246-2. - DOI - PubMed
    1. Dumitrescu AL. Depression and inflammatory periodontal disease considerations-an interdisciplinary approach. Front. Psychol. 2016;7:347. doi: 10.3389/fpsyg.2016.00347. - DOI - PMC - PubMed
    1. Barnes DE, Yaffe K. The projected effect of risk factor reduction on Alzheimer’s disease prevalence. Lancet Neurol. 2011;10:819–828. doi: 10.1016/S1474-4422(11)70072-2. - DOI - PMC - PubMed

Publication types

MeSH terms

LinkOut - more resources