

Metoprolol prevents neuronal dendrite remodeling in a canine model of chronic obstructive sleep apnea
- PMID: 31863057
- PMCID: PMC7470867
- DOI: 10.1038/s41401-019-0323-8
Metoprolol prevents neuronal dendrite remodeling in a canine model of chronic obstructive sleep apnea
Abstract
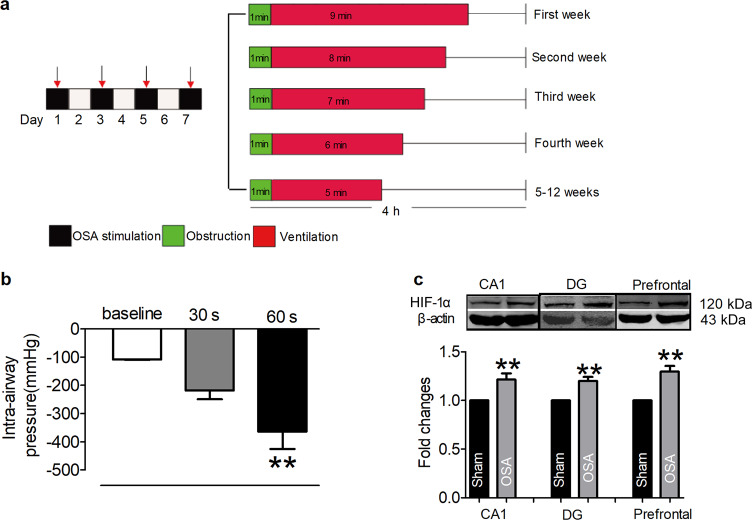
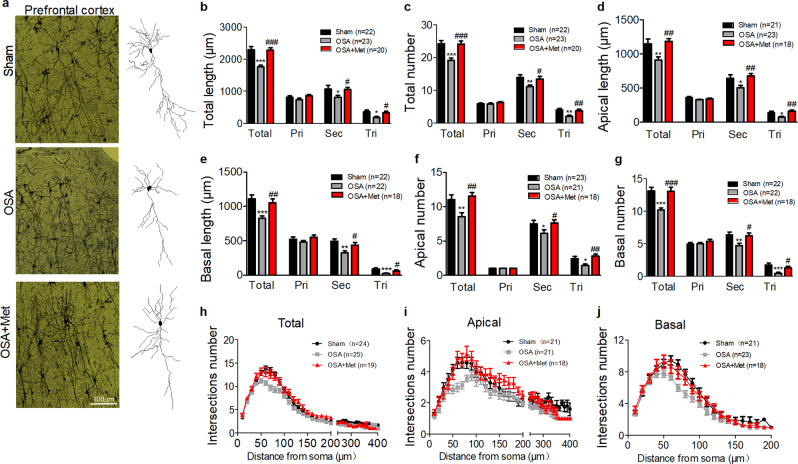
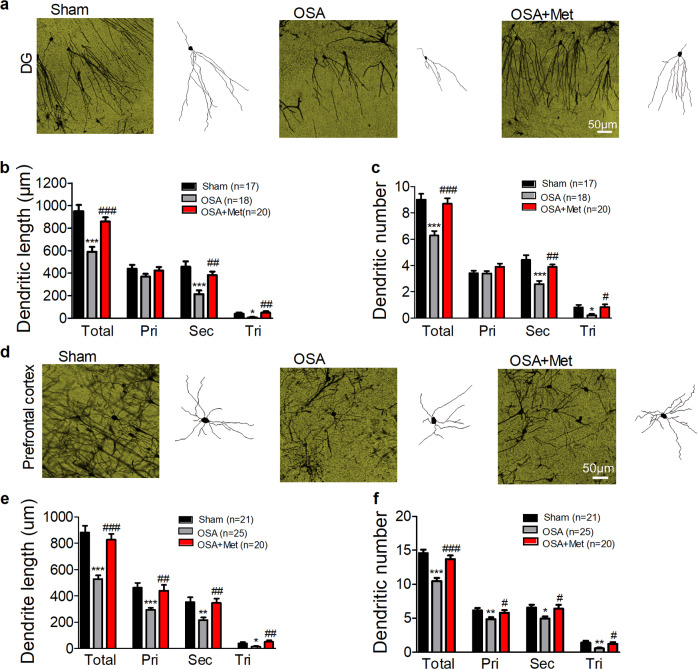
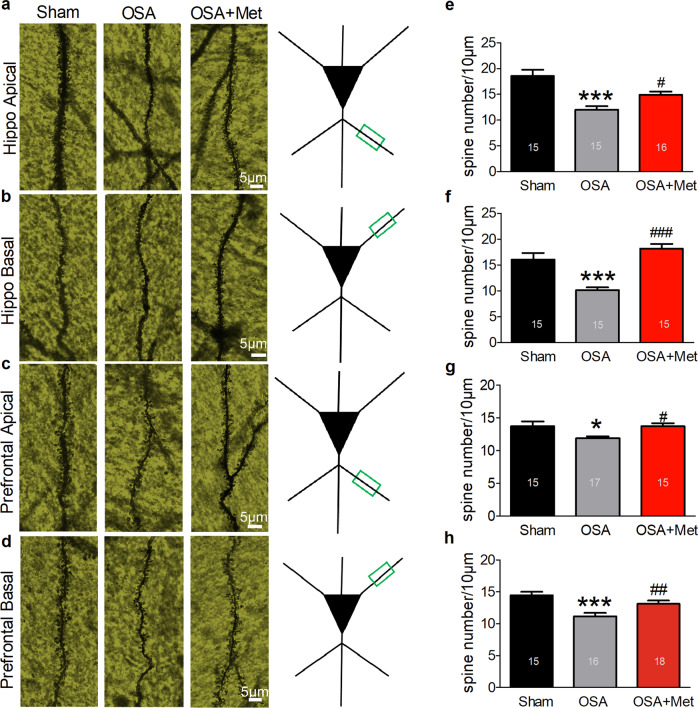
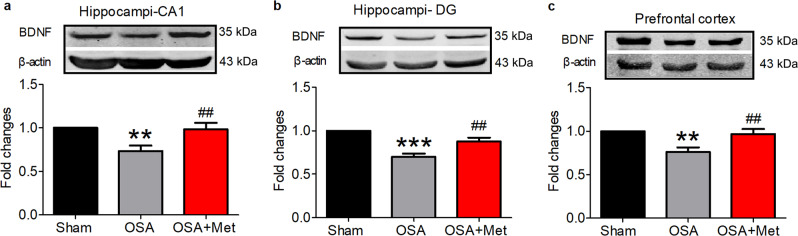
Obstructive sleep apnea (OSA) is closely associated with central nervous system diseases and could lead to autonomic nerve dysfunction, which is often seen in neurodegenerative diseases. Previous studies have shown that metoprolol prevents several chronic OSA-induced cardiovascular diseases through inhibiting autonomic nerve hyperactivity. It remains unclear whether chronic OSA can lead to dendritic remodeling in the brain, and whether metoprolol affects the dendritic remodeling. In this study we investigated the effect of metoprolol on dendrite morphology in a canine model of chronic OSA, which was established in beagles through clamping and reopening the endotracheal tube for 4 h every other day for 12 weeks. OSA beagles were administered metoprolol (5 mg· kg-1· d-1). The dendritic number, length, crossings and spine density of neurons in hippocampi and prefrontal cortices were assessed by Golgi staining. And the protein levels of hypoxia-inducible factor-1α (HIF-1α) and brain-derived neurotrophic factor (BDNF) were measured by Western blotting. We showed that chronic OSA successfully induced significant brain hypoxia evidenced by increased HIF-1α levels in CA1 region and dentate gyrus of hippocampi, as well as in prefrontal cortex. Furthermore, OSA led to markedly decreased dendrite number, length and intersections, spine loss as well as reduced BDNF levels. Administration of metoprolol effectively prevented the dendritic remodeling and spine loss induced by chronic OSA. In addition, administration of metoprolol reversed the decreased BDNF, which might be associated with the metoprolol-induced neuronal protection. In conclusion, metoprolol protects against neuronal dendritic remodeling in hippocampi and prefrontal cortices induced by chronic OSA in canine.
Keywords: BDNF; HIF-1α; canine model; chronic obstructive sleep apnea; hippocampus; metoprolol; neuronal dendritic remodeling; prefrontal cortex.
Conflict of interest statement
The authors declare no competing interests.
Figures

Similar articles
-
Neurotrophins in the Neuropathophysiology, Course, and Complications of Obstructive Sleep Apnea-A Narrative Review.Int J Mol Sci. 2023 Jan 17;24(3):1808. doi: 10.3390/ijms24031808. Int J Mol Sci. 2023. PMID: 36768132 Free PMC article. Review.
-
Metoprolol Inhibits Cardiac Apoptosis and Fibrosis in a Canine Model of Chronic Obstructive Sleep Apnea.Cell Physiol Biochem. 2015;36(3):1131-41. doi: 10.1159/000430284. Epub 2015 Jun 25. Cell Physiol Biochem. 2015. PMID: 26113294
-
Metoprolol Inhibits Profibrotic Remodeling of Epicardial Adipose Tissue in a Canine Model of Chronic Obstructive Sleep Apnea.J Am Heart Assoc. 2019 Feb 5;8(3):e011155. doi: 10.1161/JAHA.118.011155. J Am Heart Assoc. 2019. PMID: 30686096 Free PMC article.
-
Metoprolol prevents chronic obstructive sleep apnea-induced atrial fibrillation by inhibiting structural, sympathetic nervous and metabolic remodeling of the atria.Sci Rep. 2017 Nov 2;7(1):14941. doi: 10.1038/s41598-017-14960-2. Sci Rep. 2017. PMID: 29097705 Free PMC article.
-
HIF-1α as a Mediator of Insulin Resistance, T2DM, and Its Complications: Potential Links With Obstructive Sleep Apnea.Front Physiol. 2020 Sep 9;11:1035. doi: 10.3389/fphys.2020.01035. eCollection 2020. Front Physiol. 2020. PMID: 33013447 Free PMC article. Review.
Cited by
-
BDNF and proBDNF Serum Protein Levels in Obstructive Sleep Apnea Patients and Their Involvement in Insomnia and Depression Symptoms.J Clin Med. 2022 Nov 30;11(23):7135. doi: 10.3390/jcm11237135. J Clin Med. 2022. PMID: 36498709 Free PMC article.
-
Neurotrophins in the Neuropathophysiology, Course, and Complications of Obstructive Sleep Apnea-A Narrative Review.Int J Mol Sci. 2023 Jan 17;24(3):1808. doi: 10.3390/ijms24031808. Int J Mol Sci. 2023. PMID: 36768132 Free PMC article. Review.
-
The Complex Relationship between Neuromodulators, Circadian Rhythms, and Insomnia in Patients with Obstructive Sleep Apnea.Int J Mol Sci. 2024 Aug 2;25(15):8469. doi: 10.3390/ijms25158469. Int J Mol Sci. 2024. PMID: 39126038 Free PMC article.
-
Functional Connectivity Changes in the Insular Subregions of Patients with Obstructive Sleep Apnea after 6 Months of Continuous Positive Airway Pressure Treatment.Neural Plast. 2023 Feb 21;2023:5598047. doi: 10.1155/2023/5598047. eCollection 2023. Neural Plast. 2023. PMID: 36865671 Free PMC article.
-
Advances in animal models of obstructive sleep apnea.Front Med (Lausanne). 2023 Feb 7;10:988752. doi: 10.3389/fmed.2023.988752. eCollection 2023. Front Med (Lausanne). 2023. PMID: 36824607 Free PMC article. Review.
References
-
- Young T, Skatrud J, Peppard PE. Peppard PE. Risk factors for obstructive sleep apnea in adults. JAMA. 2004;291:2013–6. - PubMed
-
- Torres G, Sanchez-de-la-Torre M, Barbe F. Relationship between OSA and hypertension. Chest. 2015;148:824–32.. - PubMed
-
- Patel N, Donahue C, Shenoy A, Patel A, El-Sherif N. Obstructive sleep apnea and arrhythmia: a systemic review. Int J Cardiol. 2017;228:967–70.. - PubMed
MeSH terms
Substances
LinkOut - more resources
Full Text Sources
Miscellaneous
