. 2019 Dec 20;9(1):19537.
doi: 10.1038/s41598-019-55984-0.

Patterns of diverse gene functions in genomic neighborhoods predict gene function and phenotype

Affiliations

Patterns of diverse gene functions in genomic neighborhoods predict gene function and phenotype

Matej Mihelčić et al. Sci Rep. .

Abstract

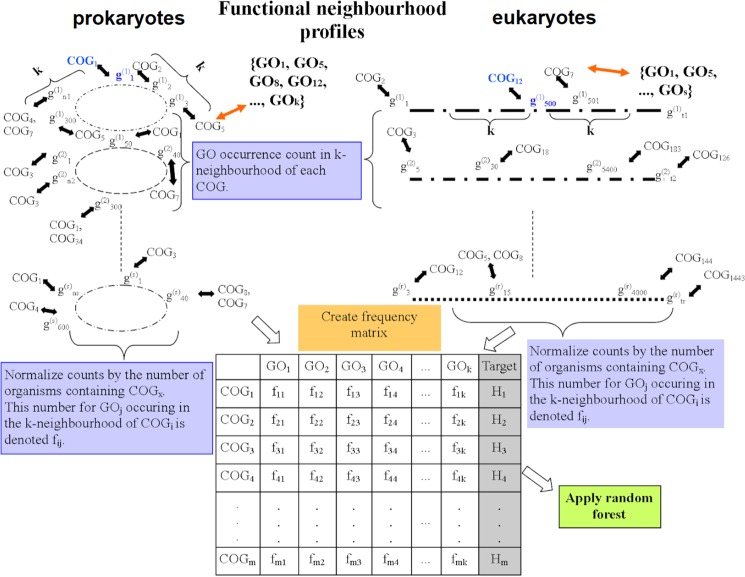
Genes with similar roles in the cell cluster on chromosomes, thus benefiting from coordinated regulation. This allows gene function to be inferred by transferring annotations from genomic neighbors, following the guilt-by-association principle. We performed a systematic search for co-occurrence of >1000 gene functions in genomic neighborhoods across 1669 prokaryotic, 49 fungal and 80 metazoan genomes, revealing prevalent patterns that cannot be explained by clustering of functionally similar genes. It is a very common occurrence that pairs of dissimilar gene functions - corresponding to semantically distant Gene Ontology terms - are significantly co-located on chromosomes. These neighborhood associations are often as conserved across genomes as the known associations between similar functions, suggesting selective benefits from clustering of certain diverse functions, which may conceivably play complementary roles in the cell. We propose a simple encoding of chromosomal gene order, the neighborhood function profiles (NFP), which draws on diverse gene clustering patterns to predict gene function and phenotype. NFPs yield a 26-46% increase in predictive power over state-of-the-art approaches that propagate function across neighborhoods, thus providing hundreds of novel, high-confidence gene function inferences per genome. Furthermore, we demonstrate that copy number-neutral structural variation that shapes gene function distribution across chromosomes can predict phenotype of individuals from their genome sequence.


Conflict of interest statement

The authors declare no competing interests.

Figures

Figure 1
Figure 1
Enrichment of diverse gene functions is widespread in genomic neighborhoods. (a) Distribution of neighborhood enrichment scores (log odds ratio, log OR) for all pairs of GO functions on original and randomized genomes of prokaryotes, fungi and metazoa. See also Supplementary 1, Figures S8, S11, S12 and Supplementary 1, Table S3. Pairs with OR = 0 are not shown on graphs (see Methods; these pairs result in artefactually high or low log OR values after continuity correction). Information about the statistical significance of difference in distribution shape between observed and randomized distribution is expressed by the Kolmogorov-Smirnov D statistic and the corresponding p-value. (b) Number of GO terms that are semantically distant, but significantly enriched in genomic neighborhoods (FDR ≤ 10%) of each GO term, summarized in histograms for prokaryotes, fungi and metazoa. GO term pairs with Resnik similarity <1 (for prokaryotes) and RS < 2 (for eukaryotes) from the ‘biological process’ GO sub-ontology are tallied in the figure.
Figure 2
Figure 2
Semantically distant GO terms can be as strongly enriched in gene neighborhoods as the semantically close GO terms. Four example GO terms of the ‘Biological process’ ontology are shown. Histograms show numbers of GO terms at a certain log odds ratio (log OR) of the enrichment in gene neighborhood (for prokaryotic genomes). The GO terms in neighborhoods of a central GO function are broken down into three groups: the “CLPar” group (the central function itself plus all its parent functions in the GO graph), “CLMed” group (functions with Resnik semantic similarity >2 with the central function) and “Dist” group (Resnik ≤2 with the central function). Instances of GO terms in the dissimilar “Dist” group and in the non-self “CLMed” group can be observed that have enrichments as high or higher than the self-enrichments (the “CLPar” functions, arrows on the plot).
Figure 3
Figure 3
The gene function profile of genomic neighborhoods enables a more accurate methodology to infer gene function. The distribution of area under the precision-recall curve (AUPRC) scores, measured in cross-validation, for all examined gene functions (GO terms) is represented in prokaryotes (top), fungi (middle) and metazoa (bottom). The methods compared are the nearest neighbor (NN) classifiers (1-NN, 3-NN, 10-NN), a network-based approach (Gaussian Field Label Propagation, GFP) and finally the novel Neighbourhood Function Profile (NFP) method. See Supplementary 1, Figures S17, S20 and S23 for the area under ROC curve (AUC) scores. P-values are from a one-tailed Wilcoxon signed-rank test.
Figure 4
Figure 4
Semantically distant functions in gene neighborhoods are important for accurate inference of gene function. Bars show accuracy (as AUPRC score, measured in crossvalidation) for predicting the eleven representative gene functions, using various types of neighborhood function profiles (NFP) that are listed in the legend. The “Full profile” are the full NFP of the ‘biological process’ GO graph, while the “CL/CLPar”, “Med/Par” and “Dist/Par” represent the partial NFP consisting only of close, medium-distance and distant functions, respectively (the “/Par” denotes that parent GO terms of the target functions were removed). The “CLPar” partial profiles contain only the selected function and its semantically close parents, meaning that “CLPar” is an implementation of the standard approaches that transfer functions across neighborhoods. In many cases, the close (but non-self), medium-distance and distant functions are more predictive than CLPar, and the complete profile is the most predictive. Serving as a control, the removal of the significantly enriched functions (labeled as “/Enr” in the legend) from the partial NFP strongly reduces accuracy, either for the close functions (CL), the medium-distance (Med) or the distant functions (Dist). Bars are average AUPRC scores of 200 runs of cross-validation of the Random Forest classifier, whereas error bars show standard deviation across the 200 runs.
Figure 5
Figure 5
Predicting phenotypes of individuals from the effects of structural variants on the composition of gene neighborhoods. (a) Distribution of predictive models’ AUC scores (top-left) and AUPRC scores (top-right) across 151 Escherichia coli phenotypes, estimated in crossvalidation. The baseline classifier predicts phenotype from the scores based on gene disruption by small variants. The PCA-NFP classifier predicts from neighborhood function profiles, which are a representation of how structural variants affect genomic neighborhoods. The Ensemble classifier is a combination of both sources of data (see Supplementary 1, Section S3.11). (b) The cross-validation receiver operating characteristic (ROC) curv of a baseline method based on small genetic variants and gene content (green) and the ensemble method (blue) that also includes copy number neutral structural variants, shown for two example phenotypes. Additional examples are in Supplementary 1, Fig. S43.
Figure 6
Figure 6
Overview of the neighborhood function profile (NFP) methodology to predict gene function. Location-based approaches are trained on pairwise COG/NOG distances of corresponding genes contained within genome of different prokaryotic and eukaryotic organisms. The obtained distances are used to create a similarity table to train the k-NN model and the association network to train the Gaussian Field Label Propagation approach. Functional neighbourhoods are used to create a normalized frequency matrix which is used to train the Random Forest of Predictive Clustering trees model. “COG” in the Figure is used to denote both COG and NOG. Target Hi denotes the sub-hierarchy of GO terms associated with COGi (sub-hierarchy contains information about the GO functions assigned to a COG and the parent-child relations between these GO functions).

Similar articles

Cited by

References

    1. Huynen M, Snel B, Lathe W, Bork P. Predicting Protein Function by Genomic Context: Quantitative Evaluation and Qualitative Inferences. Genome Research. 2000;10:1204–10. doi: 10.1101/gr.10.8.1204. - DOI - PMC - PubMed
    1. Overbeek R, Fonstein M, D’Souza M, Pusch GD, Maltsev N. The Use of Gene Clusters to Infer Functional Coupling. Proceedings of the National Academy of Sciences of the United States of America. 1999;96:2896–2901. doi: 10.1073/pnas.96.6.2896. - DOI - PMC - PubMed
    1. Wolf YI, Rogozin IB, Kondrashov AS, Koonin EV. Genome Alignment, Evolution of Prokaryotic Genome Organization, and Prediction of Gene Function Using Genomic Context. Genome Research. 2011;11:356–72. doi: 10.1101/gr.161901. - DOI - PubMed
    1. Ling X, He X, Xin D. Detecting Gene Clusters under Evolutionary Constraint in a Large Number of Genomes. Bioinformatics. 2009;25:571–77. doi: 10.1093/bioinformatics/btp027. - DOI - PubMed
    1. Yanai I, Mellor JC, De Lisi C. Identifying Functional Links between Genes Using Conserved Chromosomal Proximity. Trends in Genetics. 2002;18:176–79. doi: 10.1016/S0168-9525(01)02621-X. - DOI - PubMed

Publication types