

Identification of diagnostic metabolic signatures in clear cell renal cell carcinoma using mass spectrometry imaging
- PMID: 31863456
- PMCID: PMC8571954
- DOI: 10.1002/ijc.32843
Identification of diagnostic metabolic signatures in clear cell renal cell carcinoma using mass spectrometry imaging
Abstract
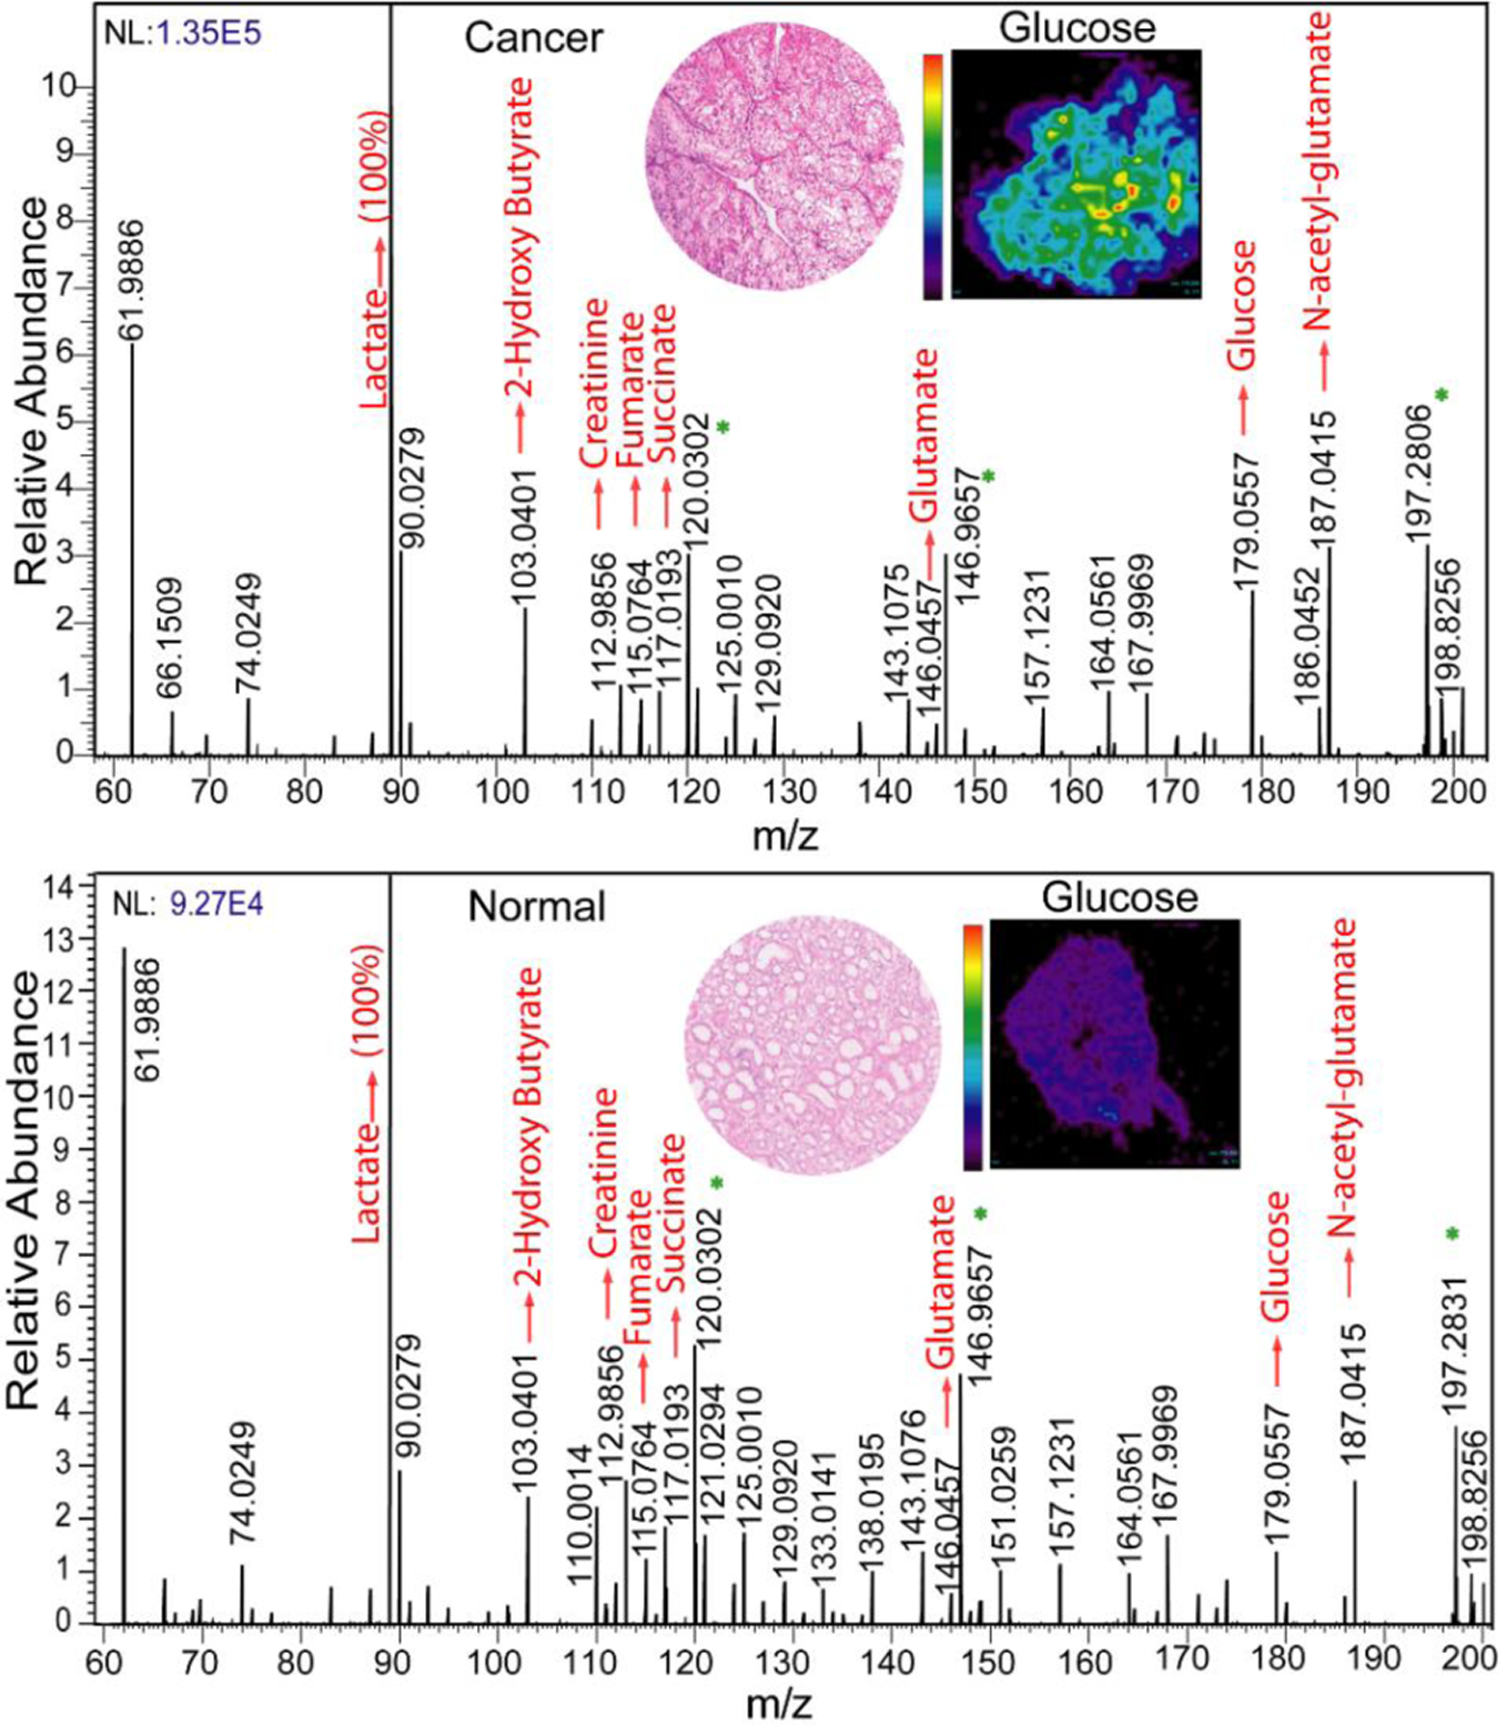
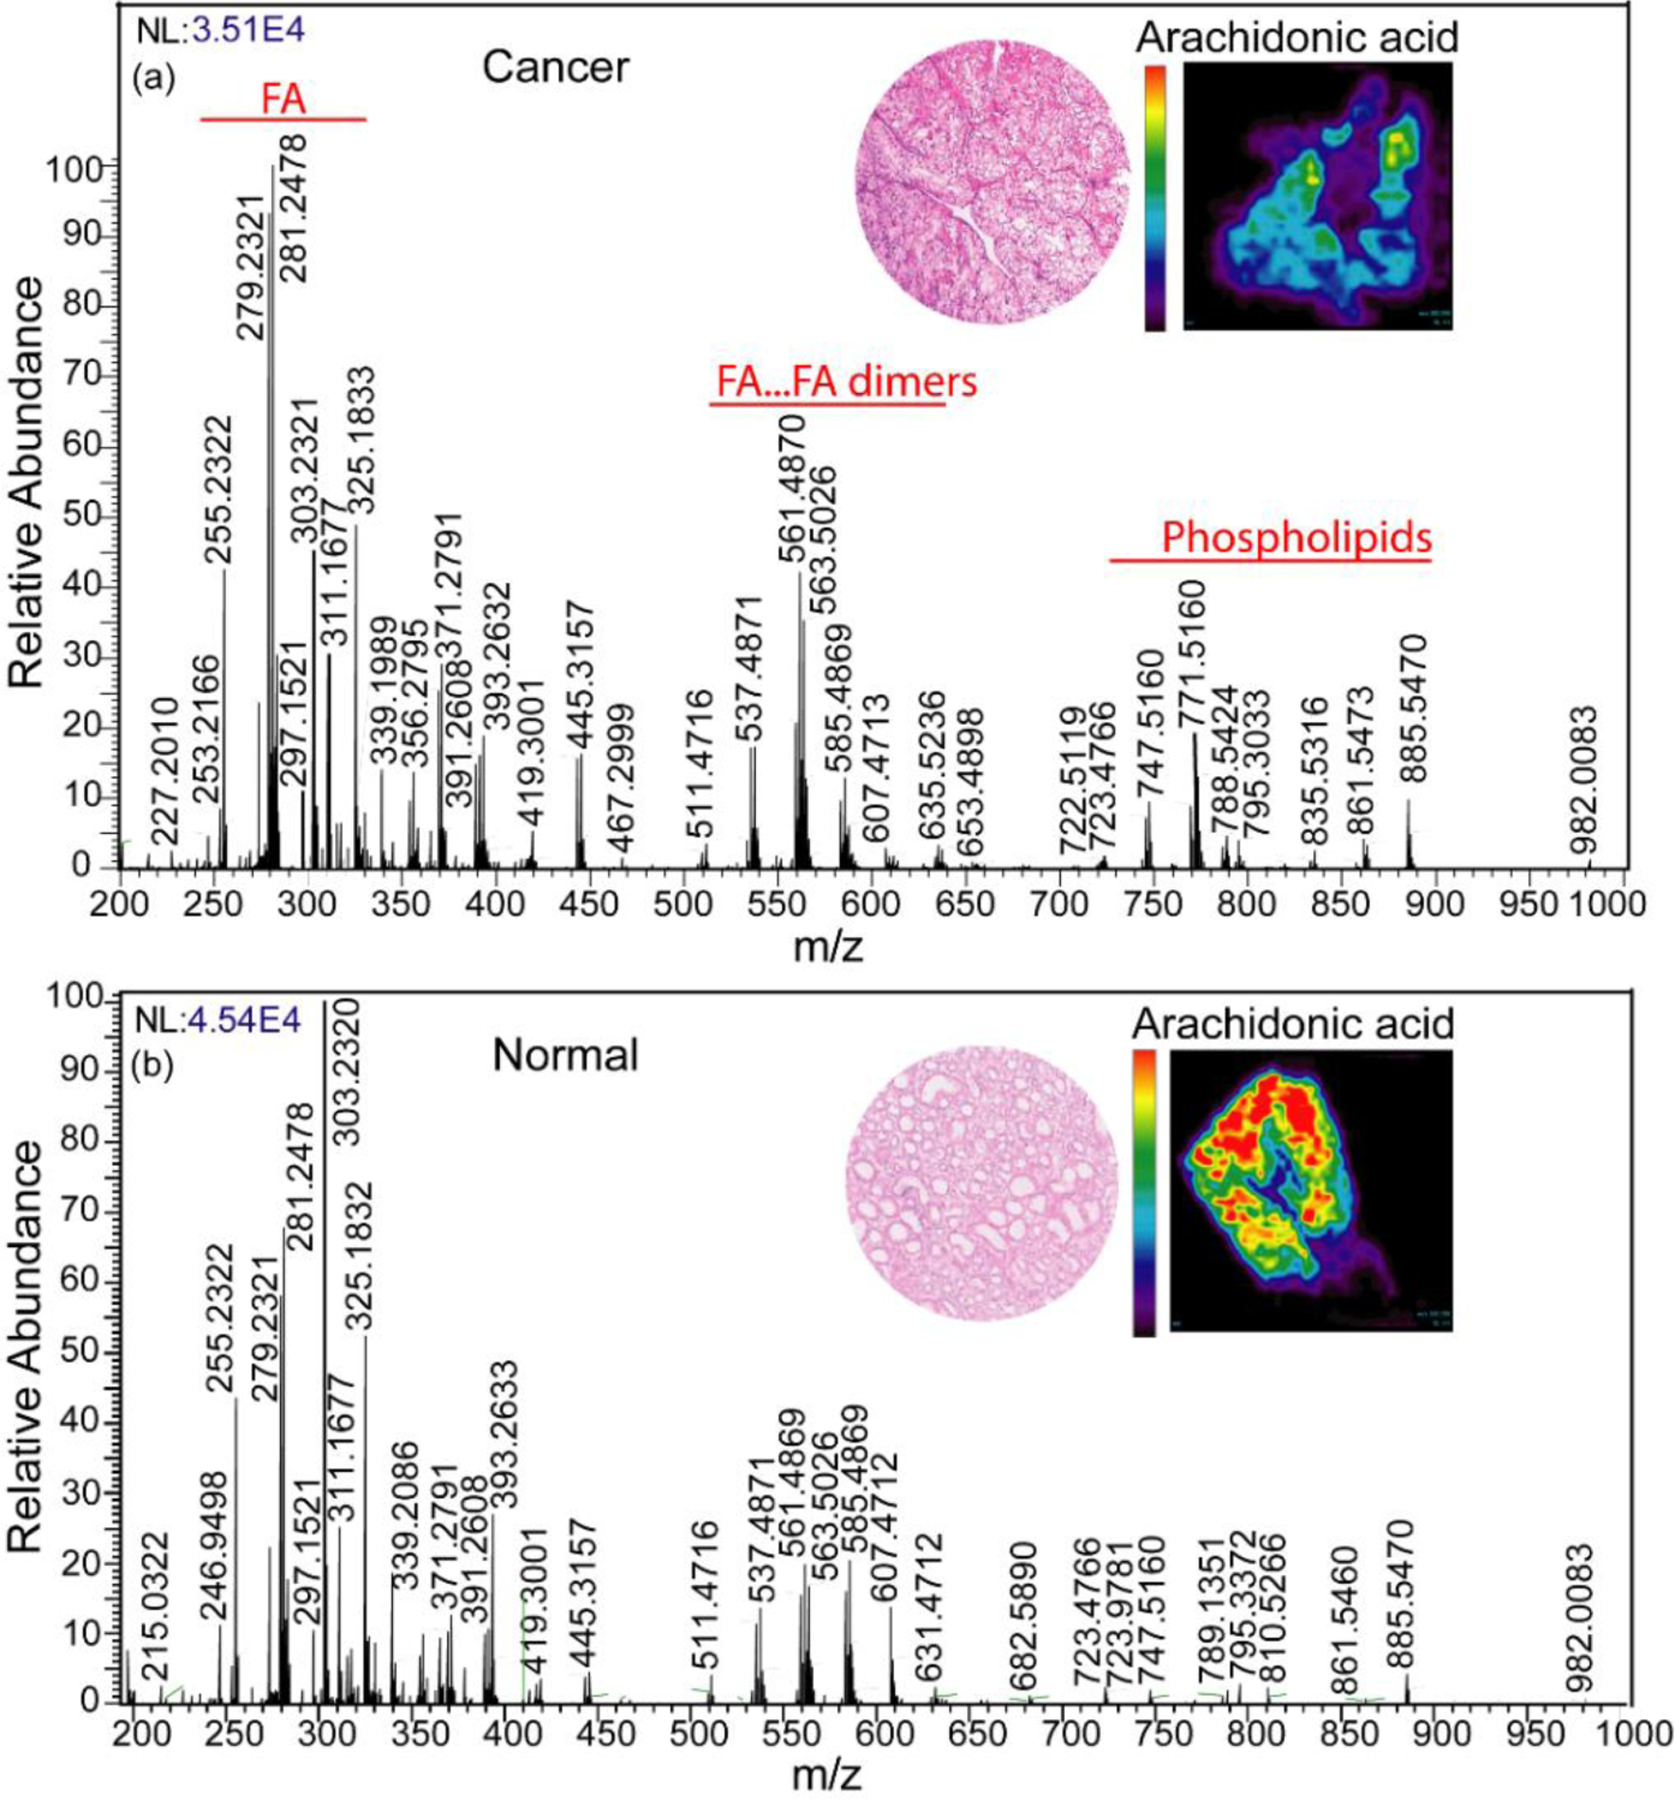
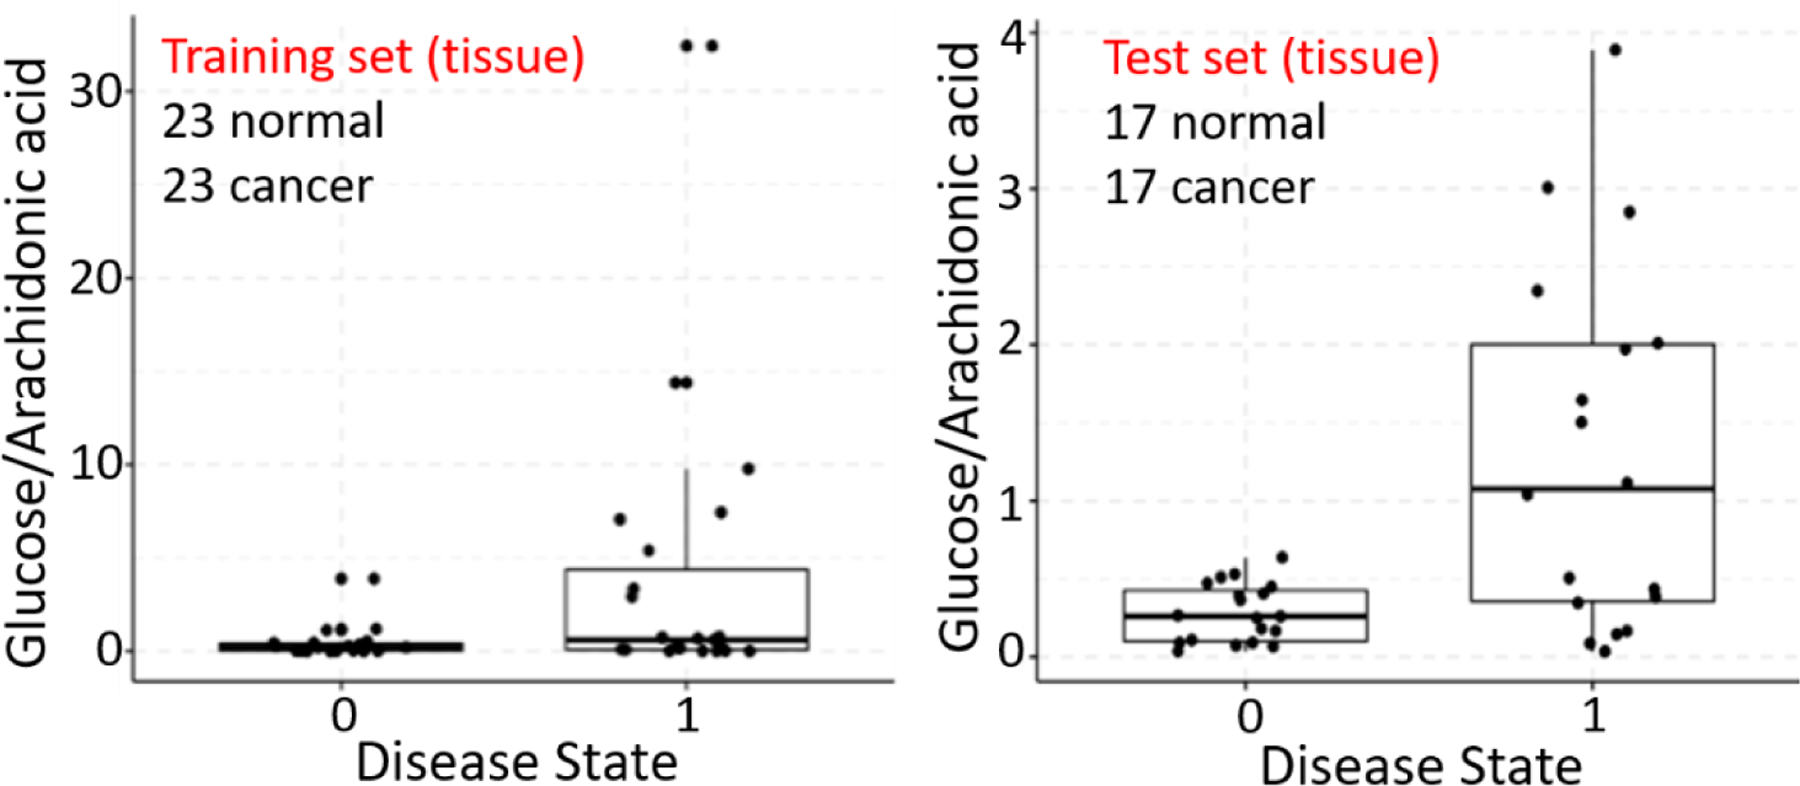
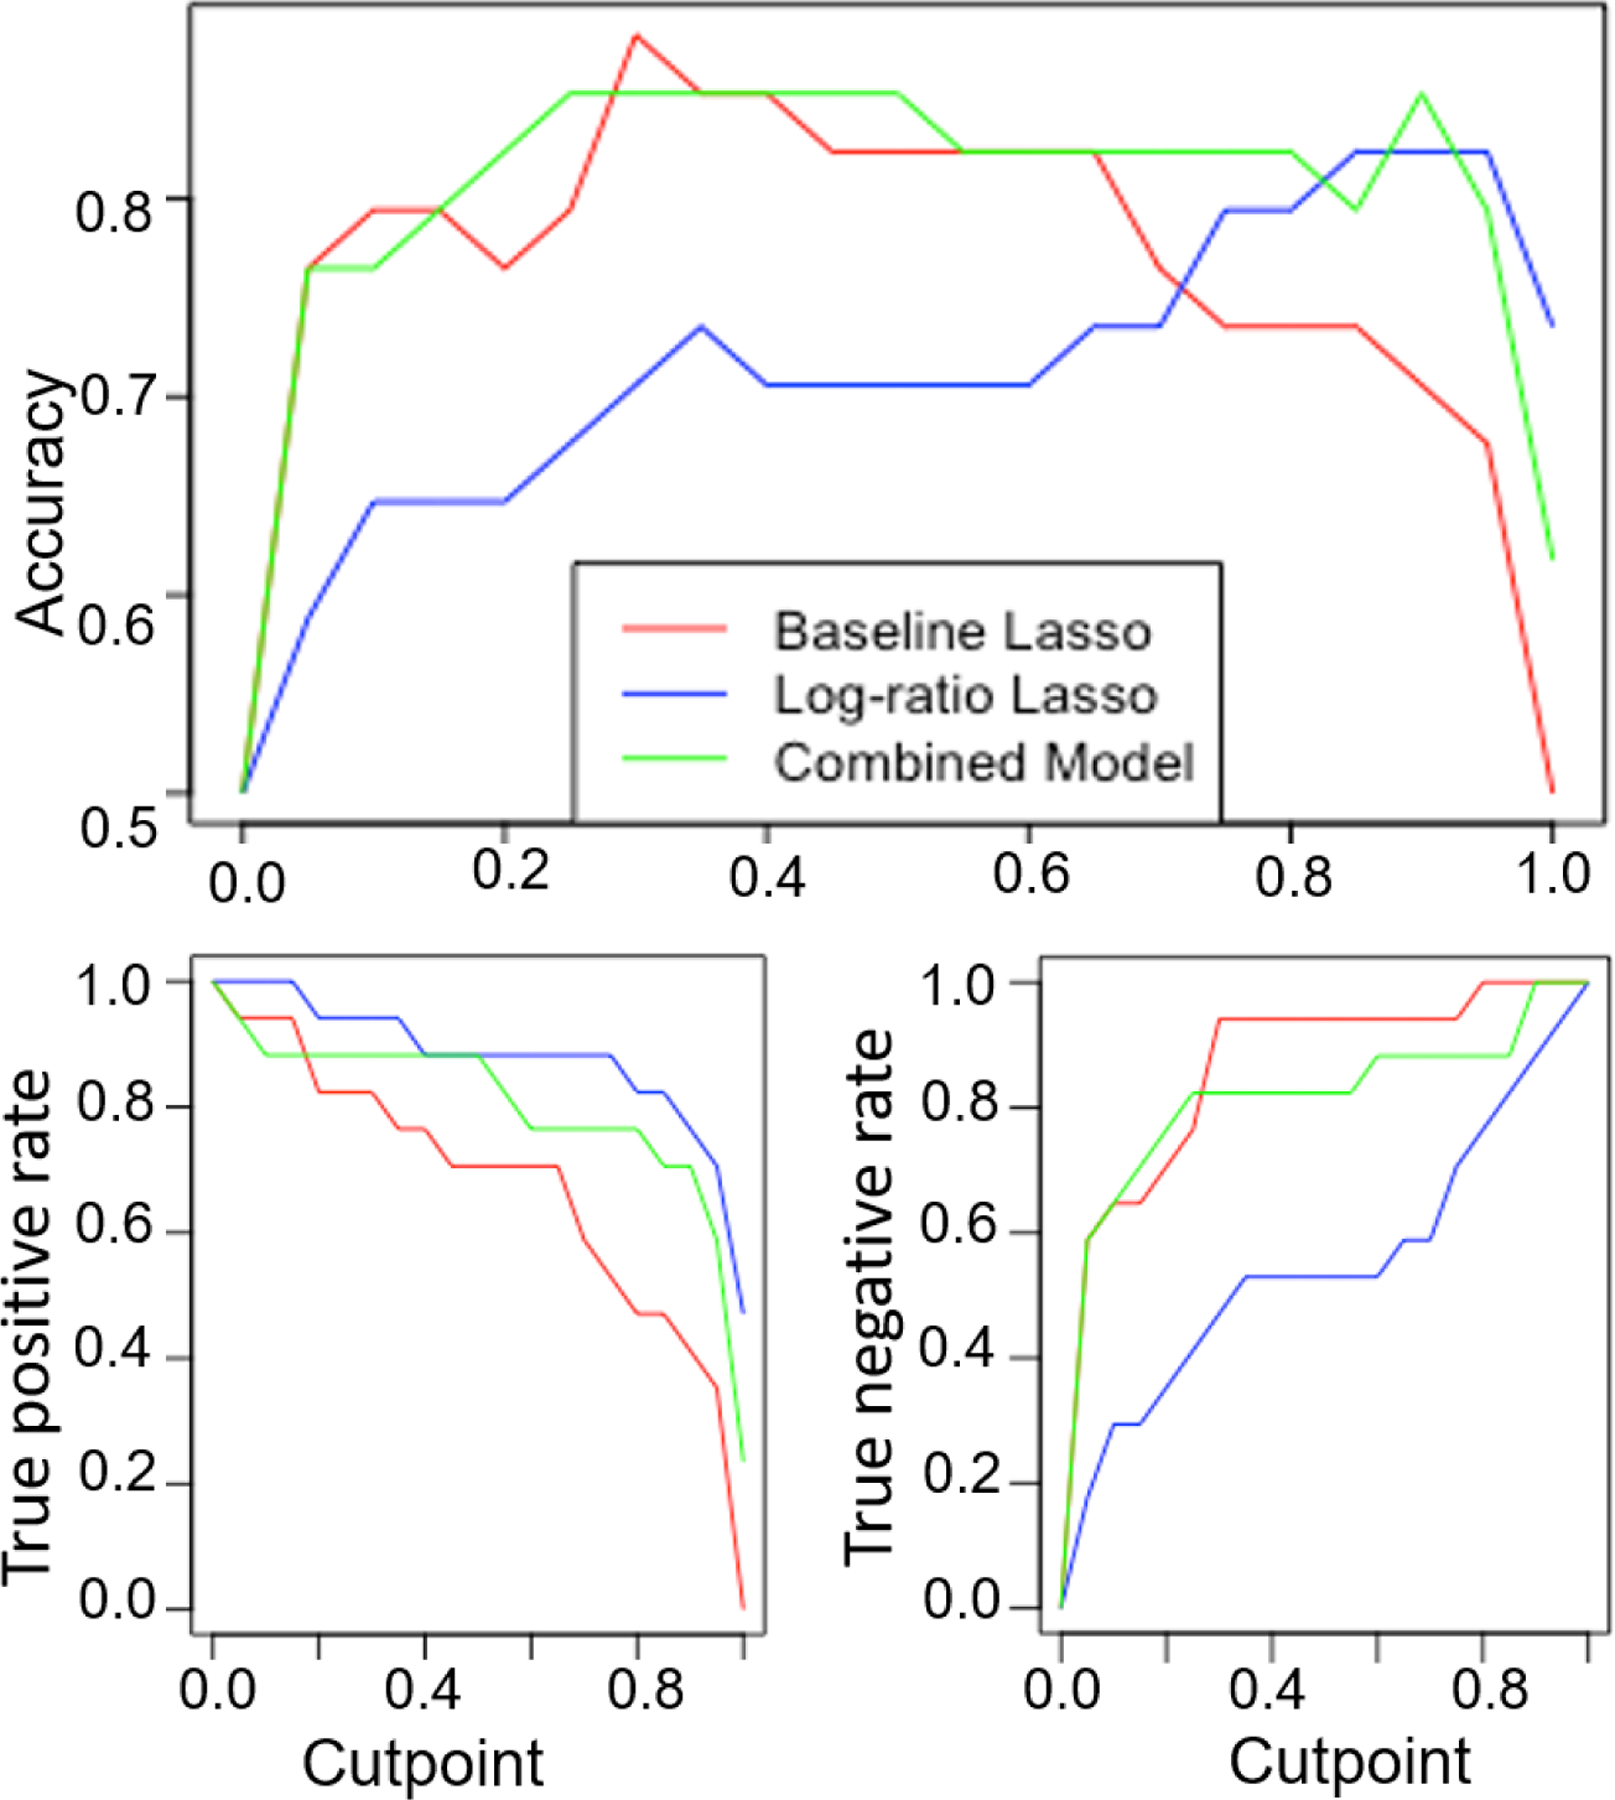
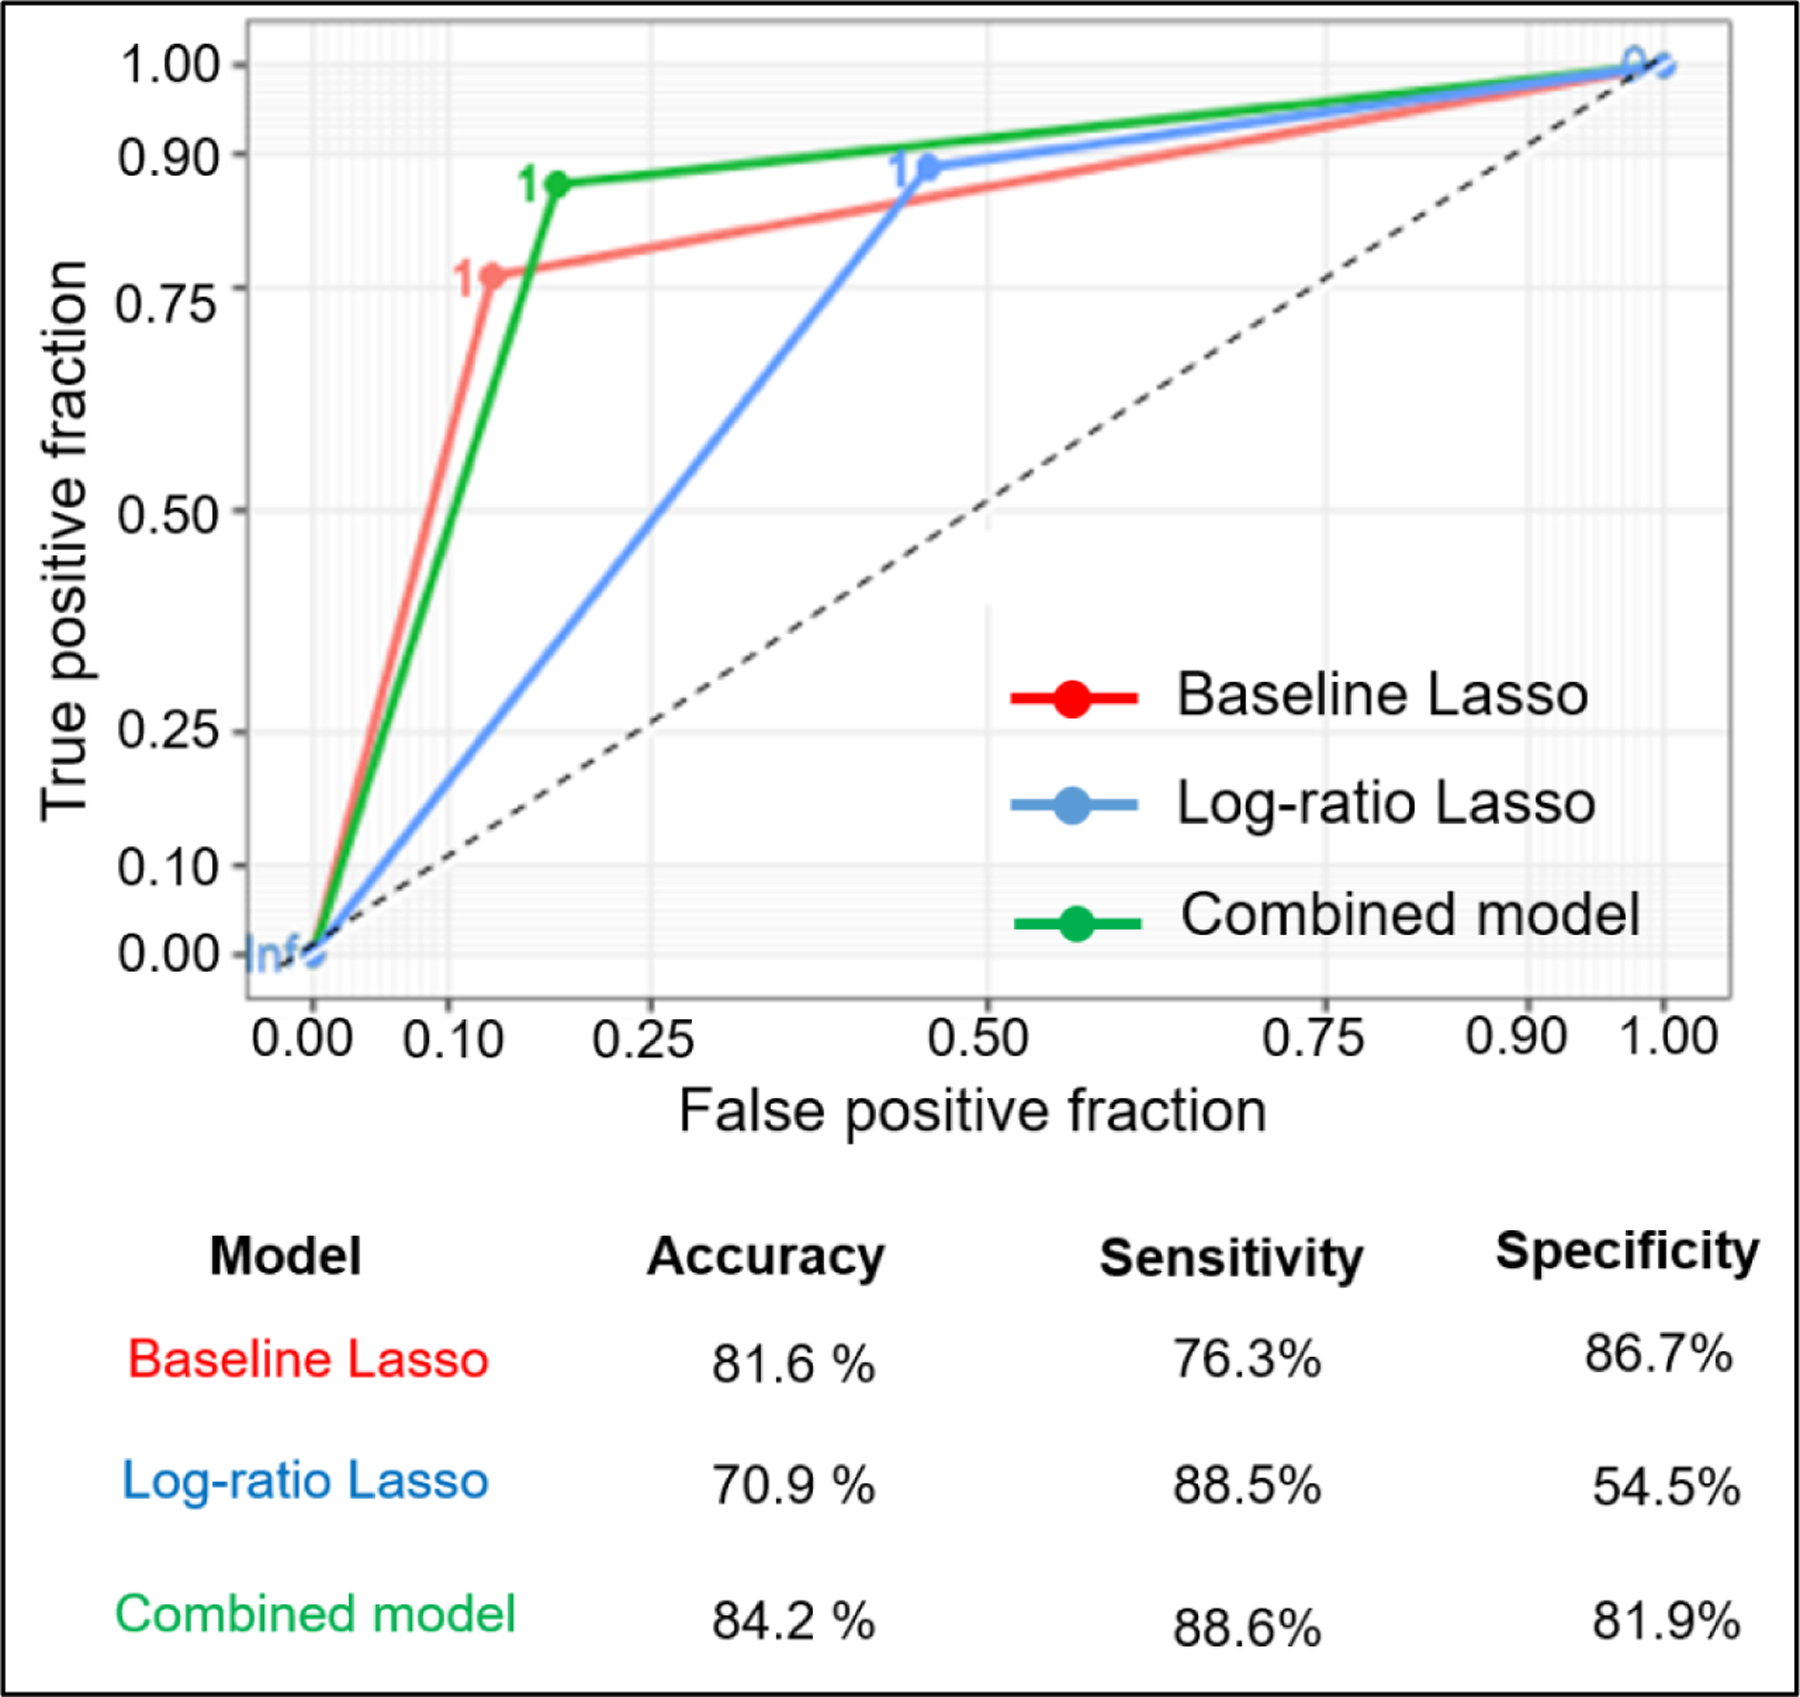
Clear cell renal cell carcinoma (ccRCC) is the most common and lethal subtype of kidney cancer. Intraoperative frozen section (IFS) analysis is used to confirm the diagnosis during partial nephrectomy. However, surgical margin evaluation using IFS analysis is time consuming and unreliable, leading to relatively low utilization. In our study, we demonstrated the use of desorption electrospray ionization mass spectrometry imaging (DESI-MSI) as a molecular diagnostic and prognostic tool for ccRCC. DESI-MSI was conducted on fresh-frozen 23 normal tumor paired nephrectomy specimens of ccRCC. An independent validation cohort of 17 normal tumor pairs was analyzed. DESI-MSI provides two-dimensional molecular images of tissues with mass spectra representing small metabolites, fatty acids and lipids. These tissues were subjected to histopathologic evaluation. A set of metabolites that distinguish ccRCC from normal kidney were identified by performing least absolute shrinkage and selection operator (Lasso) and log-ratio Lasso analysis. Lasso analysis with leave-one-patient-out cross-validation selected 57 peaks from over 27,000 metabolic features across 37,608 pixels obtained using DESI-MSI of ccRCC and normal tissues. Baseline Lasso of metabolites predicted the class of each tissue to be normal or cancerous tissue with an accuracy of 94 and 76%, respectively. Combining the baseline Lasso with the ratio of glucose to arachidonic acid could potentially reduce scan time and improve accuracy to identify normal (82%) and ccRCC (88%) tissue. DESI-MSI allows rapid detection of metabolites associated with normal and ccRCC with high accuracy. As this technology advances, it could be used for rapid intraoperative assessment of surgical margin status.
Keywords: clear cell renal cell carcinoma; electrospray ionization; histopathology; metabolome; nephrectomy; surgical margins.
© 2019 UICC.
Conflict of interest statement
Conflicts of interest:
The authors declare no potential conflicts of interest.
Figures
Similar articles
-
Distinguishing Renal Cell Carcinoma From Normal Kidney Tissue Using Mass Spectrometry Imaging Combined With Machine Learning.JCO Precis Oncol. 2023 Jun;7:e2200668. doi: 10.1200/PO.22.00668. JCO Precis Oncol. 2023. PMID: 37285559 Free PMC article.
-
DESI-MSI-guided exploration of metabolic-phenotypic relationships reveals a correlation between PI 38:3 and proliferating cells in clear cell renal cell carcinoma via single-section co-registration of multimodal imaging.Anal Bioanal Chem. 2024 Jul;416(18):4015-4028. doi: 10.1007/s00216-024-05339-0. Epub 2024 May 23. Anal Bioanal Chem. 2024. PMID: 38780655 Free PMC article.
-
Pancreatic Cancer Surgical Resection Margins: Molecular Assessment by Mass Spectrometry Imaging.PLoS Med. 2016 Aug 30;13(8):e1002108. doi: 10.1371/journal.pmed.1002108. eCollection 2016 Aug. PLoS Med. 2016. PMID: 27575375 Free PMC article.
-
Desorption electrospray ionization mass spectrometry imaging (DESI-MSI) in disease diagnosis: an overview.Anal Methods. 2023 Aug 10;15(31):3768-3784. doi: 10.1039/d3ay00867c. Anal Methods. 2023. PMID: 37503728 Review.
-
Diagnostic and prognostic tissuemarkers in clear cell and papillary renal cell carcinoma.Cancer Biomark. 2010;7(6):261-8. doi: 10.3233/CBM-2010-0195. Cancer Biomark. 2010. PMID: 21694464 Review.
Cited by
-
Aggregated Molecular Phenotype Scores: Enhancing Assessment and Visualization of Mass Spectrometry Imaging Data for Tissue-Based Diagnostics.Anal Chem. 2023 Aug 29;95(34):12913-12922. doi: 10.1021/acs.analchem.3c02389. Epub 2023 Aug 14. Anal Chem. 2023. PMID: 37579019 Free PMC article.
-
Advances in mass spectrometry imaging for spatial cancer metabolomics.Mass Spectrom Rev. 2024 Mar-Apr;43(2):235-268. doi: 10.1002/mas.21804. Epub 2022 Sep 6. Mass Spectrom Rev. 2024. PMID: 36065601 Free PMC article. Review.
-
Recent Advances and Applications of Ambient Mass Spectrometry Imaging in Cancer Research: An Overview.Mass Spectrom (Tokyo). 2023;12(1):A0129. doi: 10.5702/massspectrometry.A0129. Epub 2023 Sep 28. Mass Spectrom (Tokyo). 2023. PMID: 37789912 Free PMC article. Review.
-
Exploring Immune-Related Ferroptosis Genes in Thyroid Cancer: A Comprehensive Analysis.Biomedicines. 2025 Apr 8;13(4):903. doi: 10.3390/biomedicines13040903. Biomedicines. 2025. PMID: 40299520 Free PMC article.
-
Spatially resolved metabolomics: From metabolite mapping to function visualising.Clin Transl Med. 2024 Nov;14(11):e70031. doi: 10.1002/ctm2.70031. Clin Transl Med. 2024. PMID: 39456123 Free PMC article. Review.
References
-
- Laganosky DD, Filson CP, Master VA. Surgical Margins in Nephron-Sparing Surgery for Renal Cell Carcinoma. Current Urology Reports 2017;18: 8. - PubMed
-
- Julien D, Pascal M, Matthew M, Onder K, Ryan N, Jaya C, H. KJ. Frozen Sections for Margins During Partial Nephrectomy Do Not Influence Recurrence Rates. Journal of Endourology 2018;32: 759–64. - PubMed
Publication types
MeSH terms
Grants and funding
LinkOut - more resources
Full Text Sources
Medical
Research Materials
