. 2020 Jan 6;219(1):e201812135.
doi: 10.1083/jcb.201812135.

CHC22 clathrin mediates traffic from early secretory compartments for human GLUT4 pathway biogenesis

Affiliations

CHC22 clathrin mediates traffic from early secretory compartments for human GLUT4 pathway biogenesis

Stéphane M Camus et al. J Cell Biol. .

Abstract

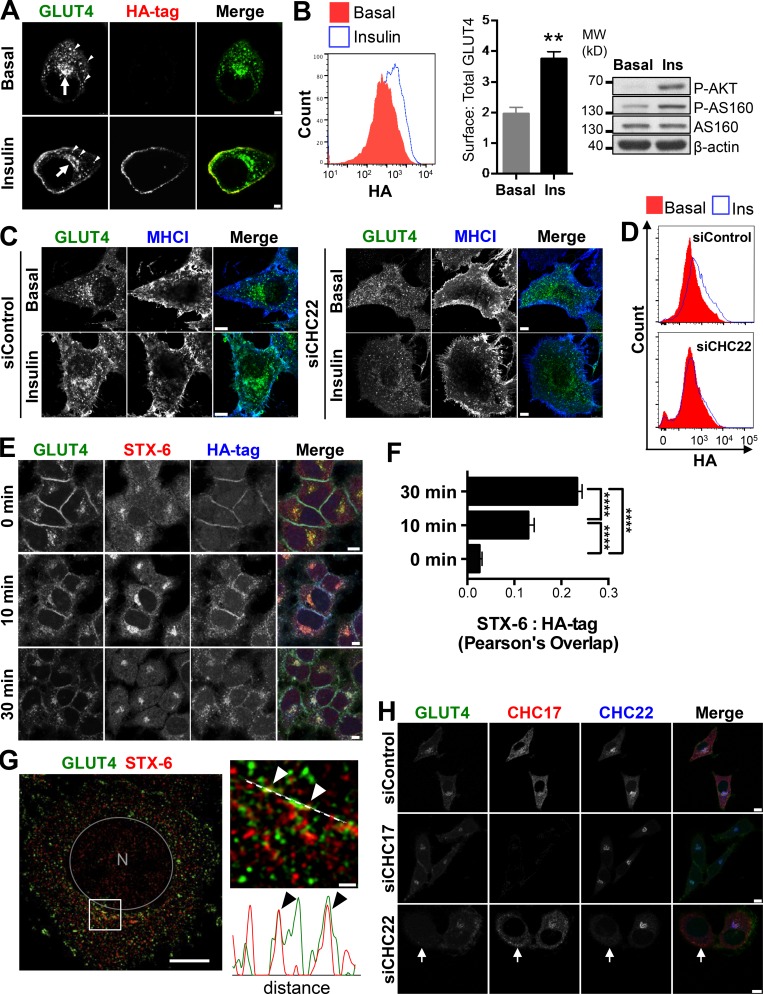
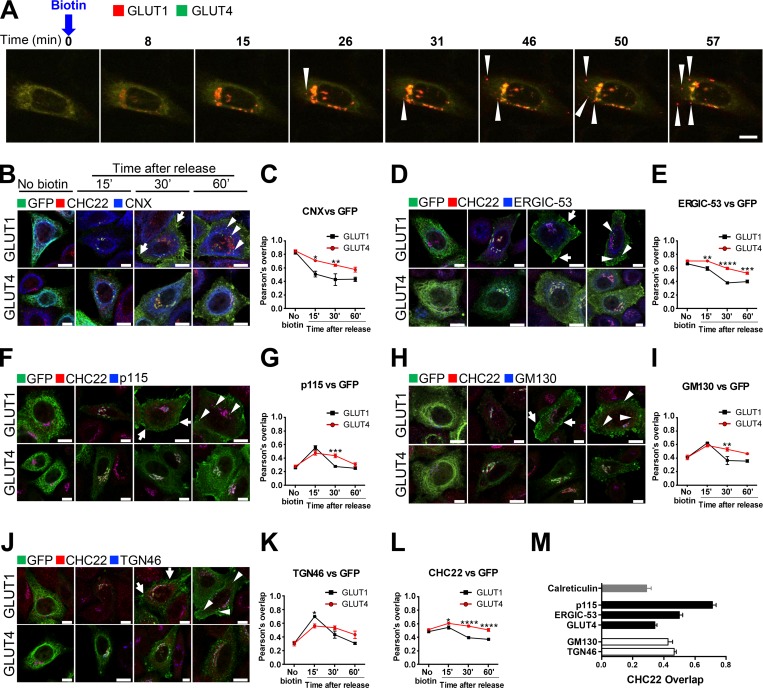
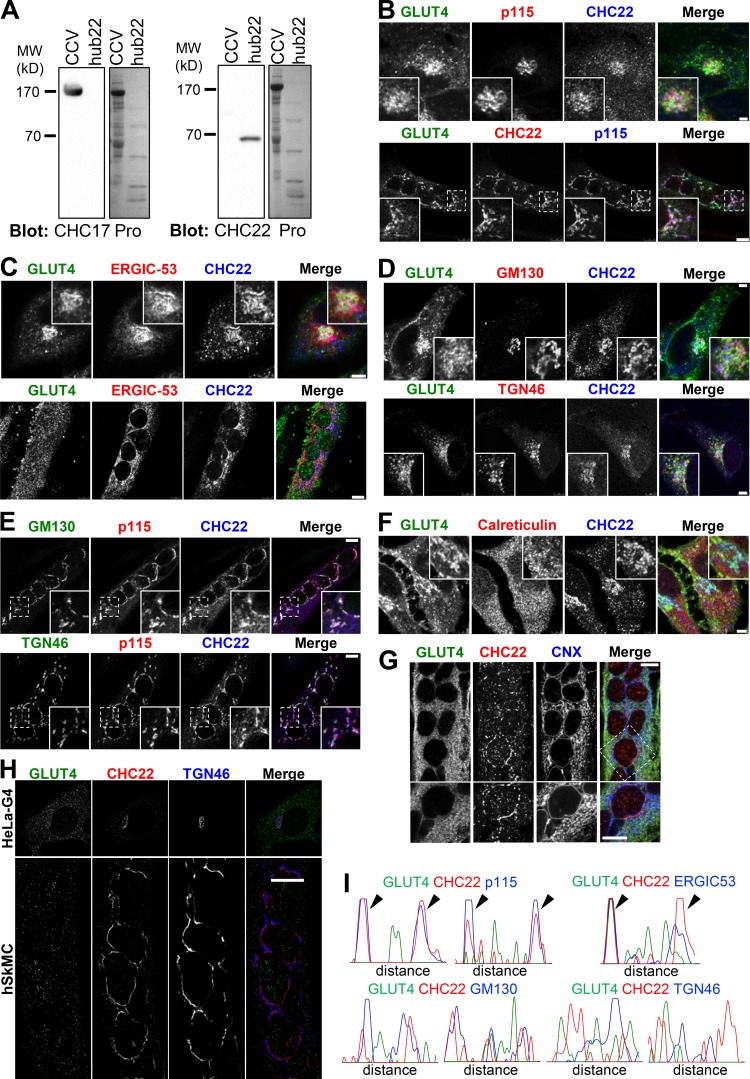
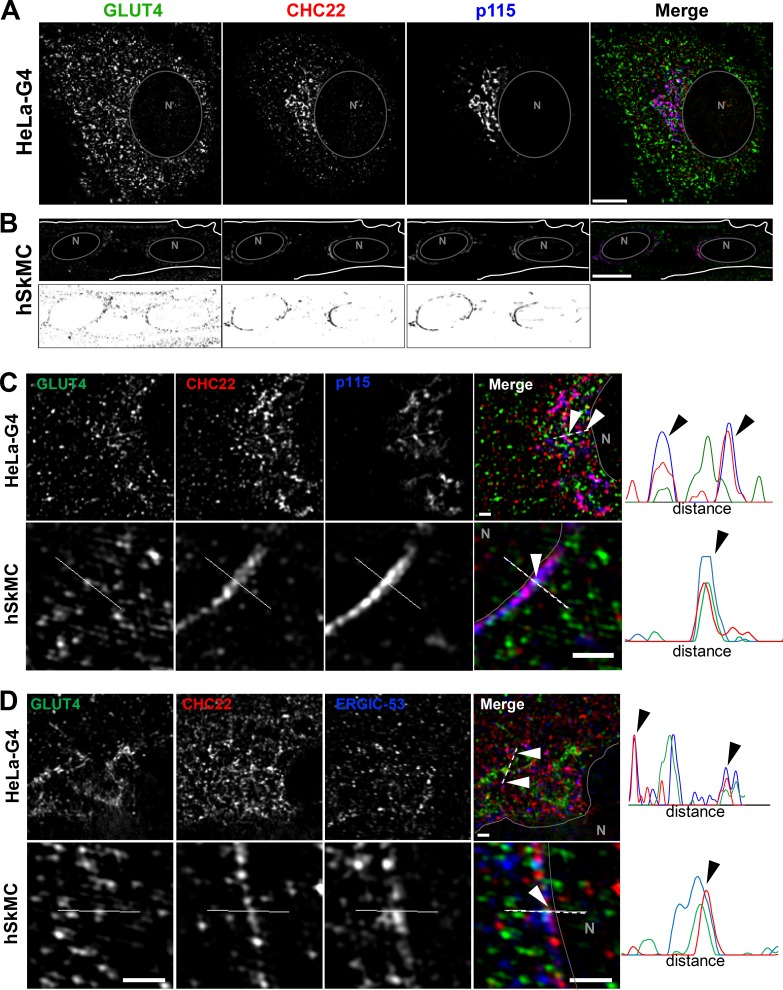
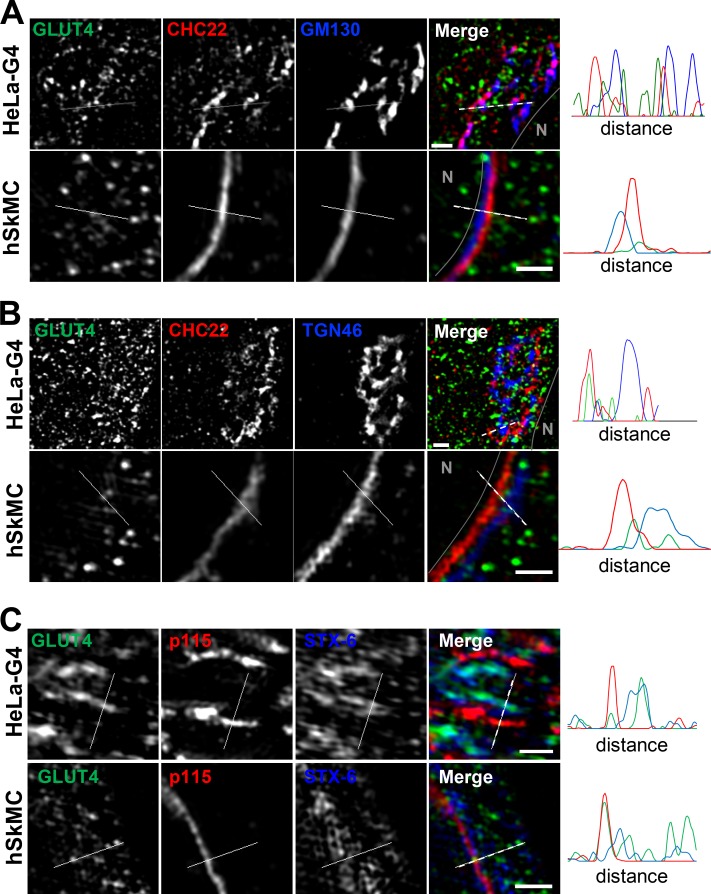
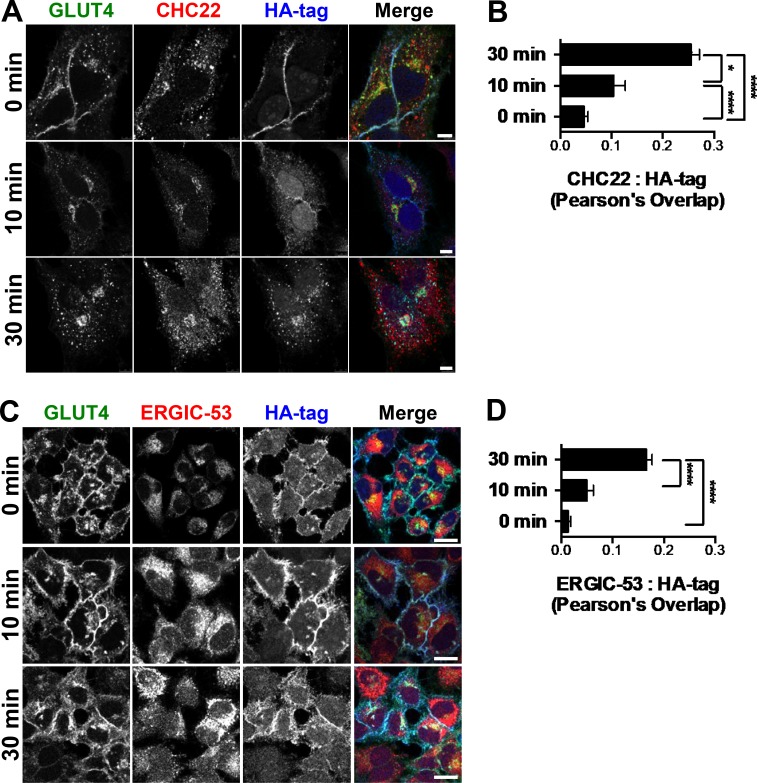
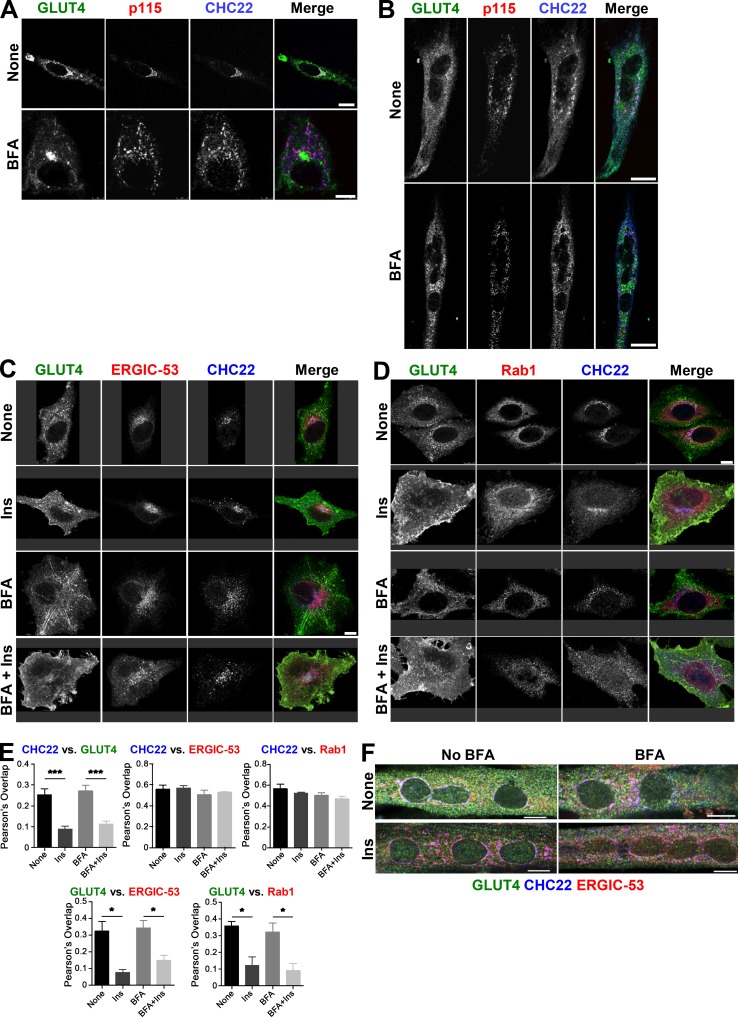
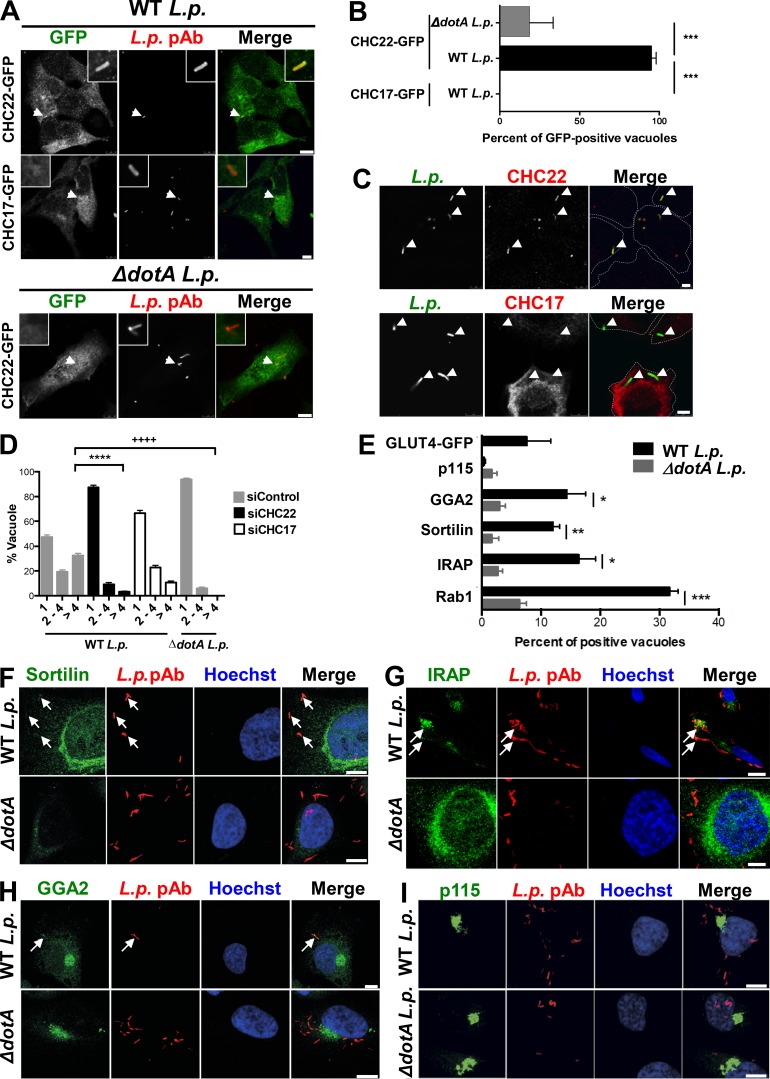
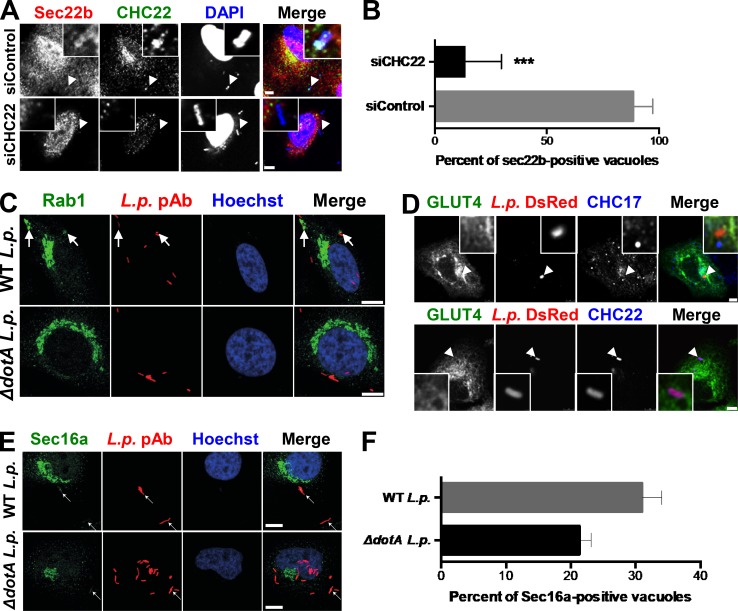
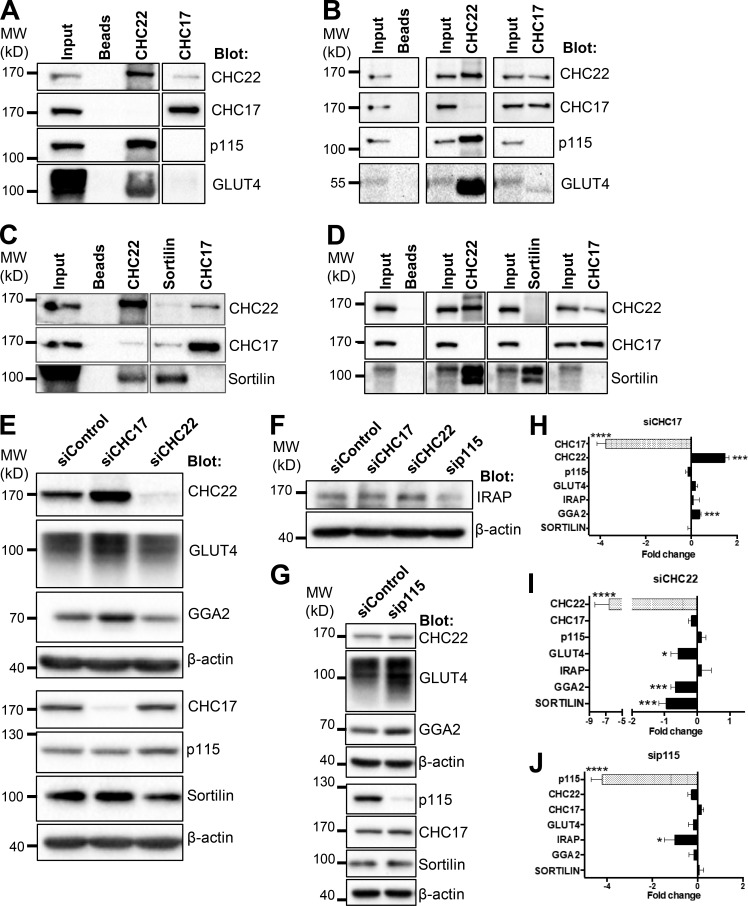
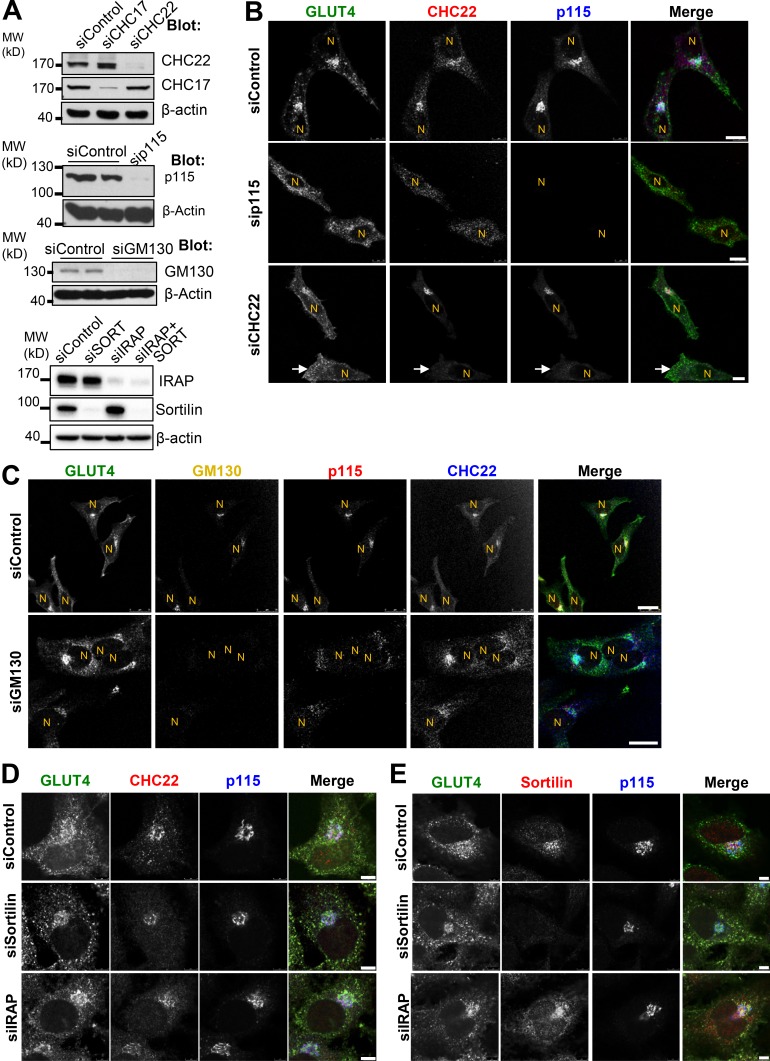
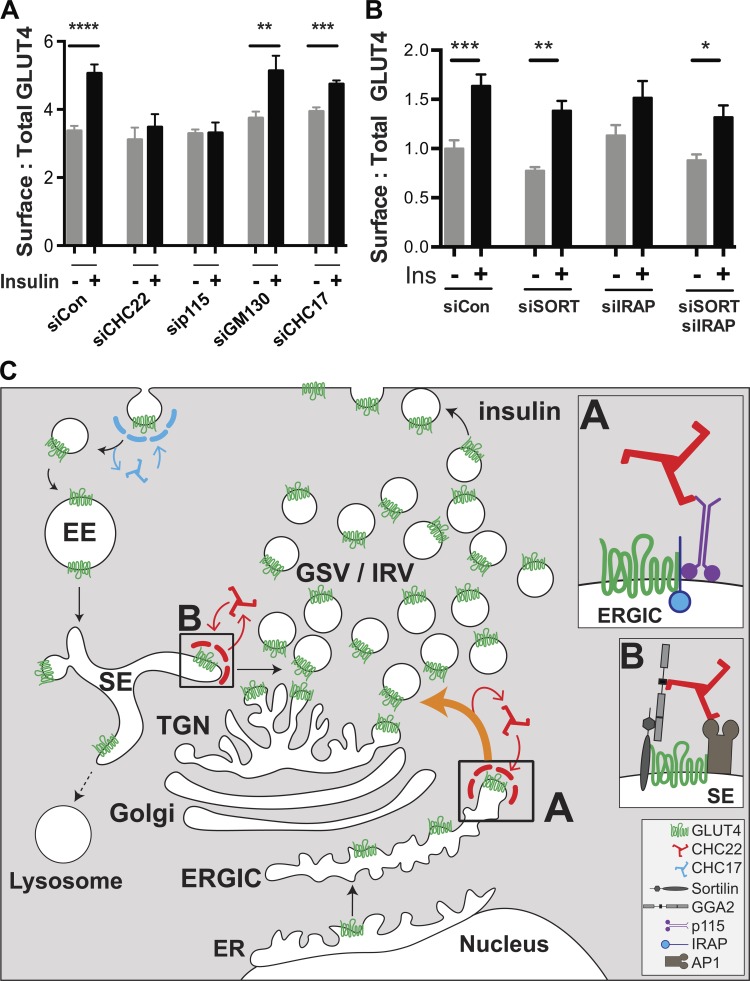
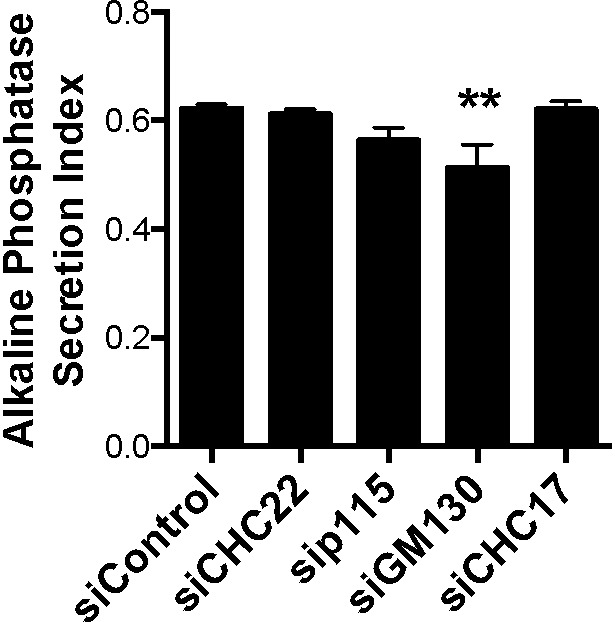
Glucose transporter 4 (GLUT4) is sequestered inside muscle and fat and then released by vesicle traffic to the cell surface in response to postprandial insulin for blood glucose clearance. Here, we map the biogenesis of this GLUT4 traffic pathway in humans, which involves clathrin isoform CHC22. We observe that GLUT4 transits through the early secretory pathway more slowly than the constitutively secreted GLUT1 transporter and localize CHC22 to the ER-to-Golgi intermediate compartment (ERGIC). CHC22 functions in transport from the ERGIC, as demonstrated by an essential role in forming the replication vacuole of Legionella pneumophila bacteria, which requires ERGIC-derived membrane. CHC22 complexes with ERGIC tether p115, GLUT4, and sortilin, and downregulation of either p115 or CHC22, but not GM130 or sortilin, abrogates insulin-responsive GLUT4 release. This indicates that CHC22 traffic initiates human GLUT4 sequestration from the ERGIC and defines a role for CHC22 in addition to retrograde sorting of GLUT4 after endocytic recapture, enhancing pathways for GLUT4 sequestration in humans relative to mice, which lack CHC22.


Figures

Figure 1.
Figure 1.
HeLa-GLUT4 cells have a functional GLUT4 trafficking pathway that requires CHC22. (A) Representative images of GLUT4 (exofacial HA tag, internal GFP tag) in HeLa-GLUT4 cells before (basal) or after insulin treatment. GLUT4 at the plasma membrane was detected by IF after surface labeling with anti-HA monoclonal antibody (red). Total GLUT4 (green) was detected by GFP tag. Arrows show the GSC. Arrowheads point to peripheral GLUT4 vesicles. Scale bars: 7.5 µm. (B) Left: Representative FACS histogram of surface GLUT4 fluorescence intensities (signal from anti-HA labeling) before (basal) and after insulin treatment (Ins). Middle: Quantification of surface-to-total GLUT4 (HA-to-GFP MFI signals). Data expressed as mean ± SEM, n = 3, 10,000 cells acquired per experiment. Two-tailed unpaired Student’s t test with equal variances: **, P < 0.01. Right: Representative immunoblot for phosphorylated AKT (p-AKT), phosphorylated AS160 (p-AS160), total AS160, and β-actin in HeLa-GLUT4 cells before and after insulin treatment. The migration position of molecular weight (MW) markers is indicated at the left in kilodaltons. (C) Representative images of total GLUT4 (GFP tag, green) and MHCI (blue) before (basal) or after insulin treatment in HeLa-GLUT4 cells transfected with nontargeting control siRNA (siControl) or siRNA targeting CHC22 (siCHC22). Scale bars: 8 µm. (D) Representative FACS histograms of surface GLUT4 fluorescence intensity (signal from anti-HA labeling) in HeLa-GLUT4 cells transfected with siControl or siRNA siCHC22 before (red) or after (blue) treatment with insulin. Histograms are extracted from the experiment quantified in Fig. 8 A. (E) Representative IF staining for internalized surface-labeled GLUT4 (HA tag, blue) and STX-6 (red) for HeLa-GLUT4 cells at 0, 10, or 30 min after insulin treatment. Total GLUT4 is detected by GFP tag (green). Scale bars: 7.5 µm. (F) Pearson’s overlap quantification for labeling of STX-6 and HA tag. Data expressed as mean ± SEM, n = 3, 14–19 cells per experiment. One-way ANOVA followed by Bonferroni’s multiple comparison post hoc test, ****, P < 0.0001. (G) Left: Representative SIM image of a HeLa-GLUT4 cell stained for STX-6 (red). Total GLUT4 (green) was detected by GFP tag. The gray circle delineates the nucleus (N) and the white square delineates the magnified area displayed in the right image. Scale bars: 10 µm; magnified image: 1 µm. Right: The white dashed line in the magnified area spans the segment for which fluorescence intensities for GLUT4 and STX-6 are plotted below, in green and red, respectively. Arrowheads indicate areas of overlap. (H) Representative IF staining for CHC17 (red) and CHC22 (blue) in HeLa-GLUT4 cells transfected with nontargeting siControl or siRNA targeting CHC17 (siCHC17) or siCHC22, with GLUT4 detected by GFP tag (green). Arrows point to a CHC22-depleted cell. Scale bars: 10 µm for siControl and siCHC17 and 7.5 µm for siCHC22. Merged images in A, C, E, G, and H show red/green overlap in yellow, red/blue overlap in magenta, green/blue overlap in cyan, and red/green/blue overlap in white.
Figure 2.
Figure 2.
Newly synthesized GLUT4 is delayed in the early secretory pathway compared with GLUT1. (A) Representative stills extracted from Video 1 showing a HeLa cell expressing the ER Ii-hook fused to streptavidin along with HA-GLUT1-SBP-mCherry (GLUT1, red) and HA-GLUT4-SBP-GFP (GLUT4, green). The intracellular traffic of GLUT1-mCherry and GLUT4-GFP was simultaneously tracked for 1 h after biotin addition released them from the ER. Upon ER exit, both GLUT1 and GLUT4 accumulated in the perinuclear region of the cell (yellow). From 26 min onward, highly mobile GLUT1 vesicles (arrowheads) were visible (red), while GLUT4 remained perinuclear. Scale bar: 10 µm. (B, D, F, H, and J) Representative IF staining for GLUT1-SBP-GFP or GLUT4-SBP-GFP (detected with anti-GFP antibody, green), CHC22 (red), and CNX (blue; B), ERGIC-53 (blue; D), p115 (blue; F), GM130 (blue, H), or TGN46 (blue; J) in HeLa cells expressing HA-GLUT1-SBP-GFP or HA-GLUT4-SBP-GFP along with the ER Ii-hook. Traffic of GLUT4 and GLUT1 was tracked at 0, 15, 30, and 60 min after release from the ER by biotin. Arrows point to GLUT1 detected at the plasma membrane and arrowheads point to GLUT1-positive endosomal structures. Merged images show red/green overlap in yellow, red/blue overlap in magenta, green/blue overlap in cyan, and red/green/blue overlap in white. Scale bars: 10 µm. (C, E, G, I, K, and L) Pearson’s overlap between GLUT1 or GLUT4 and CNX, ERGIC-53, p115, GM130, TGN46, or CHC22 at different time points after ER release. Data expressed as mean ± SEM, n = 3–4, 10–46 cells per experiment. One-way ANOVA followed by Sidak’s multiple comparison post hoc test, *, P < 0.05; **, P < 0.01; ***, P < 0.001; ****, P < 0.0001 to test differences between GLUT1 and GLUT4 overlap with markers at each time point. (M) Pearson’s overlap between CHC22 and GLUT4, ER marker calreticulin, ERGIC markers p115 and ERGIC-53, cis-Golgi marker GM130, or trans-Golgi marker TGN46 in HeLa-GLUT4 from images taken by confocal microscopy (corresponding representative IF staining in Fig. S1). Data expressed as mean ± SEM, n = 3, 4–10 cells across three independent samples.
Figure S1.
Figure S1.
IF localization of CHC22 at the ERGIC in HeLa-GLUT4 cells and in human skeletal muscle cells. (A) Immunoblots (left) for CHC17 (X22 antibody) or CHC22 (CLTCL1 antibody from Proteintech) of CCVs purified from pig brain containing only CHC17, or of cell lysate from bacteria expressing low levels of the hub fragment (residues 1074–1640) of CHC22 (hub22). Ponceau staining for proteins (Pro) is shown to the right of each antibody blot. The migration of MW markers is indicated at the left in kilodaltons. (B) Representative confocal microscopy IF imaging of CHC22 (red or blue), p115 (red or blue), and GLUT4 (green) in HeLa-GLUT4 cells (top panel) or LHCNM2 myotubes (bottom panel). (C) Representative IF staining for CHC22 (blue), ERGIC-53 (red), and GLUT4 (green) in HeLa-GLUT4 cells (top panel) or LHCNM2 myotubes (bottom panel). Scale bars: 5 µm for HeLa-GLUT4 cells and 7.5 µm for LHCNM2 myotubes in B and C. (D) Representative IF staining for CHC22 (blue), GM130 or TGN46 (red), and GLUT4 (GFP, green) in HeLa-GLUT4 cells. Scale bars: 5 µm. (E) Representative IF staining for CHC22 (blue), GM130 or TGN46 (green), and p115 (red) in LHCNM2 myotubes. Scale bars: 7.5 µm. (F) Representative IF staining for CHC22 (blue), calreticulin (red), and GLUT4 (green) in HeLa-GLUT4 cells. Scale bars: 5 µm. (G) Representative IF staining for CHC22 (red), CNX (blue), and GLUT4 (green) in hSkMC-AB1190-GLUT4. Scale bars: 10 µm. (H) Representative SIM of a HeLa-GLUT4 (HeLa-G4) cell (top panel) and human skeletal muscle cell (hSkMC-AB1190-GLUT4, bottom panel) stained for CHC22 (red) and TGN46 (blue). GLUT4 (green) was detected by GFP tag in HeLa-GLUT4 and immunostained with an anti-GFP antibody in hSkMC-AB1190-GLUT4. Scale bar: 10 µm. Merged images in B–H show red/green overlap in yellow, red/blue overlap in magenta, green/blue overlap in cyan, and red/green/blue overlap in white. (I) Representative fluorescence intensity plots for GLUT4 (green), CHC22 (red), and p115, ERGIC-53, GM130, or TGN46 (blue) generated from SIM images of the perinuclear region of HeLa-GLUT4 cells. Arrowheads indicate areas of peak overlap.
Figure 3.
Figure 3.
CHC22 is localized at the ERGIC in HeLa GLUT4 and human myotubes. (A and B) Representative SIM of a HeLa-GLUT4 cell (HeLa-G4; A) and the human skeletal muscle cell line hSkMC-AB1190-GLUT4 (hSkMC; B) stained for CHC22 (red) and p115 (blue). The gray circles delineate the nuclei (N). Muscle cell staining with each antibody is shown in black on white below the color images. Scale bars: 10 µm. (C and D) Representative SIM of the perinuclear region of HeLa-GLUT4 cells and hSkMC-AB1190-GLUT4 stained for CHC22 (red), p115 (C), and ERGIC-53 (blue; D). The solid gray lines delineate the nuclear border (N). The dashed white lines span the segment for which fluorescence intensities for GLUT4 (green), CHC22 (red), and p115 or ERGIC-53 (blue) were plotted. Arrowheads indicate areas of peak overlap. Scale bars: 1 µm. In A–D, GLUT4 (green) was detected by GFP tag in HeLa-GLUT4 or immunostained with anti-GFP antibody in hSkMC-AB1190-GLUT4. Merged images show red/green overlap in yellow, red/blue overlap in magenta, green/blue overlap in cyan, and red/green/blue overlap in white.
Figure 4.
Figure 4.
The CHC22 compartment is localized proximal to the TGN and does not overlap with the cis-Golgi. (A–C) Representative SIM of the perinuclear region of HeLa-GLUT4 cells (HeLa-G4) and hSkMC-AB1190-GLUT4 (hSkMC) stained for CHC22 (red) and GM130 (A), TGN46 (B), and STX-6 (blue; C). The solid gray lines delineate the nuclear border (N). The dashed white lines span the segment over which fluorescence intensities for GLUT4 (green), CHC22 (red), and GM130, TGN46, and STX-6 (blue) were plotted. Scale bars: 1 µm. In A–C, GLUT4 (green) was detected by GFP tag in HeLa-GLUT4 or immunostained using an anti-GFP antibody in hSkMC-AB1190-GLUT4. Merged images show red/green overlap in yellow, red/blue overlap in magenta, green/blue overlap in cyan, and red/green/blue overlap in white.
Figure S2.
Figure S2.
Surface GLUT4 is recycled to the GSC in proximity to the ERGIC. (A) Representative IF staining for internalized surface-labeled GLUT4 (HA tag, blue) and CHC22 (red) for HeLa-GLUT4 cells at 0, 10, or 30 min after insulin treatment. Total GLUT4 is detected by GFP tag (green). Scale bars: 5 µm. (B) Pearson’s overlap for labeling of CHC22 and HA tag. Data expressed as mean ± SEM, n = 3, 8–40 cells per experiment. One-way ANOVA followed by Bonferroni’s multiple comparison post hoc test, *, P < 0.05; ****, P < 0.0001. (C) Representative IF staining for internalized surface-labeled GLUT4 (HA tag, blue) and ERGIC-53 (red) for HeLa-GLUT4 cells at 0, 10, or 30 min after insulin treatment. Total GLUT4 is detected by GFP tag (green). Scale bars: 10 µm. (D) Pearson’s overlap for labeling of ERGIC-53 and HA tag. Data expressed as mean ± SEM, n = 3, 14–22 cells per experiment. One-way ANOVA followed by Bonferroni’s multiple comparison post hoc test, ****, P < 0.0001. Merged images show red/green overlap in yellow, red/blue overlap in magenta, green/blue overlap in cyan, and red/green/blue overlap in white.
Figure S3.
Figure S3.
CHC22 redistributes with p115 following BFA treatment. (A and B) Representative IF staining for CHC22 (blue) and p115 (red) in HeLa-GLUT4 cells (A) or LHCNM2 myotubes (B) treated or not with BFA. GLUT4 (green) was detected by GFP tag in HeLa-G4 cells and by IF of endogenous protein in LHCNM2 cells. Scale bars: 5 and 25 µm for A and B, respectively. (C and D) Representative IF staining of HeLa-GLUT4 cells for CHC22 (blue) and ERGIC-53 (red) in C or Rab1 (red) in D treated or not with BFA and stimulated or not by insulin (Ins). GLUT4 (green) was detected by GFP. Scale bars: 10 µm. (E) Quantification of Pearson’s overlap values between CHC22, GLUT4, ERGIC-53, and Rab1 as in C and D. Data expressed as mean ± SEM, n = 3–4, 5–42 cells per experiment. One-way ANOVA followed by Tukey’s multiple comparison post hoc test, *, P < 0.05; ***, P < 0.001. (F) Representative IF staining for CHC22 (blue), ERGIC-53 (red), and GLUT4 (anti-GFP antibody, green) in hSkMC-AB1190-GLUT4 treated or not with BFA and stimulated or not by insulin (Ins). Scale bar: 10 µm. Merged images show red/green overlap in yellow, red/blue overlap in magenta, green/blue overlap in cyan, and red/green/blue overlap in white.
Figure 5.
Figure 5.
CHC22 mediates membrane traffic from the ERGIC to the L.p. replicative vacuole, which acquires some GLUT4 pathway markers. (A) Representative images of L.p.-infected A549 cells transiently transfected with GFP-tagged CHC22 or CHC17 (green). 1 h after infection with either WT or mutant ΔdotA L.p. (MOI = 50), bacteria were detected by IF (red). Arrowheads point to L.p., and boxed inserts (upper right or left) show the L.p. region at 5× magnification. Scale bars: 10 µm for cells expressing CHC22-GFP; 7.5 µm for cells expressing CHC17-GFP. (B) Quantification of the proportion of L.p. vacuoles positive for CHC22 or CHC17. Data expressed as mean ± SEM, n = 3, 4–35 vacuoles counted per experiment performed as represented in A. One-way ANOVA followed by Bonferroni’s multiple comparison post hoc test, ***, P < 0.001. (C) Representative images of A549 cells infected with WT L.p. (MOI = 50) immunolabeled for endogenous CHC22 or CHC17 (red) and L.p. (green) by IF. Arrowheads point to L.p.; dashed lines delineate cell borders. Scale bars: 5 µm. (D) Quantification of the proportion of replicative vacuoles (8 h after infection) containing one, two to four, or more than four WT or ΔdotA L.p. after treatment with siRNA targeting CHC22 (siCHC22) or CHC17 (siCHC17) or nontargeting siRNA (siControl). Data expressed as mean ± SEM, n = 3, >140 vacuoles counted per experiment. One-way ANOVA followed by Bonferroni’s multiple comparison post hoc test was performed to compare the number of cells with a vacuole containing more than four bacteria. ****, P < 0.0001 versus siControl-transfected cells infected with WT L.p. ++++, P < 0.0001 versus siControl-transfected cells infected with ΔdotA L.p. (E) Quantification of the proportion of L.p. vacuoles positive for GLUT4-GFP, p115, GGA2, sortilin, IRAP, or Rab1 1 h after infection with WT or ΔdotA L.p. in HeLa cells transiently expressing FcγRII (needed for L.p. infection; Arasaki and Roy, 2010). Data expressed as mean ± SEM, n = 3, 4–50 vacuoles counted per experiment. Two-tailed unpaired Student’s t test with equal variances: *, P < 0.05; **, P < 0.01; ***, P < 0.001. (F–I) Representative IF of HeLa cells 1 h after infection with either WT or mutant ΔdotA L.p. (MOI = 50) stained for L.p. (red) and sortilin (F), IRAP (G), GGA2 (H), or p115 (green; I). Hoechst stains the nuclei blue. Arrows point to LCVs. Scale bars: 10 µm. Merged images in A, C, and F–I show red/green overlap in yellow.
Figure S4.
Figure S4.
GLUT4 pathway markers are variably recruited to L.p.’s replicative vacuole. (A) Representative IF images of single A549 cells from cultures treated with siRNA targeting CHC22 or with nontargeting control siRNA and labeled for Sec22b (red) and CHC22 (green), 1 h after infection with WT L.p. (MOI = 50). Arrows point to L.p. detected with DAPI. Boxed inserts show L.p. region at 5× and 2× magnification for nontargeting control siRNA (siControl) and siCHC22, respectively. Scale bar: 5 µm referring to main images. (B) Quantification of the proportion of L.p. vacuoles staining positive for Sec22b. Data expressed as mean ± SEM, n = 4, 10–20 vacuoles counted per experiment as represented in A. Two-tailed unpaired Student’s t test with equal variances, ***, P < 0.001. (C) Representative images of HeLa cells transiently expressing FcγRII (needed for L.p. infection; Arasaki and Roy, 2010), infected with WT or mutant ΔdotA L.p. (MOI = 50, red) and labeled 1 h after infection with antibodies against Rab1 (green). Hoechst stains the nuclei blue. Arrows point to L.p. Scale bar: 10 µm. (D) Representative images of A549 cells transiently transfected with HA-GLUT4-GFP (green), infected with WT L.p.-expressing mono-DsRed protein (L.p.-DsRed, MOI = 50, red), and labeled 1 h after infection with antibodies against endogenous CHC17 (upper panel) or CHC22 (lower panel; blue). Scale bars: 5 µm. Arrowheads point to L.p. (E) Representative images of HeLa cells transiently expressing FcγRII, infected with WT or mutant ΔdotA L.p. (MOI = 50, red), and labeled 1 h after infection with antibodies against Sec16a (E; green). Hoechst stains the nuclei blue. Arrows point to L.p. Scale bar: 10 µm. (F) Quantification of the proportion of vacuoles staining positive for Sec16a. Data expressed as mean ± SEM, n = 3, 50 vacuoles counted per experiment as represented in E. Merged images in A and D show red/green overlap in yellow, red/blue overlap in magenta, green/blue overlap in cyan, and red/green/blue overlap in white. Merged images in C and E show red/green overlap in yellow.
Figure 6.
Figure 6.
CHC22 interacts with p115 and each influences stability of different partners involved in GLUT4 membrane traffic. (A–D) Representative immunoblots of immunoprecipitates of CHC22, CHC17 (A–D), or sortilin (C and D) from HeLa-GLUT4 cells (A and C) and hSKMC-AB1190 (B and D) immunoblotted for CHC22, CHC17, p115, GLUT4, and sortilin. The position of MW markers is indicated in kilodaltons at the left. (E–G) Representative immunoblots of HeLa-GLUT4 cells transfected with siRNA targeting CHC22, CHC17 (E and F), or p115 (F and G), or with nontargeting control siRNA (40 nM for 72 h) showing levels of CHC22, GLUT4, GGA2, CHC17, p115, sortilin, and β-actin (E and G) or levels of IRAP and β-actin (F). The position of MW markers is indicated in kilodaltons at the left. In HeLa-GLUT4 cells, GLUT4 is tagged, altering its migration compared with muscle cell GLUT4. (H–J) Quantifications of immunoblot signals as shown in E–G. Blot signals were normalized to β-actin for each experiment and the fold change (negative values indicate decrease and positive values indicate increase) relative to the normalized signal in control siRNA-treated cell lysates is plotted. Data expressed as mean ± SEM, n = 7–8. Two-tailed unpaired Student’s t test, with Welch’s correction where variances were unequal: *, P < 0.05; ***, P < 0.001; ****, P < 0.0001.
Figure 7.
Figure 7.
Depletion of CHC22 or p115, but not GM130, sortilin, or IRAP, disrupts perinuclear targeting of GLUT4. (A) Immunoblotting for CHC22, CHC17, p115, GM130, and β-actin after transfection of HeLa-GLUT4 cells with siRNA targeting CHC17, CHC22, p115, GM130, sortilin, IRAP, or nontargeting control siRNA (siControl). The position of MW markers is indicated in kilodaltons at the left. (B) Representative IF staining for CHC22 (red) and p115 (blue) in HeLa-GLUT4 cells after siRNA transfection as in A, with GLUT4 detected by GFP tag (green). N, nuclei. Arrows point to a CHC22-depleted cell. Scale bars: 10 µm. (C) Representative IF staining for GM130 (yellow), p115 (red), and CHC22 (blue) in HeLa-GLUT4 cells after treatment with siRNA targeting GM130 or with control siRNA, with GLUT4 detected by GFP tag (green). Individual antibody staining is shown in black and white, while the merged image shows all four colors with overlap indicated as below. Scale bars: 25 µm. (D and E) Representative IF staining for GLUT4 (green), CHC22 or sortilin (red), and p115 (blue) in HeLa-GLUT4 cells after treatment with siRNA targeting sortilin or IRAP, or with nontargeting control. Scale bars: 5 µm. Merged images show red/green overlap in yellow, red/blue overlap in magenta, green/blue overlap in cyan, and red/green/blue overlap in white.
Figure 8.
Figure 8.
Formation of the human insulin-responsive GLUT4 pathway involves membrane traffic from the ERGIC and supports a model for two routes to GLUT4 sequestration. (A and B) Insulin-stimulated GLUT4 translocation in HeLa-GLUT4 cells as quantified by FACS analysis of surface:total GLUT4. Cells were pretreated with siRNA targeting CHC22, CHC17, p115, GM130, sortilin, IRAP, sortilin plus IRAP, or nontargeting control siRNA (siCon) as in Fig. 7 A and then incubated with (+) or without (−) insulin (Ins). For the experiments in A, data are expressed as mean ± SEM, n = 9, 10,000 cells acquired per experiment. For the experiments in B, data are expressed as mean ± SEM, n = 7, 10,000 cells acquired per experiment. One-way ANOVA followed by Bonferroni’s multiple comparison post hoc test, *, P < 0.05; **, P < 0.01; ***, P < 0.001; ****, P < 0.0001 versus untreated. (C) Proposed model for the roles of CHC22 in the human GLUT4 pathway. Newly synthesized GLUT4 traffics from the ER to the ERGIC. At the ERGIC, a complex forms between IRAP and p115 that promotes binding of CHC22 clathrin and sequesters GLUT4 through its IRAP interaction (Shi et al., 2008; box A). Formation of the CHC22 clathrin coat at the ERGIC then facilitates sorting of GLUT4 to the intracellular region, where GLUT4 storage vesicles (GSV) and insulin-responsive GLUT4 vesicles (IRV) are formed. After insulin-mediated GLUT4 translocation and GLUT4 reuptake (by CHC17 clathrin), a complex forms (box B) between endosomal GLUT4, sortilin, and the clathrin adaptor GGA2, which promotes CHC22 recruitment. Endosomal GLUT4 sorting also involves clathrin adaptor AP1 (Blot and McGraw, 2008; Gillingham et al., 1999), which interacts with CHC22, further participating in its recruitment to endosomes (Vassilopoulos et al., 2009). Formation of the CHC22 coat on sorting endosomes facilitates GLUT4 traffic to the TGN via the retrograde pathway, enabling replenishment of the intracellular GSV/IRV pool. The GSC comprises the entire tubulo-vesicular complex involved in sorting and sequestration of GLUT4, with CHC22 mediating two pathways to the human GSC.
Figure S5.
Figure S5.
GM130 depletion affects the secretion of alkaline phosphatase in HeLa cells. Quantification of alkaline phosphatase secretion index for HeLa-GLUT4 cells treated with siRNA targeting CHC22, CHC17, p115, or GM130 or with nontargeting control siRNA. The alkaline phosphatase secretion index is the ratio of secreted enzyme activity (culture medium) to total cellular activity (secreted plus cell lysate). Data expressed as mean ± SEM, n = 13–19 independent samples across two independent assays. One-way ANOVA followed by Bonferroni’s multiple comparison post hoc test, **, P < 0.01 versus nontargeting control siRNA (siControl).

Similar articles

Cited by

References

    1. Alvarez C., Garcia-Mata R., Hauri H.P., and Sztul E.. 2001. The p115-interactive proteins GM130 and giantin participate in endoplasmic reticulum-Golgi traffic. J. Biol. Chem. 276:2693–2700. 10.1074/jbc.M007957200 - DOI - PubMed
    1. Antonescu C.N., Díaz M., Femia G., Planas J.V., and Klip A.. 2008. Clathrin-dependent and independent endocytosis of glucose transporter 4 (GLUT4) in myoblasts: regulation by mitochondrial uncoupling. Traffic. 9:1173–1190. 10.1111/j.1600-0854.2008.00755.x - DOI - PubMed
    1. Arasaki K., and Roy C.R.. 2010. Legionella pneumophila promotes functional interactions between plasma membrane syntaxins and Sec22b. Traffic. 11:587–600. 10.1111/j.1600-0854.2010.01050.x - DOI - PMC - PubMed
    1. Barnstable C.J., Bodmer W.F., Brown G., Galfre G., Milstein C., Williams A.F., and Ziegler A.. 1978. Production of monoclonal antibodies to group A erythrocytes, HLA and other human cell surface antigens-new tools for genetic analysis. Cell. 14:9–20. 10.1016/0092-8674(78)90296-9 - DOI - PubMed
    1. Berger K.H., Merriam J.J., and Isberg R.R.. 1994. Altered intracellular targeting properties associated with mutations in the Legionella pneumophila dotA gene. Mol. Microbiol. 14:809–822. 10.1111/j.1365-2958.1994.tb01317.x - DOI - PubMed

Publication types

MeSH terms