. 2020 Mar 18;48(5):2332-2347.
doi: 10.1093/nar/gkz1189.

Native elongation transcript sequencing reveals temperature dependent dynamics of nascent RNAPII transcription in Arabidopsis

Affiliations

Native elongation transcript sequencing reveals temperature dependent dynamics of nascent RNAPII transcription in Arabidopsis

Peter Kindgren et al. Nucleic Acids Res. .

Abstract

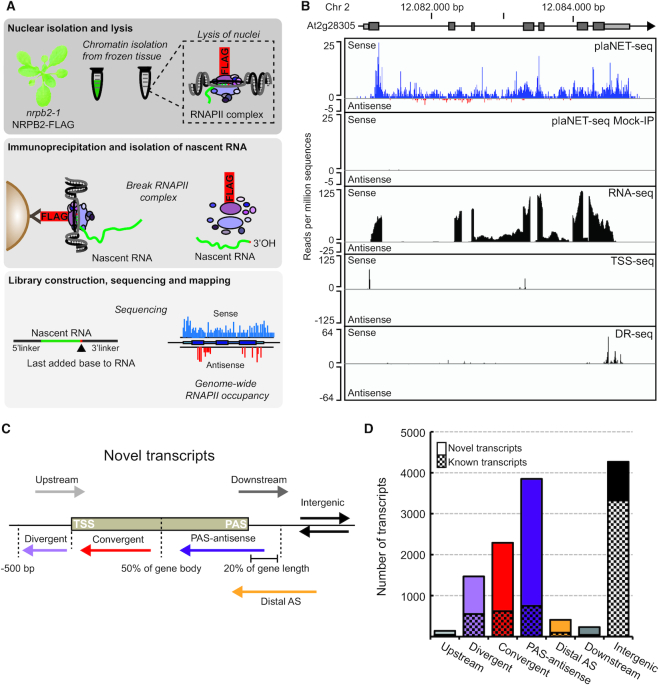
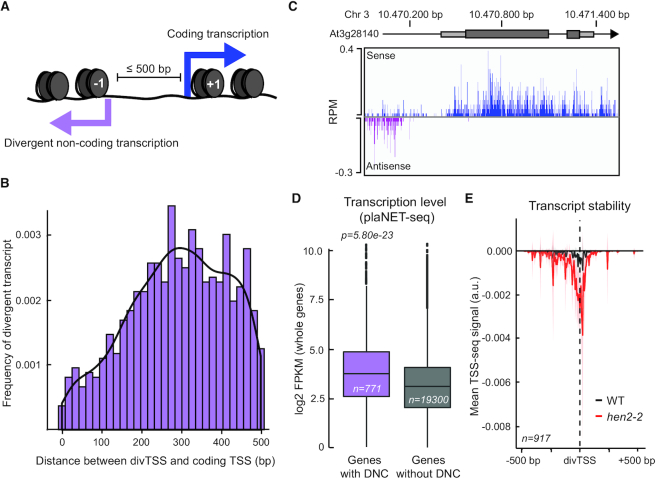
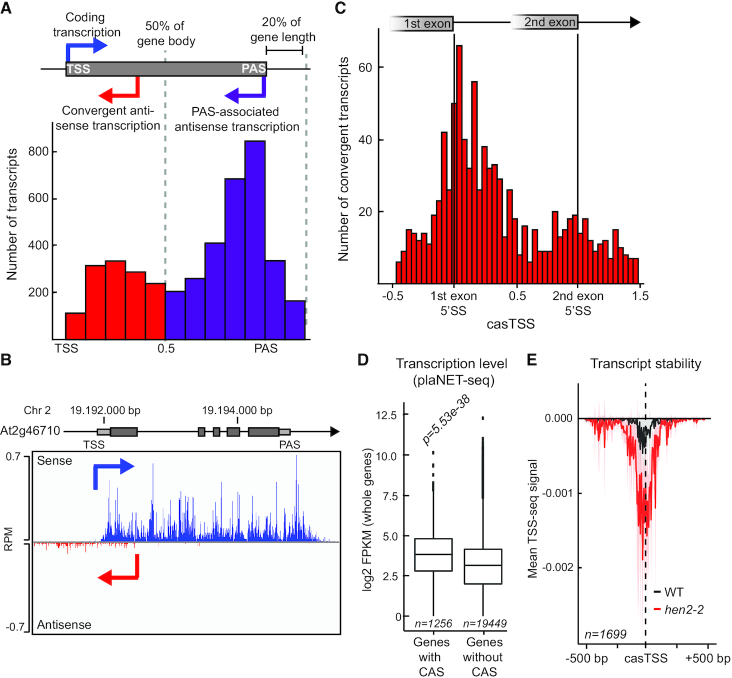
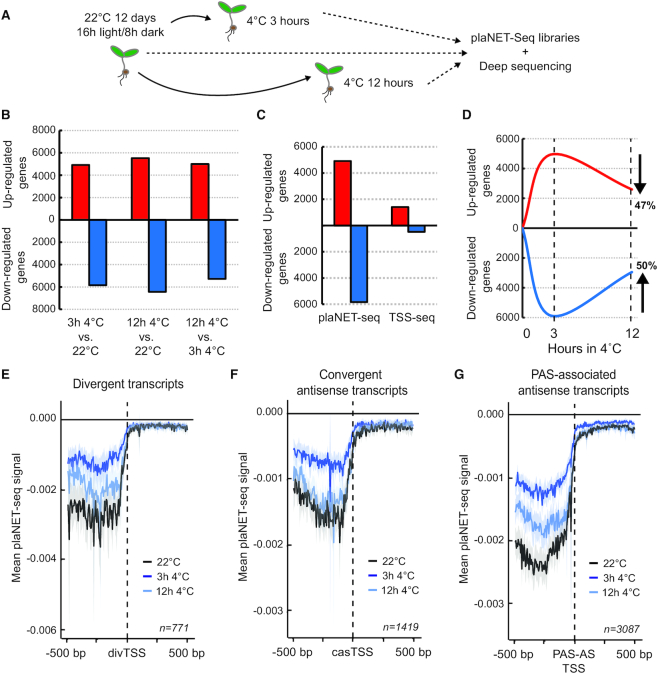
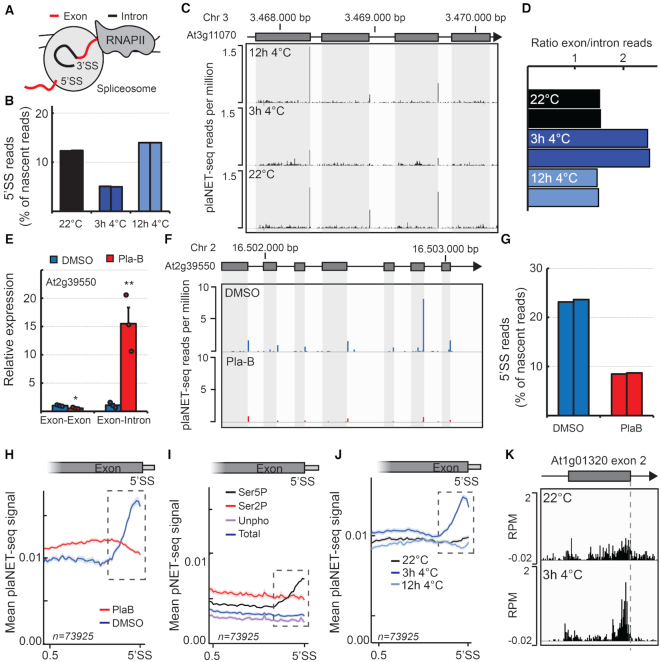
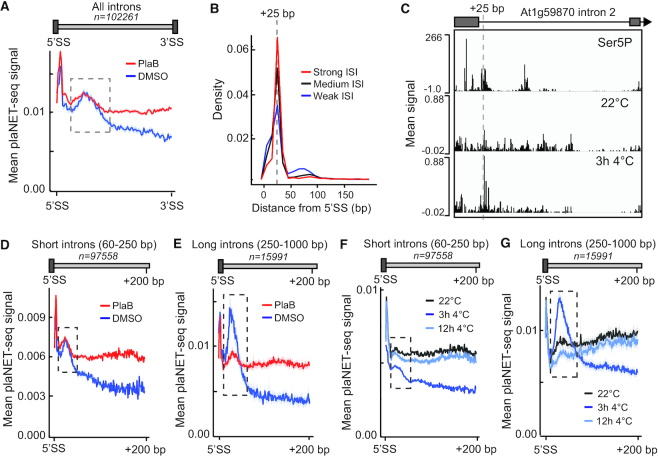
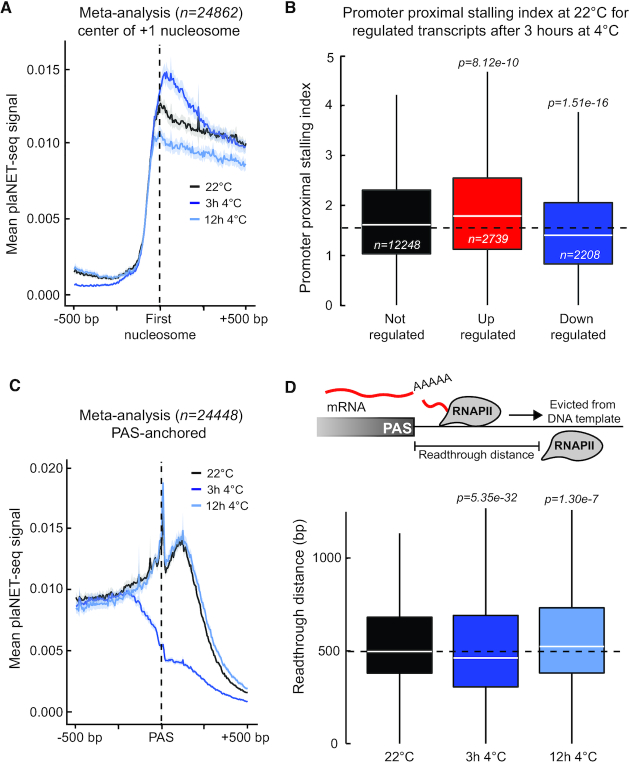
Temperature profoundly affects the kinetics of biochemical reactions, yet how large molecular complexes such as the transcription machinery accommodate changing temperatures to maintain cellular function is poorly understood. Here, we developed plant native elongating transcripts sequencing (plaNET-seq) to profile genome-wide nascent RNA polymerase II (RNAPII) transcription during the cold-response of Arabidopsis thaliana with single-nucleotide resolution. Combined with temporal resolution, these data revealed transient genome-wide reprogramming of nascent RNAPII transcription during cold, including characteristics of RNAPII elongation and thousands of non-coding transcripts connected to gene expression. Our results suggest a role for promoter-proximal RNAPII stalling in predisposing genes for transcriptional activation during plant-environment interactions. At gene 3'-ends, cold initially facilitated transcriptional termination by limiting the distance of read-through transcription. Within gene bodies, cold reduced the kinetics of co-transcriptional splicing leading to increased intragenic stalling. Our data resolved multiple distinct mechanisms by which temperature transiently altered the dynamics of nascent RNAPII transcription and associated RNA processing, illustrating potential biotechnological solutions and future focus areas to promote food security in the context of a changing climate.


Figures

Figure 1.
Figure 1.
Genome-wide detection of nascent transcription in response to low temperature with plaNET-seq. (A) Workflow of plaNET-seq. Chromatin from a stable NRPB2-FLAG line is isolated and DNase I treated. After immunoprecipitation and disruption of protein complexes, RNAPII-attached RNA is purified and used for library construction. The base at the 3′-end of the sequenced RNA is the last base added by the RNAPII complex and therefore aligns to the genomic position of transcriptionally engaged RNAPII. (B) An example of plaNET-seq coverage profile for the gene At2g28305. Positions of RNAPII are shown for sense (blue) and antisense (red) strands. For comparison, mock-IP (negative control) plaNET-seq sample, as well as stranded RNA-seq, TSS-seq (transcription start site sequencing) and DR-seq (direct RNA sequencing) tracks are also shown. The DR-seq track reveals sites of mRNA cleavage and polyadenylation (PAS). (C) Definition of novel transcripts detected by plaNET-seq. Divergent transcripts initiate no more than 500 bp upstream of a coding transcript TSS. Upstream transcripts initiate on the sense strand and partly overlap with an annotated transcript. Convergent transcripts initiate from the 5′-half of a coding gene body on the antisense strand. PAS-associated transcripts initiate from the 3′-half or no more than 20% downstream of its length on the antisense strand. Downstream transcripts initiate within a gene on the sense strand and continue beyond the annotated PAS. Distal antisense transcripts overlap with annotated gene on the antisense strand but initiate further downstream than 20% of the gene's length. Finally, if a transcript was not described by any of the above mentioned classes, it was defined as an intergenic transcript. (D) Bar chart of the number of transcripts that fall into the classes described in (A). Known non-coding transcripts in Araport11 are shown in checkered fill and novel transcript identified by plaNET-seq without fill.
Figure 2.
Figure 2.
Divergent transcription occurs at highly active NDRs. (A) Schematic illustration of a divergent promoter. The nucleosomes surrounding the shared NDR are defined as –1 (DNC direction) and +1 (coding direction). (B) Histogram and kernel density of the absolute distance between start site for the divergent transcript (divTSS) and the coding TSS (bp). (C) An example of a divergent promoter (At3g28140). Nascent RNAPII transcription is shown for sense and divergent transcripts in blue and purple, respectively. (D) Box plot of transcription level of protein-coding genes with a DNC (purple) and without a DNC (gray) as measured by plaNET-seq. Statistical significance of differences was assessed by two-sided Mann–Whitney U test. (E) Metagene analysis of TSS-seq signal on the antisense strand of DNC promoters. Wild type signal is shown in black and the nuclear exosome mutant hen2–2 in red. DNC could be detected with TSS-seq data and DNC were targeted by the nuclear exosome. The shaded area shows 95% confidence interval for the mean.
Figure 3.
Figure 3.
Convergent antisense transcription is a common feature in Arabidopsis. (A) Histogram of the relative distance between initiation sites of antisense transcripts and the sense TSS (expressed as fraction of the sense gene length). Antisense transcription was defined either as convergent (if initiated within the first 50% of the sense gene length: red bars), or as PAS-associated (if initiated within the second 50% of the sense gene length or after the PAS up to a distance of 20% of the gene length after the gene end). (B) An example of a convergent transcript (At2g46710). Nascent RNAPII transcription is shown for sense and convergent transcripts in blue and red, respectively. (C) Histogram of the relative positions of casTSS between the first and the second 5′ splice sites (5′SS). (D) Box plot of transcription level of coding transcripts with a CAS and without a CAS. Statistical significance of the difference was measured by two-sided Mann–Whitney U test. Genes with a CAS showed higher transcription in the sense direction compared to those without a CAS. (E) Metagene analysis of TSS-seq signal on the antisense strand in 1 kb windows anchored at the casTSS. Wild type signal is shown in black and the nuclear exosome mutant hen2–2 in red. At least some CAS could be detected with TSS-seq data, and they are targeted by the nuclear exosome. The shaded area shows 95% confidence interval for the mean.
Figure 4.
Figure 4.
Low temperature leads to re-programming of nascent RNAPII transcription. (A) Illustration of the experimental design of low temperature exposure. Seedlings were grown for 12 days under a long day light regime on agar plates. Exposure to low temperature was performed for 3 or 12 h during the light hours and samples were collected and flash frozen in liquid nitrogen. (B) The number of differentially transcribed genes determined by plaNET-seq in response to low temperature treatment. (C) Numbers of up- and down-regulated transcripts after 3 h at 4°C (compared to the control grown at 22°C) as determined by DESeq2 using plaNET-seq and TSS-seq data. The transcriptional changes detected by plaNET-seq exceeded those detected with the same cutoff values by TSS-seq. (D) Schematic time course of how many genes which were found differentially transcribed after 3 h at 4°C have returned to the baseline expression at 12 h at 4°C. (E-G) Metagene analysis of the plaNET-seq signal in a 1 kb window centered at (E) divTSS, (F) casTSS and (G) PAS-AS TSS. 22°C (control sample) is shown in black, 3 h 4°C in blue, 12 h 4°C in light blue. The shaded area shows 95% confidence interval for the mean.
Figure 5.
Figure 5.
The effect of splicing and intragenic RNAPII stalling. (A) Illustration of the RNAPII–spliceosome complex during active transcription. The spliceosome protects the 5′SS and the splicing intermediates are co-purified with transcriptionally engaged RNAPII complex in NET-seq. (B) Bar chart of the percentage of 5′SS intermediates found in the control and low temperature exposed replicates of plaNET-seq. (C) The effect of chilling temperature on 5′SS species for the gene At3g11070. (D) Histogram showing the ratio between plaNET-seq reads mapping to all exons and all introns in the replicates of low temperature treatment. (E) RT-qPCR validation of the plaB treatment efficiency (shown for a splicing event of the At2g39550 mRNA). Bars represent mean ± SEM of three biological replicates (circles). The statistical significance of differences was calculated by two-sided t-test. *P < 0.05, **P < 0.01. (F) PlaNET-seq co-purifies splicing intermediates, predominantly 5′SS species. The effect of the splicing inhibitor plaB is shown for the gene At2g39550. (G) Bar chart of the percentage of 5′SS intermediates found in the plaNET-seq DMSO and plaB replicates. (H) Metagene analysis of nascent RNAPII transcription over the 3′-half of internal exons as determined by plaNET-seq. DMSO is shown in blue and plaB in red. Dashed box indicates stalling site at the 3′-end of exons. The shaded area shows 95% confidence interval for the mean. (I) Metagene analysis of nascent RNAPII transcription over the 3′-half of internal exons as determined by pNET-seq. Data from the Ser5P antibody is shown in black, Ser2P in red, Unphosphorylated in purple and Total RNAPII in blue. Dashed box indicates stalling site at the 3′-end of exons. The shaded area shows 95% confidence interval for the mean. (J) Metagene analysis of nascent RNAPII transcription over the 3′-half of internal exons as determined by plaNET-seq. 22°C (control sample) is shown in black, 3 h 4°C in blue, 12 h 4°C in light blue. Dashed box indicates stalling site at the 3′-end of exons. The shaded area shows 95% confidence interval for the mean. (K) An example of exonic stalling for intron 2 of the gene At1g01320. Exonic stalling is increased after 3 h at 4°C compared to 22°C.
Figure 6.
Figure 6.
Identification of a novel RNAPII stalling site in introns. (A) Metagene analysis of nascent RNAPII transcription in all introns as determined by plaNET-seq. DMSO is shown in blue and plaB in red. Dashed box indicates stalling site at the 3′-end of exons. The shaded area shows 95% confidence interval for the mean. (B) Distribution of the absolute distances between the intronic peak and the 5′SS. Only introns with FPKM-normalized plaNET-seq coverage above 10 are shown. Introns with strong intronic stalling index (ISI ≥ 5.5) are shown in red, medium (3.5 < ISI < 5.5) in black and weak (ISI ≤ 3.5) in blue. (C) An example of the intronic peak shown for intron 2 in the gene At1g59870. (D) Metagene analysis of nascent RNAPII transcription in short introns as determined by plaNET-seq. DMSO is shown in blue and plaB in red. Dashed box indicates stalling site at the 3′-end of exons. The shaded area shows 95% confidence interval for the mean. (E) Metagene analysis of nascent RNAPII transcription in long introns as determined by plaNET-seq. DMSO is shown in blue and plaB in red. Dashed box indicates stalling site at the 3′-end of exons. The shaded area shows 95% confidence interval for the mean. (F) Metagene analysis of nascent RNAPII transcription in short introns as determined by plaNET-seq. 22°C (control sample) is shown in black, 3 h 4°C in blue, 12 h 4°C in light blue. Dashed box indicates stalling site at the 3′-end of exons. The shaded area shows 95% confidence interval for the mean. (G) Metagene analysis of nascent RNAPII transcription in long introns as determined by plaNET-seq. 22°C (control sample) is shown in black, 3 h 4°C in blue, 12 h 4°C in light blue. Dashed box indicates stalling site at the 3′-end of exons. The shaded area shows 95% confidence interval for the mean.
Figure 7.
Figure 7.
Low temperature affects RNAPII stalling at gene boundaries. (A) Metagene analysis of the plaNET-seq signal in a 1 kb window anchored at the center of +1 nucleosome. 22°C (control sample) is shown in black, 3 h 4°C in blue, 12 h 4°C in light blue. The shaded area shows 95% confidence interval for the mean. (B) Box plot of promoter–proximal stalling index in control conditions (22°C) of genes which are differentially transcribed at 3 h 4°C. Black denotes transcripts with unchanged expression, red denotes upregulated transcripts and blue denotes downregulated transcripts. Statistical differences were assessed by two-sided Mann–Whitney U test. (C) Metagene analysis of the plaNET-seq signal in a 1 kb window anchored at the PAS. 22°C is shown in black, 3 h 4°C is shown in blue, 12 h 4°C is shown in light blue. The shaded area shows 95% confidence interval for the mean. (D) Upper panel illustrates the definition of read-through distance while lower panel shows a box plot of the read-through distance (bp) in 22°C (black), 3 h 4°C (blue) and 12 h 4°C (light blue) samples. Statistical differences were assessed by two-sided Mann–Whitney U test.

Similar articles

Cited by

References

    1. Markovskaya E.F., Shibaeva T.G.. Low temperature sensors in plants: hypotheses and assumptions. Biol. Bull. 2017; 44:150–158.
    1. Kindgren P., Ard R., Ivanov M., Marquardt S.. Transcriptional read-through of the long non-coding RNA SVALKA governs plant cold acclimation. Nat. Commun. 2018; 9:4561. - PMC - PubMed
    1. Thomashow M.F. PLANT COLD ACCLIMATION: freezing tolerance genes and regulatory mechanisms. Annu. Rev. Plant Physiol. Plant Mol. Biol. 1999; 50:571–599. - PubMed
    1. Mayer A., Landry H.M., Churchman L.S.. Pause & go: from the discovery of RNA polymerase pausing to its functional implications. Curr. Opin. Cell Biol. 2017; 46:72–80. - PMC - PubMed
    1. Adelman K., Lis J.T.. Promoter-proximal pausing of RNA polymerase II: emerging roles in metazoans. Nat. Rev. Genet. 2012; 13:720–731. - PMC - PubMed

Publication types

MeSH terms