. 2020 Feb 28;48(4):1843-1871.
doi: 10.1093/nar/gkz1187.

Unique repression domains of Pumilio utilize deadenylation and decapping factors to accelerate destruction of target mRNAs

Affiliations

Unique repression domains of Pumilio utilize deadenylation and decapping factors to accelerate destruction of target mRNAs

René M Arvola et al. Nucleic Acids Res. .

Abstract

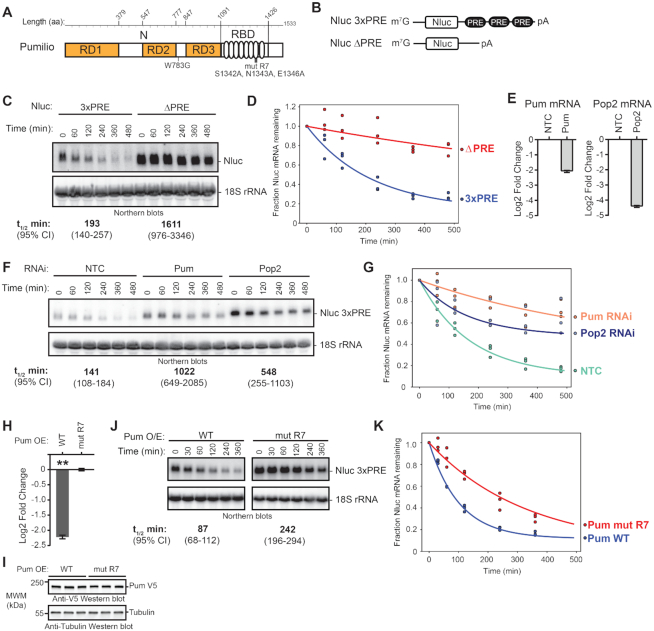
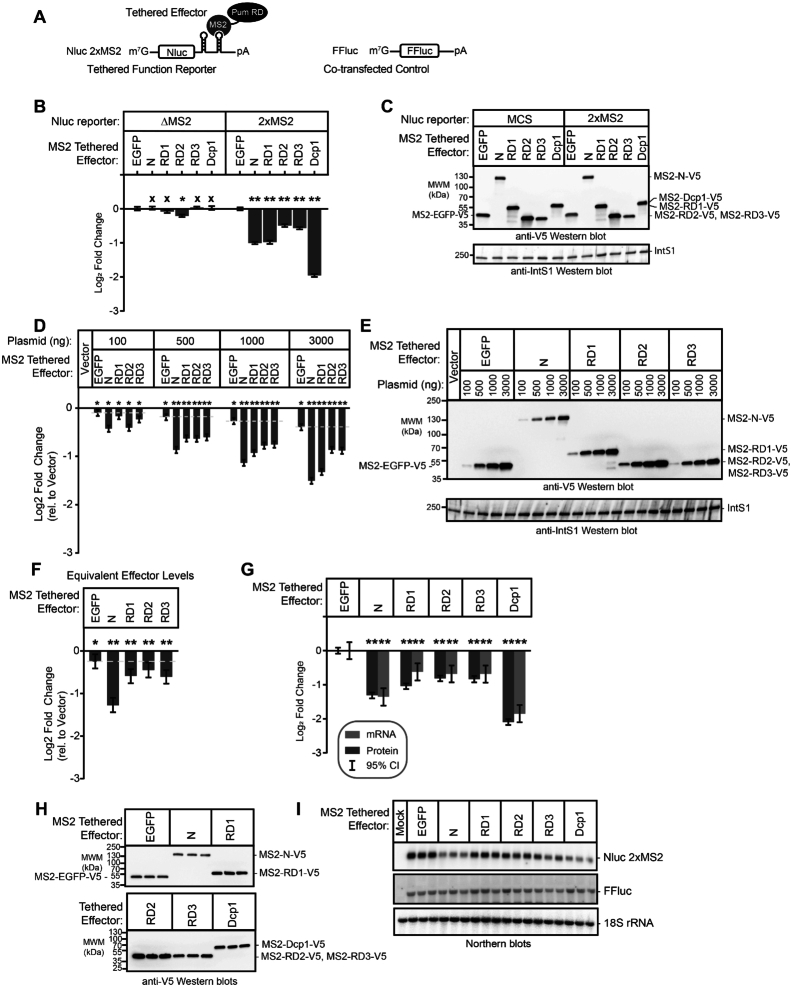
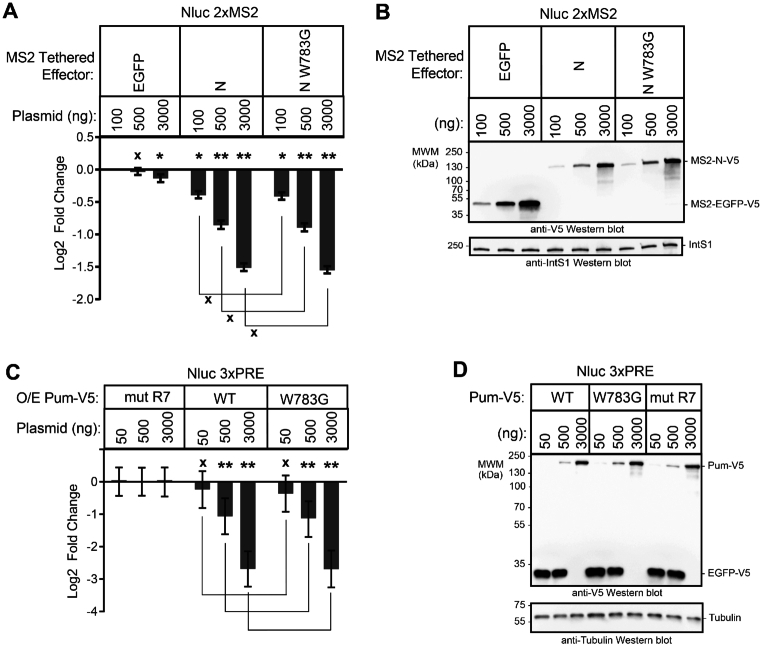
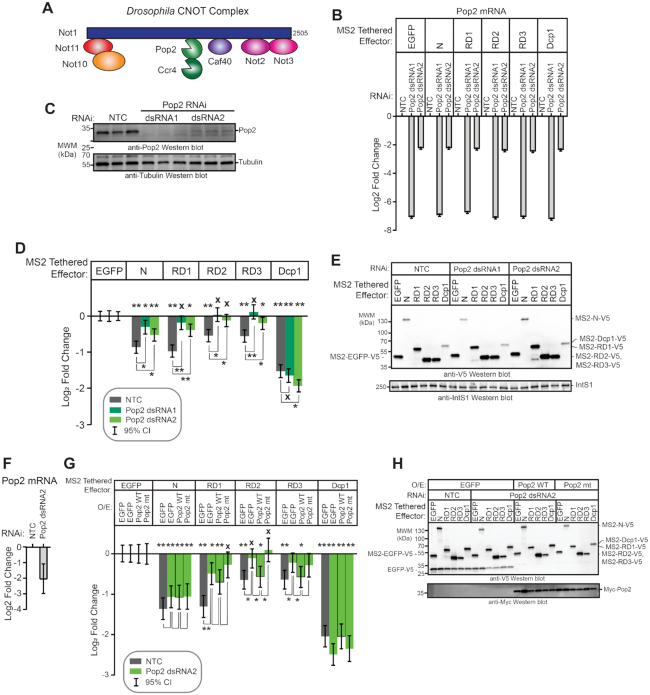
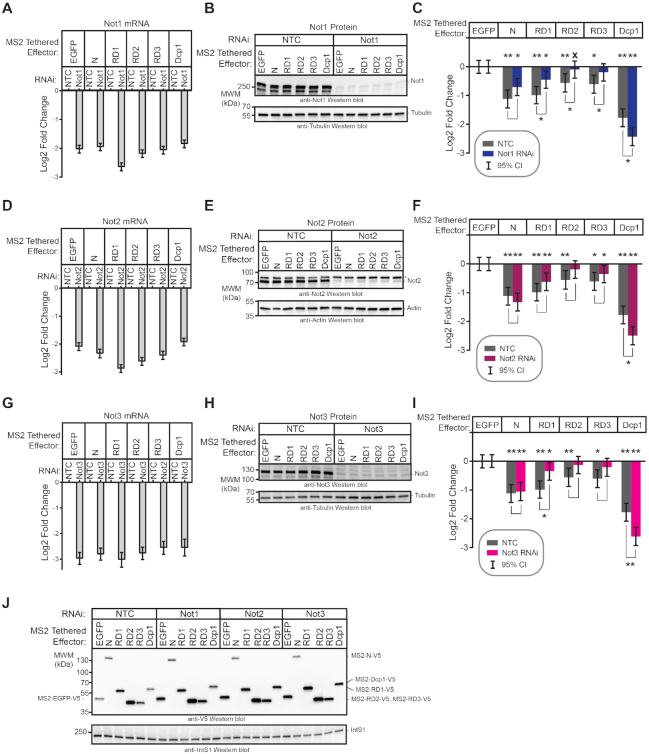
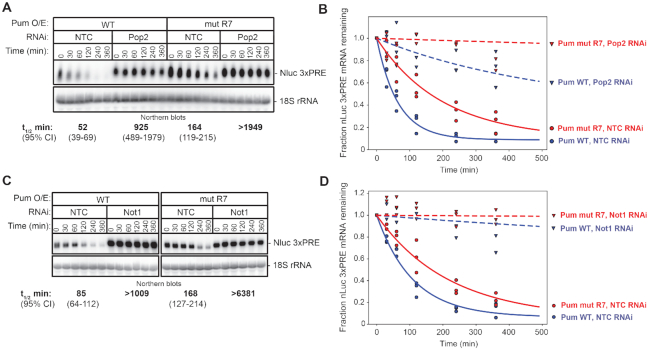
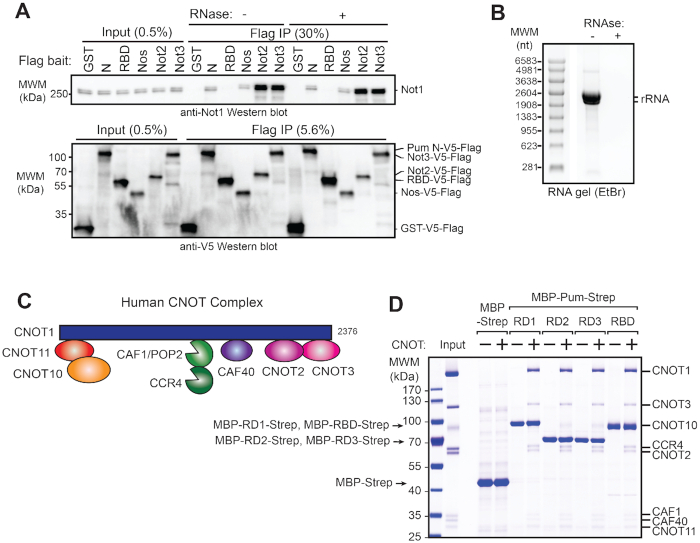
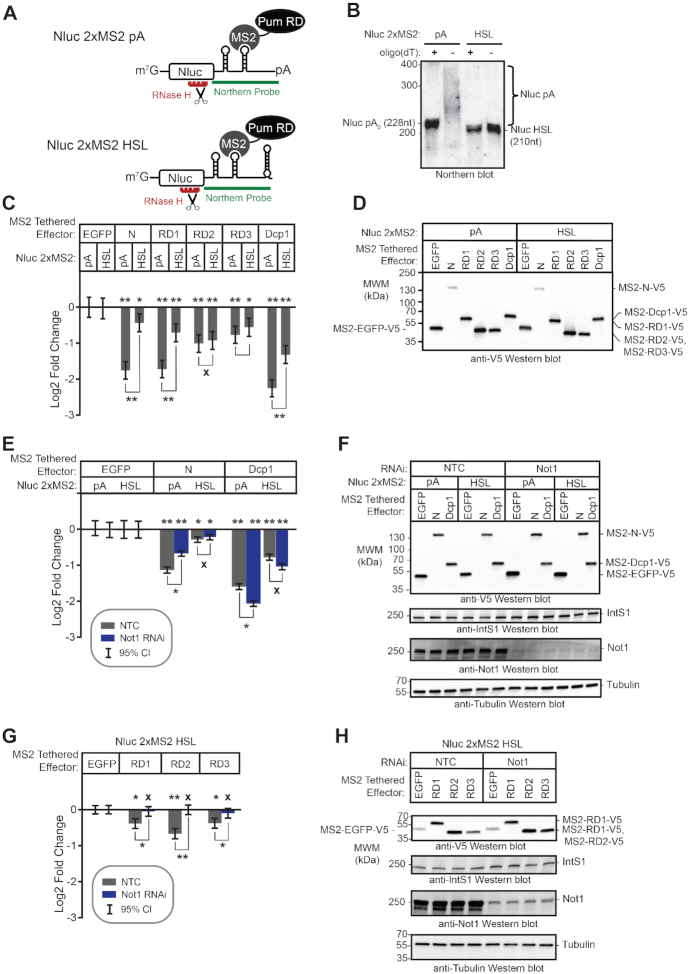
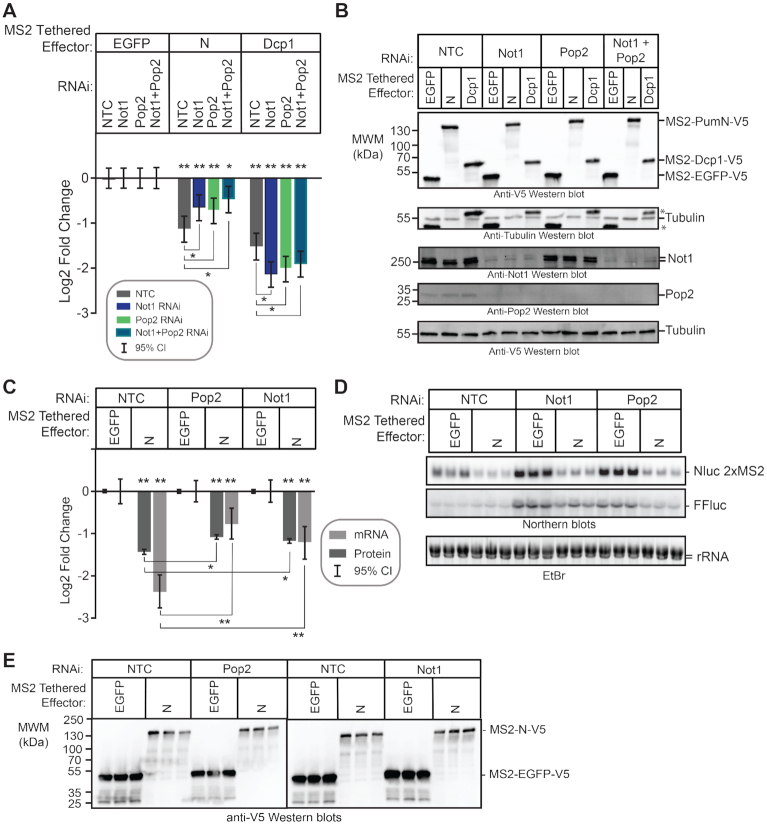
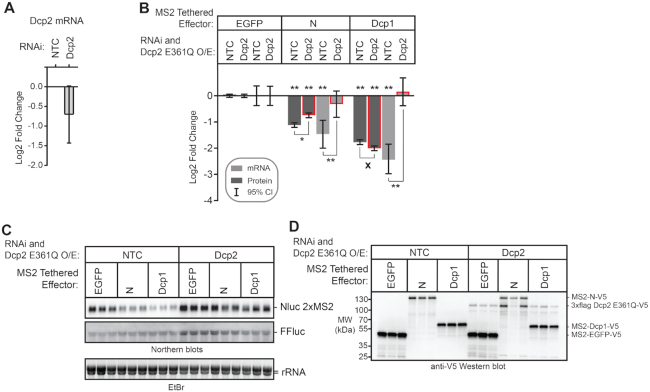
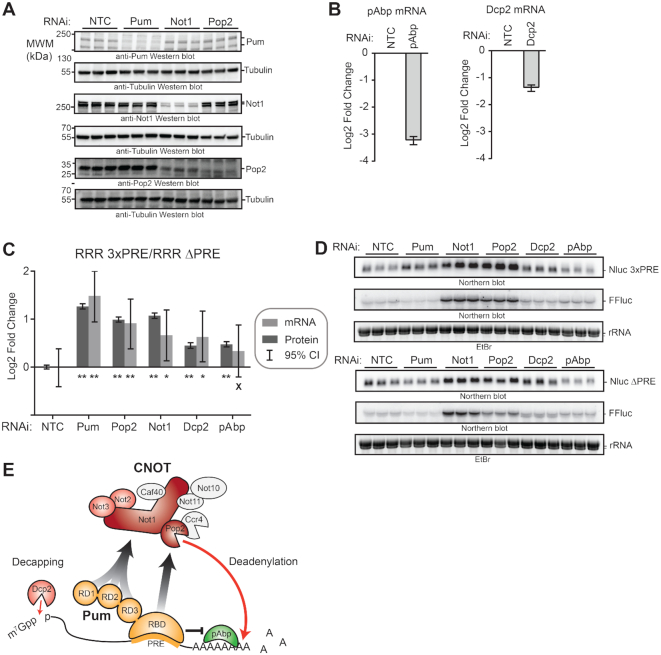
Pumilio is an RNA-binding protein that represses a network of mRNAs to control embryogenesis, stem cell fate, fertility and neurological functions in Drosophila. We sought to identify the mechanism of Pumilio-mediated repression and find that it accelerates degradation of target mRNAs, mediated by three N-terminal Repression Domains (RDs), which are unique to Pumilio orthologs. We show that the repressive activities of the Pumilio RDs depend on specific subunits of the Ccr4-Not (CNOT) deadenylase complex. Depletion of Pop2, Not1, Not2, or Not3 subunits alleviates Pumilio RD-mediated repression of protein expression and mRNA decay, whereas depletion of other CNOT components had little or no effect. Moreover, the catalytic activity of Pop2 deadenylase is important for Pumilio RD activity. Further, we show that the Pumilio RDs directly bind to the CNOT complex. We also report that the decapping enzyme, Dcp2, participates in repression by the N-terminus of Pumilio. These results support a model wherein Pumilio utilizes CNOT deadenylase and decapping complexes to accelerate destruction of target mRNAs. Because the N-terminal RDs are conserved in mammalian Pumilio orthologs, the results of this work broadly enhance our understanding of Pumilio function and roles in diseases including cancer, neurodegeneration and epilepsy.


Figures

Figure 1.
Figure 1.
Pumilio accelerates mRNA degradation. (A) Diagram of Drosophila melanogaster Pumilio (Pum) protein with N-terminal (N) Repression Domains (RD1, RD2 and RD3) and C-terminal RNA-Binding Domain (RBD). Amino acid boundaries are listed at the top. Amino acid substitutions used in this study, including the putative cap-binding amino acid (W783G) and the RNA-binding defective mutant repeat seven (mut R7), are annotated below the diagram. (B) Diagram of nano-luciferase (Nluc) reporter mRNAs containing three Pum Response Elements (3× PRE) sequences in 3′UTR, along with 7-methyl guanosine cap (m7G) and poly(A) tail (pA). An equivalent Nluc reporter lacking the PRE sequences (ΔPRE) was used as a control. Diagram is not to scale. (C) Transcription shut-off with Actinomycin D (ActD) was performed to compare the half-lives of the Nluc 3×PRE and Nluc ΔPRE reporter mRNAs in transiently transfected d.mel2 cells. A representative northern blot of Nluc reporters and the 18S ribosomal rRNA internal control is shown. Each lane of the gel contains 10 μg of total RNA. The measured half-life of each reporter mRNA is shown below the respective blots. Mean values from three experimental replicates are reported with 95% credible intervals. Data and statistics are reported in Supplementary Table S1. (D) The fraction of Nluc mRNA remaining, normalized to internal control 18S rRNA, is plotted relative to time (minutes) after inhibition of transcription. Datum points for each of three experimental replicate are plotted. First order exponential decay trend lines, calculated by non-linear regression analysis, are plotted for each experimental condition (red for Nluc ΔPRE and blue for 3× PRE). (E) RNAi-mediated depletion of Pum or Pop2 mRNAs after 4 days of dsRNA treatment was measured by RT-qPCR. The Pum or Pop2 mRNA level was normalized to internal control Rpl32 mRNA and fold change was calculated relative to the non-targeting control RNAi condition (NTC). The mean log2 fold change of the indicated mRNA level is plotted with 95% credible intervals based on three biological replicates with three technical replicates each. Data and statistics are reported in Supplementary Table S1. (F) Transcription shut-off with ActD was performed using the Nluc 3×PRE reporter mRNA to measure the effect of RNAi depletion of Pum or Pop2 relative to NTC. A representative Northern blot of Nluc 3× PRE reporter and 18S rRNA is shown. Each lane of the gel contains 10 μg of total RNA. Half-lives of the mRNA in the respective conditions, determined from three experimental replicates, are shown below the diagram, along with 95% credible intervals. Data and statistics are reported in Supplementary Table S1. (G) The fraction of Nluc mRNA remaining, normalized to internal control 18S rRNA, is plotted relative to time (minutes), after inhibition of transcription. Datum points for each of three experimental replicates are plotted. First order exponential decay trend lines, calculated by non-linear regression analysis, are plotted for each experimental condition (orange for RNAi of Pum, blue for RNAi of Pop2 and green for negative control RNAi, NTC). (H) Repression of Nluc 3×PRE reporter activity by wild type (WT) over-expressed (OE) Pum in transiently transfected d.mel2 cells was measured by dual luciferase assay. Nluc activity was normalized to Firefly luciferase expression from a co-transfected plasmid in each sample. Mean log2 fold change in normalized Nluc 3×PRE activity by WT Pum is plotted relative to the RNA-binding defective mutant Pum (mut R7) along with 95% credible intervals, as determined from four technical replicate measurements from three biological replicate samples. Data and statistics are reported in Supplementary Table S1. For significance calling, the ‘**' indicates a posterior probability of >0.95 that the indicated difference is at least 1.3-fold. (I) Western blot detection of over-expressed, V5 epitope-tagged WT or mut R7 Pum in three biological replicate samples each. Each lane contains an equivalent mass of cell extract, as measured by Lowry assay. Western blot of Tubulin served as a control for equivalent loading of the samples. (J) Transcription shut-off with ActD was performed to measure half-life of Nluc 3× PRE reporter in response to over-expressed wild type Pum or mut R7. Northern blots of Nluc 3× PRE reporter and 18S rRNA from a representative experiment are shown and half-lives and 95% credible intervals from 3 biological replicates are reported at the bottom. Each lane of the gel contains 10 μg of total RNA. Data and statistics are reported in Supplementary Table S1. (K) The fraction of Nluc mRNA remaining, normalized to internal control 18S rRNA, is plotted relative to time (minutes) after inhibition of transcription. Datum points for each of three biological replicates are plotted. First order exponential decay trend lines, calculated by non-linear regression analysis, are plotted for each experimental condition (red for Pum mut R7, blue for Pum WT).
Figure 2.
Figure 2.
The Pumilio N-terminal Repression Domains repress mRNA and protein expression. (A) Diagram of tethered function nano-luciferase reporter mRNA (Nluc 2×MS2) and co-transfected control, figure Firefly luciferase (FFluc). Nluc 2×MS2 bears two copies of the MS2 stem loop RNA structure in its 3′UTR, which is bound by the sequence-specific MS2 RNA-binding protein. By expressing Pum or other effectors as a fusion to MS2 RNA-binding protein, the impact of the effector on reporter protein and mRNA levels can be measured. Diagram is not to scale. (B) The repression activity of Pum N-terminus and individual repression domains (RD1, RD2, RD3) was measured using the tethered function dual luciferase assay using the Nluc 2× MS2 reporter or an equivalent reporter wherein the MS2 binding sites are deleted, Nluc ΔMS2. Mean log2 fold change values in normalized reporter activity, measured relative to the negative control, MS2-EGFP, are plotted with 95% credible intervals, from three experiments with four technical replicates each. Tethered decapping enzyme subunit, Dcp1, serves as a positive control that strongly represses the reporter when tethered. Data and statistics are reported in Supplementary Table S1. Comparison of the activity of each Pum effector on the Nluc 2× MS2 reporter relative to Nluc ΔMS2 is shown in Supplementary Figure S1A. For significance calling, a ‘*’ denotes a posterior probability >0.95 that the difference relative to the negative control is in the indicated direction. The ‘**' indicates a posterior probability of >0.95 that the indicated difference is at least 1.3-fold. An ‘x’ marks a posterior probability >0.95 that the indicated difference is no more than 1.3-fold in either direction. (C) Western blot of the V5-epitope tagged MS2 fusion effector proteins used in panel B from a representative experimental replicate. Equivalent mass of protein from each sample was probed with anti-V5 antibody, followed by the Integrator Subunit 1 protein (IntS1) to assess equal loading of lanes. (D) The relationship of repression activity to level of each MS2 tethered effector was measured using the tethered function assay by titrating the amount of transfected effector expression plasmid, as indicated at the top. Total mass of transfected plasmid was maintained across all conditions by supplementing with empty expression plasmid vector, pIZ. In this experiment, repression of reporter activity was calculated relative to the control condition containing only the empty expression vector. Data from three experiments with four technical replicates each, are plotted along with 95% credible intervals. The yellow dashed line marks the repression activity of the negative control effector, MS2-EGFP, for each amount of transfected effector plasmid (relative to the vector-only control). The relationship of effector protein level, measured by quantitative western blot, and repression activity is reported in Supplementary Figure S1B. Data and statistics are reported in Supplementary Table S1. (E) Western blot of the V5-epitope tagged MS2 fusion effector proteins used in panel D from a representative experimental replicate. Equivalent mass of protein from each sample was probed with anti-V5 antibody, followed by IntS1 as a loading control. (F) The repression activity for equivalent expression level of each MS2 tethered effector protein, determined by tethered function assays and quantitative western blotting as shown in Supplementary Figure S1B. Fold change was calculated relative to empty vector. Mean log2-fold change values are plotted with 95% credible intervals from three experiments with four technical replicates each. The yellow dashed line marks the repressive activity of the negative control effector, MS2-EGFP. Data and statistics are reported in Supplementary Table S1. (G) The effect of each MS2 fusion effector protein on Nluc 2× MS2 reporter protein and mRNA level was determined by dual luciferase assay (reporter protein, dark gray bars) and Northern blotting (reporter mRNA, light gray bars). Log2 fold change of Nluc 2× MS2 levels, normalized to internal control FFluc, for each effector were calculated relative to negative control MS2-EGFP for three biological replicates. Mean log2 fold change and 95% credible intervals are reported in the graph. Data and statistics are reported in Supplementary Table S1. (H) Expression of V5-tagged MS2 fusion effector proteins from three biological replicates (panel G) was confirmed by western blotting of an equal mass of protein cell extract for each sample. (I) Northern blot detection of tethered function reporter Nluc 2× MS2, internal control FFluc, and loading control 18S rRNA for three biological replicate samples for each tethered effector protein. Each lane of the gel contains 5 μg of total RNA. This data was used to determine fold change in reporter mRNA level shown in panel G. The Mock sample contained total cellular RNA from untransfected cells and demonstrates specificity of the reporter probes.
Figure 3.
Figure 3.
The putative Pumilio cap-binding motif is not required for repression. (A) Repression activity was measured for three amounts of transiently transfected wild type or cap-binding mutant (W873G) Pum N-terminus via the tethered function dual luciferase assay using the Nluc 2× MS2 pA reporter. Repression activity was calculated relative to the MS2-EGFP negative control at the lowest transfected amount (100 ng). Empty expression vector, pIZ, was used to balance the total mass of transfected plasmids in samples with 100 and 500 ng of MS2 effector plasmid. Mean log2 fold change and 95% credible intervals for three experimental replicates with four technical replicates each are reported in the graph. Data and statistics are reported in Supplementary Table S1. For significance calling, a ‘*’ denotes a posterior probability >0.95 that the difference relative to the negative control is in the indicated direction. The ‘**' indicates a posterior probability of >0.95 that the indicated difference is at least 1.3-fold. An ‘x’ marks a posterior probability >0.95 that the indicated difference is no more than 1.3-fold in either direction. (B) Western blot of the V5-epitope tagged MS2 fusion effector proteins used in panel A from a representative experimental replicate. Equivalent mass of protein from each sample was probed with either anti-V5 antibody or anti-IntS1 as a loading control. (C) Repression activity was measured for three amounts of transfected wild type or cap-binding mutant (W873G) full length Pum via dual luciferase assay using the Nluc 3× PRE pA reporter. The fold change values were calculated relative to the equivalent amount of transfected RNA-binding defective mutant Pum (mut R7) negative control. V5-tagged EGFP plasmid served to balance the total mass of transfected plasmids in samples with 50 and 500 ng of Pum effector plasmid. Mean log2 fold change and 95% credible intervals for three experimental replicates with four technical replicates each are reported in the graph. Data and statistics are reported in Supplementary Table S1. (D) Western blot of the V5-epitope tagged Pum effector and EGFP balancer proteins used in panel C from a representative experimental replicate. Equivalent mass of protein from each sample was probed with anti-V5 antibody and, to assess equal loading of lanes, anti-tubulin antibody.
Figure 4.
Figure 4.
The Pop2 deadenylase is required for Pum RD activity. (A) Diagram of the Drosophila melanogaster Ccr4–Not complex, containing eight subunits. Adapted from Temme et al. (74). (B) The efficiency of Pop2 mRNA depletion after 3 days of treatment with either of two double stranded RNAs (dsRNA1 and dsRNA2) was measured using RT-qPCR. The dsRNA1 targets the Pop2 coding sequence, whereas dsRNA2 targets the Pop2 mRNA 5′UTR. Fold changes were calculated relative to non-targeting control RNAi (NTC) for the indicated experimental conditions. Mean log2 fold change and 95% credible intervals for a representative experimental replicate with three technical replicates for each measurement are reported in the graph. Data and statistics are reported in Supplementary Table S1. (C) Western blot confirming RNAi-mediated depletion of Pop2 deadenylase induced by treatment of d.mel-2 cells (three biological replicates) with two different double-stranded RNAs in comparison to non-targeting control dsRNA (NTC). Equivalent mass of cellular extract was loaded for each sample. Anti-tubulin western blot serves as a loading control. (D) The effect of Pop2 depletion on repression by Pum N-terminus and individual RDs was measured via tethered function dual luciferase assay. Repression by each effector was calculated relative to the corresponding negative control effector MS2-EGFP within each RNAi condition. Non-targeting control (NTC) RNAi serves as a negative control for RNAi. Tethered decapping enzyme subunit, Dcp1, serves as a positive control. Mean log2 fold change and 95% credible intervals for three experimental replicates with four technical replicates each are reported in the graph. Data and statistics are reported in Supplementary Table S1. For significance calling, a ‘*’ denotes a posterior probability >0.95 that the difference relative to the negative control is in the indicated direction. The ‘**’ indicates a posterior probability of >0.95 that the indicated difference is at least 1.3-fold. An ‘x’ marks a posterior probability >0.95 that the indicated difference is no more than 1.3-fold in either direction. (E) Western blot of the V5-epitope tagged MS2 fusion effector proteins used in panel D from a representative experimental replicate. Equivalent mass of protein from each sample was probed with anti-V5 antibody, followed by western blot of IntS1 as a loading control. (F) The efficiency of Pop2 mRNA depletion after 5 days of Pop2 dsRNA2 treatment was measured using RT-qPCR. Fold changes were calculated relative to non-targeting control (NTC). Mean log2 fold change and 95% credible intervals for three biological replicates with three technical replicates each are reported in the graph. Data and statistics are reported in Supplementary Table S1. (G) The ability of wild type Pop2 (WT) or active site mutant Pop2 (mt) to rescue repression by Pum N-terminus and RDs was measured via tethered function dual luciferase assay. Endogenous Pop2 was depleted by treating cells with dsRNA2. NTC dsRNA serve as a control. The effect of Pop2 expression was compared to EGFP control. Mean log2 fold change and 95% credible intervals from three to six experimental replicates with four technical replicates each are reported in the graph. Data and statistics are reported in Supplementary Table S1. (H) Western blot of V5-tagged tethered effectors and myc-tagged Pop2, mutant Pop2, or negative control V5-tagged EGFP from a representative experimental replicate in panel G. Equivalent mass of cellular extract was loaded for each sample.
Figure 5.
Figure 5.
CNOT components are involved in Pum RD mediated repression. (A) The efficiency of RNAi-mediated depletion of Not1 mRNA after 3 days of dsRNA treatment was measured using RT-qPCR. Fold changes were calculated relative to non-targeting control (NTC). Mean log2 fold change and 95% credible intervals are reported in the graph for one representative experiment with three technical replicates of each measurement. Data and statistics are reported in Supplementary Table S1. (B) Western blot with anti-Not1 antibody confirms depletion of endogenous Not1 protein from a representative experiment. Equivalent mass of cellular extract was loaded for each sample. Anti-tubulin western blot serves as a loading control. (C) Tethered function dual luciferase assays measured the effect of Not1 depletion on the repression activity of Pum N-terminus and RDs. Non-targeting control (NTC) serves as negative control for comparison. Activity of each effector was determined relative to the corresponding negative control effector MS2-EGFP within each RNAi condition. Mean log2 fold change and 95% credible intervals are reported in the graph for three experimental replicates with four technical replicates each. Data and statistics are reported in Supplementary Table S1. For significance calling, a ‘*’ denotes a posterior probability >0.95 that the difference relative to the negative control is in the indicated direction. The ‘**' indicates a posterior probability of >0.95 that the indicated difference is at least 1.3-fold. An ‘x’ marks a posterior probability >0.95 that the indicated difference is no more than 1.3-fold in either direction. (D) The efficiency of Not2 mRNA depletion after 3 days of dsRNA treatment was measured using RT-qPCR. Fold changes were calculated relative to non-targeting control (NTC). Mean log2 fold change and 95% credible intervals are reported in the graph for one representative experiment with three technical replicates of each measurement. Data and statistics are reported in Supplementary Table S1. (E) Western blot confirms RNAi-mediated depletion of endogenous Not2 from a representative experiment using an anti-Not2 antibody. Equivalent mass of cellular extract was loaded for each sample. Anti-actin western blot serves as a loading control. The * designates a protein that cross-reacts with the Not2 antibody. (F) Tethered function dual luciferase assays measured the effect of Not2 depletion on the repression activity of Pum N-terminus and RDs. Non-targeting control (NTC) serves as negative control for comparison. Activity of each effector was determined relative to the corresponding negative control effector MS2-EGFP within each RNAi condition. Mean log2 fold change and 95% credible intervals are reported in the graph for three experimental replicates with four technical replicates each. Data and statistics are reported in Supplementary Table S1. (G) The efficiency of Not3 mRNA depletion after 3 days of dsRNA treatment was measured using RT-qPCR. Fold changes were calculated relative to non-targeting control (NTC). Mean log2 fold change and 95% credible intervals are reported in the graph for one representative experiment with three technical replicates of each measurement. Data and statistics are reported in Supplementary Table S1. (H) Western blot confirms RNAi depletion of endogenous Not3 protein from a representative experiment using an anti-Not3 antibody. Equivalent mass of cellular extract was loaded for each sample. Anti-tubulin western blot serves as a loading control. (I) Tethered function assays measured the effect of Not3 depletion on the repression activity of Pum N-terminus and RDs. Non-targeting control (NTC) serves as negative control for comparison. Activity of each effector was determined relative to the corresponding negative control effecto MS2-EGFP within each RNAi condition. Mean log2 fold change and 95% credible intervals are reported in the graph. Data and statistics are reported in Supplementary Table S1. (J) Western blot of the V5-epitope tagged MS2 fusion effector proteins used in panels C, F and I from a representative experiment. Equivalent mass of protein from each sample was probed with anti-V5 antibody and IntS1 loading control.
Figure 6.
Figure 6.
Pum-mediated mRNA decay requires Not1 and Pop2. (A) The effect of RNAi-mediated depletion of Pop2 by Pop2 dsRNA1 on the mRNA decay rate of Nluc 3× PRE reporter mRNA was measured in response to over-expressed wild type Pum (Pum WT) or the RNA-binding defective mutant Pum (Pum mut R7) following inhibition of transcription with ActD. Cells treated with NTC dsRNA served as negative control. The Nluc 3× PRE was detected by Northern blot along with 18S ribosomal RNA (rRNA), as a loading control. Each lane of the gel contains 10 μg of total RNA. The mRNA half-lives and 95% credible intervals measured in each condition are shown below the respective blots, and were calculated from three experimental replicates. Data and statistics are reported in Supplementary Table S1. (B) The fraction of Nluc 3× PRE mRNA remaining, normalized to 18S rRNA, is plotted relative to time (minutes) after inhibition of transcription. Datum points for each of three experimental replicates are plotted. First order exponential decay trend lines, calculated using non-linear regression analysis, are plotted for each effector (Pum WT in blue, and mut R7 in red) in each RNAi condition (NTC, solid lines, and Pop2, dashed lines). (C) The effect of RNAi-mediated depletion of Not1 on the mRNA decay rate of Nluc 3× PRE reporter mRNA was measured in response to over-expressed wild type Pum (Pum WT) or the RNA-binding defective mutant Pum (Pum mut R7) following inhibition of transcription with ActD. Cells treated with NTC dsRNA served as negative control. The Nluc 3× PRE was detected by Northern blot along with 18S ribosomal RNA (rRNA), as a loading control. Each lane of the gel contains 10 μg of total RNA. The mRNA half-lives and 95% credible intervals measured in each condition are shown below the respective blots, and were calculated from three experimental replicates. Data and statistics are reported in Supplementary Table S1. (D) The fraction of Nluc 3× PRE mRNA remaining, normalized to 18S rRNA, is plotted relative to time (minutes) after inhibition of transcription. Datum points for each of 3 experimental replicates are plotted. First order exponential decay trend lines, calculated using non-linear regression analysis, are plotted for each effector (Pum WT in blue and mut R7 in red) in each RNAi condition (NTC, solid lines and Not1, dashed lines).
Figure 7.
Figure 7.
Pumilio N-terminal Repression Domains bind to the CNOT complex. (A) Not1 protein co-immunoprecipitates with the Pum N-terminus from d.mel2 cell extracts. Western blot detection of endogenous Not1 protein and Flag- and V5-tagged Pum N-terminus (N) or RNA-binding domain (RBD) in cellular extracts (Input) and anti-Flag immunoprecipitates (Flag IP) from samples treated with (+) or without (−) RNase One treatment of the cellular extracts. Flag-V5-tagged GST serves as negative control. Positive controls for Not1 interaction include Flag-V5-tagged Nanos (Nos) and core CNOT subunits Not2 and Not3. The relative percent of total Input and Flag IP for each sample is indicated above lanes. (B) Confirmation of RNA digestion by RNase One in co-immunoprecipitation experiment in panel A. Total RNA purified from the cellular extract treated with (+) or without (−) RNase One was analyzed on denaturing formaldehyde agarose gel and visualized with ethidium bromide. Ribosomal RNA is indicated in the sample without RNase treatment. Note that Drosophila 28S rRNA (3945 nt) is internally processed to two fragments (∼1787 nt and ∼2112 nt) whereas the 18S rRNA is ∼1995 nt (115,116). (C) Diagram of the human Ccr4–Not complex containing eight subunits. Note that the subunits are orthologous—compare Figures 4A and 7C—though the nomenclature differs between human and Drosophila as described in Temme et al. (74). (D) Pum RDs and RBD bind to the intact human CNOT complex. In vitro protein interaction ‘pulldown’ assays were performed using recombinant, purified, streptactin bead-bound Pum domains (indicated at the top) that were fused to maltose binding protein (MBP) and the StrepII affinity tag (Strep). Bead-bound MBP-Strep serve as a negative control. Human CNOT complex (Input), purified as described by Raisch et al. (57), was incubated with the bead bound bait proteins. After extensive washing, bead bound proteins were analyzed by Coomassie blue-stained SDS-PAGE. A representative experiment of three experimental replicates is shown.
Figure 8.
Figure 8.
The poly(A) tail is necessary for maximal activity of the Pum N-terminus. (A) Diagram of the Nluc 2×MS2 reporters with either 3′ poly(A) tail or the Histone Stem Loop (HSL) used for tethered function assays. The reporters are identical except that the cleavage/poly-adenylation element was replaced with a Histone Stem Loop and Histone Downstream Element (HDE) in the Nluc 2× MS2 HSL reporter, which produces a non-adenylated 3′ end. The location of the probe used for Northern blotting (green) and the DNA oligonucleotide (red) used for RNase H cleavage of the mRNAs for high resolution Northern blotting are indicated. Diagram is not drawn to scale. (B) High resolution Northern blot of the Nluc 2× MS2 pA and HSL reporter mRNAs expressed in d.mel2 cells confirms proper poly-adenylation of the pA reporter and lack of poly-adenylation of the HSL reporter. Where indicated (+), RNA was treated with DNA oligonucleotide of 15 thymidines (dT) and RNase H to degrade the poly(A) tail. RNA size markers are indicated on the left. The lengths of the 3′ end reporter fragments are also indicated. (C) The repression activity of the Pum N-terminus and RDs was measured via tethered function dual luciferase assay, using the Nluc 2×MS2 poly(A) and HSL reporters. The activity of each effector was determined relative to the tethered EGFP negative control effector on the same reporter. Mean log2 fold change and 95% credible intervals are reported in the graph for three experimental replicates with four technical replicates each. Data and statistics are reported in Supplementary Table S1. For significance calling, a ‘*’ denotes a posterior probability >0.95 that the difference relative to the negative control is in the indicated direction. The ‘**’ indicates a posterior probability of >0.95 that the indicated difference is at least 1.3-fold. An ‘x’ marks a posterior probability >0.95 that the indicated difference is no more than 1.3-fold in either direction. (D) Western blot detection of the V5-epitope tagged MS2 fusion effector proteins used in panel C from a representative experimental replicate. Equivalent mass of protein from each sample was probed with anti-V5 antibody. (E) The effect of RNAi-mediated depletion of Not1 on repression activity of the Pum N-terminus was measured via tethered function, using the Nluc 2× MS2 poly(A) and HSL reporters. The non-targeting control (NTC) served as negative control for RNAi. The repression activity of each effector was determined relative to tethered EGFP negative control in the same RNAi condition. The mean log2 fold change and 95% credible intervals are graphed for three experimental replicates with four technical replicates each. Data and statistics are reported in Supplementary Table S1. (F) Western blot of the V5-epitope tagged MS2 fusion effector proteins from a representative experimental replicate from panel E. Equivalent mass of protein from each sample was probed with anti-V5 antibody or anti-IntS1 to assess equal loading of lanes. The depletion of Not1 protein was assessed using an anti-Not1 antibody, with anti-tubulin western blot serving as the loading control. (G) The effect of RNAi depletion on the repression activity of the Pum RDs was measured via tethered function dual luciferase assay, using the Nluc 2× MS2 HSL reporter. Non-targeting control (NTC) serves as negative control for comparison. Activity of each effector was determined relative to tethered EGFP negative control in the same RNAi condition. The mean log2 fold change and 95% credible intervals are reported in the graph for three experimental replicates with four technical replicates each. Data and statistics are reported in Supplementary Table S1. (H) Western blot of the V5-epitope tagged MS2 fusion effector proteins used in from a representative experimental replicate from pane G. An equivalent mass of protein from each sample was probed with anti-V5 antibody, and then with anti-IntS1 to assess equal loading of lanes. Depletion of the Not1 protein was assessed using an anti-Not1 antibody, with ant-tubulin western blot serving as a loading control.
Figure 9.
Figure 9.
The Pum N-terminus utilizes an additional deadenylation-independent repression activity. (A) The effect of RNAi-mediated depletion of Not1, Pop2 or both simultaneously on the repression activity of the Pum N-terminus was measured in the tethered function reporter assay. The activity of each effector protein was determined relative to the negative control MS2-EGFP within each RNAi condition. Tethered Dcp1 served as a control. The mean log2 fold change and 95% credible intervals are graphed for three experimental replicates with four technical replicates each. Data and statistics are reported in Supplementary Table S1. For significance calling, a ‘*’ denotes a posterior probability >0.95 that the difference relative to the negative control is in the indicated direction. The ‘**' indicates a posterior probability of >0.95 that the indicated difference is at least 1.3-fold. An ‘x’ marks a posterior probability >0.95 that the indicated difference is no more than 1.3-fold in either direction. (B) Western blot of the V5-epitope tagged MS2 fusion effector proteins used in panel A from a representative experimental replicate. Equivalent mass of protein from each sample was probed with anti-V5 antibody, and then with anti-tubulin to assess equal loading of lanes (Asterisks indicate residual anti-V5 signal on the blot). Depletion of Not1 and Pop2 proteins was assessed by Western blot detection of the endogenous proteins. Anti-tubulin Western blot served as a loading control. Note that Not1 depletion also reduces Pop2 protein level, as discussed in the text. (C) The effect of depletion of Pop2 or Not1 on repression activity of Pum N-terminus was measured using the tethered function dual luciferase assay and Northern blotting. Repression of reporter protein and mRNA levels by tethered Pum N-terminus was calculated relative to the negative control MS2-EGFP within the same RNAi condition. Tethered Dcp1 served as a positive control. Mean log2 fold change and 95% credible intervals from three biological replicates are reported in the graph. Data and statistics are reported in Supplementary Table S1. (D) Northern blot detection of Nluc 2× MS2 reporter and internal control FFluc mRNAs in the three biological replicates for each effector and RNAi condition. Each lane of the gel contains 5 μg of total RNA. Quantitation of this blot is represented in panel C. Ethidium Bromide detection of rRNA was used to assess integrity and equivalent loading of the RNA samples. (E) Western blot of the V5-tagged MS2 fusion effector proteins used in panel C from three biological replicates. Equivalent mass of protein from each sample was probed with anti-V5 antibody.
Figure 10.
Figure 10.
Decapping enzyme participates in repression by the Pum N-terminus. (A) RNAi-mediated depletion of the Dcp2 mRNA after 5 days of dsRNA treatment was measured using RT-qPCR. Fold changes were calculated relative to non-targeting control (NTC). Mean log2 fold change and 95% credible intervals for three biological replicates with three technical replicates each are reported in the graph. Data and statistics are reported in Supplementary Table S1. (B) The effect of inhibition of decapping on repression of Nluc 2× MS2 reporter protein and mRNA levels by the Pum N-terminus was measured using the tethered function dual luciferase assay. Decapping was inhibited by RNAi mediated depletion of Dcp2 and over-expression of the dominant negative mutant Dcp2 E361Q. Repression activity was calculated relative to tethered EGFP negative control within the same RNAi condition. Tethered Dcp1 served as a positive control. Mean log2 fold change and 95% credible intervals are graphed from three biological replicates. Data and statistics are reported in Supplementary Table S1. For significance calling, a ‘*’ denotes a posterior probability >0.95 that the difference relative to the negative control is in the indicated direction. The ‘**' indicates a posterior probability of >0.95 that the indicated difference is at least 1.3-fold. An ‘x’ marks a posterior probability >0.95 that the indicated difference is no more than 1.3-fold in either direction. (C) Northern blot detection of Nluc 2× MS2 reporter and FFluc internal control in three biological replicate samples for tethered effectors analyzed in panel A. Each lane of the gel contains 5 μg of total RNA. Ethidium Bromide detection of rRNA was used to assess integrity and equivalent loading of the RNA samples. (D) Western blot of the V5-epitope tagged MS2 fusion effector proteins and Dcp2 E361Q used in panel B from three biological replicates. Equivalent mass of protein from each sample was probed with anti-V5 antibody.
Figure 11.
Figure 11.
Multiple mechanisms and co-repressors contribute to Pumilio-mediated repression. (A) RNAi-mediated depletion of endogenous Pum, Not1, and Pop2 proteins was assessed by Western blot of three biological replicate samples each from d.mel2 cells that were treated with the indicated dsRNA for three days. Note that Pum and Not1 antibodies each recognize two isoforms of their respective proteins. Equivalent mass of protein was analyzed for each sample, and anti-tubulin western blots were performed as a loading control. (B) RNAi-mediated depletion of pAbp mRNA (left) and Dcp2 mRNA (right) were measured using RT-qPCR. Fold changes were calculated relative to non-targeting control (NTC). Mean log2 fold change and 95% credible intervals for three biological replicates are reported in the graph. Data and statistics are reported in Supplementary Table S1. (C) The effect of RNAi depletion of Pum co-repressors Not1, Pop2, Dcp2 and pAbp on repression of Nluc 3× PRE reporter protein and mRNA expression levels by endogenous Pum was measured in d.mel-2 cells. Data was analyzed by calculating the Relative Response Ratio for each sample by dividing the Nluc signal by corresponding FFluc signal, thereby normalizing variation in transfection efficiency. Next, the PRE-dependent effect of each RNAi condition on the Pum repressed, PRE containing reporter was normalized to the effect on the unregulated Nluc ΔPRE reporter, which contains a minimal 3′UTR that lacks Pum binding sites. The fold change in PRE-mediated regulation within each RNAi condition was then calculated relative to the negative control NTC dsRNA. RNAi of Pum served as a positive control. Mean log2 fold change and 95% credible intervals for three biological replicates are reported in the graphs. Data and statistics are reported in Supplementary Table S1. For significance calling, a ‘*’ denotes a posterior probability >0.95 that the difference relative to the negative control is in the indicated direction. The ‘**’ indicates a posterior probability of >0.95 that the indicated difference is at least 1.3-fold. An ‘x’ marks a posterior probability >0.95 that the indicated difference is no more than 1.3-fold in either direction. (D) Northern blot detection of Pum-regulated Nluc 3×PRE, unregulated Nluc ΔPRE reporter mRNA and FFluc internal control mRNAs in three biological replicate samples for each RNAi condition analyzed in panels C and D. Each lane of the gel contains 5 μg of total RNA. Ethidium bromide detection of rRNA was used to assess integrity and equivalent loading of the RNA samples. (E) Model of Pum-mediated repression. The RNA-binding domain (RBD) of Pum binds to mRNAs that contain a Pum Response Element (PRE). Multiple domains of Pum contribute to repression activity including the N-terminal repression domains (RD1, RD2, and RD3) and C-terminal RBD. Pum represses the target mRNA by multiple mechanisms including acceleration of mRNA decay via recruitment of Ccr4–Pop2–Not (CNOT) deadenylase complex, leading to deadenylation of the 3′ poly-adenosine tail, and via decapping enzyme (Dcp2) mediated removal of the 5′ 7-methyl guanosine cap (7mGppp). Pum RBD also antagonizes the translational activity of poly-adenosine binding protein (pAbp). CNOT subunits that are important for Pum RD-mediated repression are shaded in red. Red arrows indicate enzyme-catalyzed hydrolysis of the RNA. Arrows with gray-black gradient indicate Pum-CNOT interactions, as described in the Discussion. The means by which Dcp2 is modulated by Pum N-terminus remains to be determined.

Similar articles

Cited by

References

    1. Wickens M., Bernstein D.S., Kimble J., Parker R. A PUF family portrait: 3′UTR regulation as a way of life. Trends Genet. 2002; 18:150–157. - PubMed
    1. Arvola R.M., Weidmann C.A., Tanaka Hall T.M., Goldstrohm A.C. Combinatorial control of messenger RNAs by Pumilio, nanos and brain tumor proteins. RNA Biol. 2017; 14:1445–1456. - PMC - PubMed
    1. Lehmann R., Nusslein-Volhard C. Involvement of the pumilio gene in the transport of an abdominal signal in the Drosophila embyro. Nature. 1987; 329:167–170.
    1. Barker D.D., Wang C., Moore J., Dickinson L.K., Lehmann R. Pumilio is essential for function but not for distribution of the Drosophila abdominal determinant Nanos. Genes Dev. 1992; 6:2312–2326. - PubMed
    1. Murata Y., Wharton R.P. Binding of pumilio to maternal hunchback mRNA is required for posterior patterning in Drosophila embryos. Cell. 1995; 80:747–756. - PubMed

Publication types

LinkOut - more resources