Developmental programming: Adipose depot-specific changes and thermogenic adipocyte distribution in the female sheep
- PMID: 31863810
- PMCID: PMC7012762
- DOI: 10.1016/j.mce.2019.110691
Developmental programming: Adipose depot-specific changes and thermogenic adipocyte distribution in the female sheep
Abstract
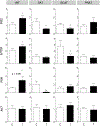
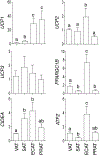
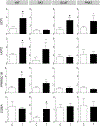
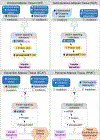
Prenatal testosterone (T)-treated female sheep exhibit an enhanced inflammatory and oxidative stress state in the visceral adipose tissue (VAT) but not in the subcutaneous (SAT), while surprisingly maintaining insulin sensitivity in both depots. In adult sheep, adipose tissue is predominantly composed of white adipocytes which favor lipid storage. Brown/beige adipocytes that make up the brown adipose tissue (BAT) favor lipid utilization due to thermogenic uncoupled protein 1 expression and are interspersed amidst white adipocytes, more so in epicardiac (ECAT) and perirenal (PRAT) depots. The impact of prenatal T-treatment on ECAT and PRAT depots are unknown. As BAT imparts a metabolically healthy phenotype, the depot-specific impact of prenatal T-treatment on inflammation, oxidative stress, differentiation and insulin sensitivity could be dictated by the distribution of brown adipocytes. This hypothesis was tested by assessing markers of oxidative stress, inflammation, adipocyte differentiation, fibrosis and thermogenesis in adipose depots from control and prenatal T (100 mg T propionate twice a week from days 30-90 of gestation) -treated female sheep at 21 months of age. Our results show prenatal T-treatment induces depot-specific changes in inflammation, oxidative stress state, collagen accumulation, and differentiation with changes being more pronounced in the VAT. Prenatal T-treatment also increased thermogenic gene expression in all depots indicative of increased browning with effects being more prominent in VAT and SAT. Considering that inflammatory and oxidative stress are also elevated, the increased brown adipocyte distribution is likely a compensatory response to maintain insulin sensitivity and function of organs in the proximity of respective depots.
Keywords: Adipose tissue; Brown adipose tissue; Inflammation; Insulin sensitivity; Oxidative stress.
Copyright © 2019 Elsevier B.V. All rights reserved.
Conflict of interest statement
Declaration of competing interest Authors have nothing to disclose.
Figures


Similar articles
-
Developmental programming: Metabolic tissue-specific changes in endoplasmic reticulum stress, mitochondrial oxidative and telomere length status induced by prenatal testosterone excess in the female sheep.Mol Cell Endocrinol. 2021 Apr 15;526:111207. doi: 10.1016/j.mce.2021.111207. Epub 2021 Feb 17. Mol Cell Endocrinol. 2021. PMID: 33607270 Free PMC article.
-
Developmental programming: Prenatal testosterone-induced changes in epigenetic modulators and gene expression in metabolic tissues of female sheep.Mol Cell Endocrinol. 2020 Aug 20;514:110913. doi: 10.1016/j.mce.2020.110913. Epub 2020 Jun 17. Mol Cell Endocrinol. 2020. PMID: 32562712 Free PMC article.
-
Developmental programming: Adipose depot-specific transcriptional regulation by prenatal testosterone excess in a sheep model of PCOS.Mol Cell Endocrinol. 2021 Mar 1;523:111137. doi: 10.1016/j.mce.2020.111137. Epub 2020 Dec 25. Mol Cell Endocrinol. 2021. PMID: 33359827 Free PMC article.
-
White, brown, beige/brite: different adipose cells for different functions?Endocrinology. 2013 Sep;154(9):2992-3000. doi: 10.1210/en.2013-1403. Epub 2013 Jun 19. Endocrinology. 2013. PMID: 23782940 Review.
-
Capsinoids and related food ingredients activating brown fat thermogenesis and reducing body fat in humans.Curr Opin Lipidol. 2013 Feb;24(1):71-7. doi: 10.1097/MOL.0b013e32835a4f40. Curr Opin Lipidol. 2013. PMID: 23298960 Review.
Cited by
-
Developmental programming: Metabolic tissue-specific changes in endoplasmic reticulum stress, mitochondrial oxidative and telomere length status induced by prenatal testosterone excess in the female sheep.Mol Cell Endocrinol. 2021 Apr 15;526:111207. doi: 10.1016/j.mce.2021.111207. Epub 2021 Feb 17. Mol Cell Endocrinol. 2021. PMID: 33607270 Free PMC article.
-
Gestational testosterone excess early to mid-pregnancy disrupts maternal lipid homeostasis and activates biosynthesis of phosphoinositides and phosphatidylethanolamines in sheep.Sci Rep. 2024 Mar 14;14(1):6230. doi: 10.1038/s41598-024-56886-6. Sci Rep. 2024. PMID: 38486090 Free PMC article.
-
Developmental programming: Transcriptional regulation of visceral and subcutaneous adipose by prenatal bisphenol-A in female sheep.Chemosphere. 2020 Sep;255:127000. doi: 10.1016/j.chemosphere.2020.127000. Epub 2020 May 7. Chemosphere. 2020. PMID: 32417515 Free PMC article.
-
Developmental programming: Prenatal testosterone-induced changes in epigenetic modulators and gene expression in metabolic tissues of female sheep.Mol Cell Endocrinol. 2020 Aug 20;514:110913. doi: 10.1016/j.mce.2020.110913. Epub 2020 Jun 17. Mol Cell Endocrinol. 2020. PMID: 32562712 Free PMC article.
-
Developmental programming: Adipose depot-specific regulation of non-coding RNAs and their relation to coding RNA expression in prenatal testosterone and prenatal bisphenol-A -treated female sheep.Mol Cell Endocrinol. 2023 Mar 15;564:111868. doi: 10.1016/j.mce.2023.111868. Epub 2023 Jan 26. Mol Cell Endocrinol. 2023. PMID: 36708980 Free PMC article.
References
-
- DeFronzo RA and Ferrannini E, 1991. Insulin resistance. A multifaceted syndrome responsible for NIDDM, obesity, hypertension, dyslipidemia, and atherosclerotic cardiovascular disease, Diabetes Care. 14, 173–94. - PubMed
-
- Ruige JB, Assendelft WJ, Dekker JM, Kostense PJ, Heine RJ and Bouter LM, 1998. Insulin and risk of cardiovascular disease: a meta-analysis, Circulation. 97, 996–1001. - PubMed
-
- Sowers JR, 1992. Insulin resistance, hyperinsulinemia, dyslipidemia, hypertension, and accelerated atherosclerosis, J Clin Pharmacol. 32, 529–35. - PubMed
-
- Tai ES, Lau TN, Ho SC, Fok AC and Tan CE, 2000. Body fat distribution and cardiovascular risk in normal weight women. Associations with insulin resistance, lipids and plasma leptin, Int J Obes Relat Metab Disord. 24, 751–7. - PubMed
Publication types
MeSH terms
Substances
Grants and funding
LinkOut - more resources
Full Text Sources
Research Materials

