. 2020 Feb 1:147:48-60.
doi: 10.1016/j.freeradbiomed.2019.12.018. Epub 2019 Dec 19.

Scavenging reactive oxygen species selectively inhibits M2 macrophage polarization and their pro-tumorigenic function in part, via Stat3 suppression

Affiliations

Scavenging reactive oxygen species selectively inhibits M2 macrophage polarization and their pro-tumorigenic function in part, via Stat3 suppression

Brandon Griess et al. Free Radic Biol Med. .

Abstract

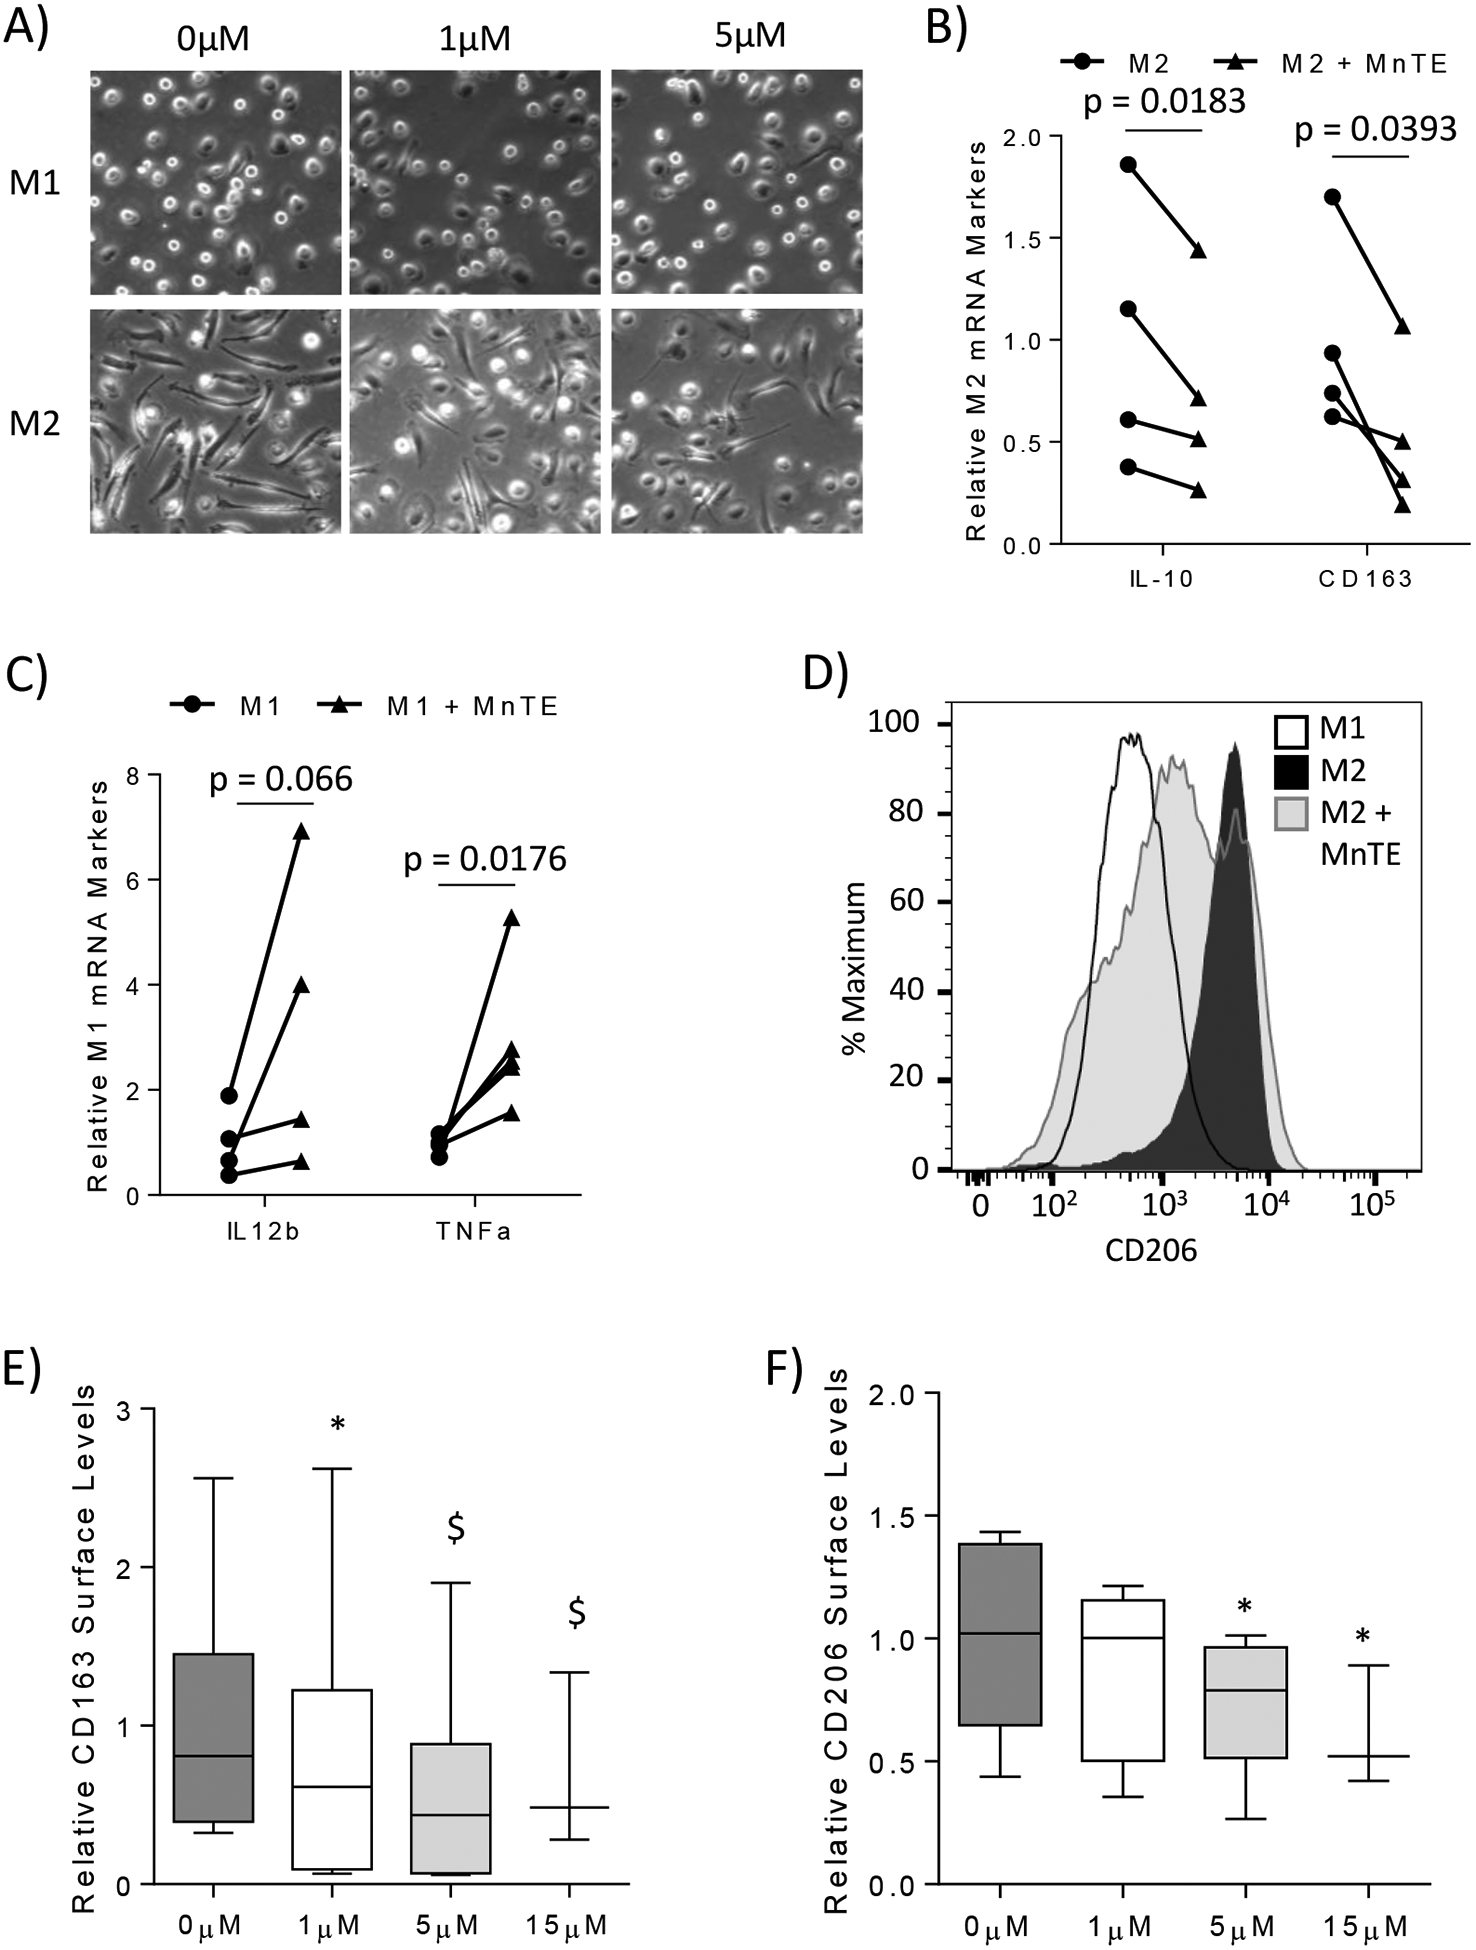
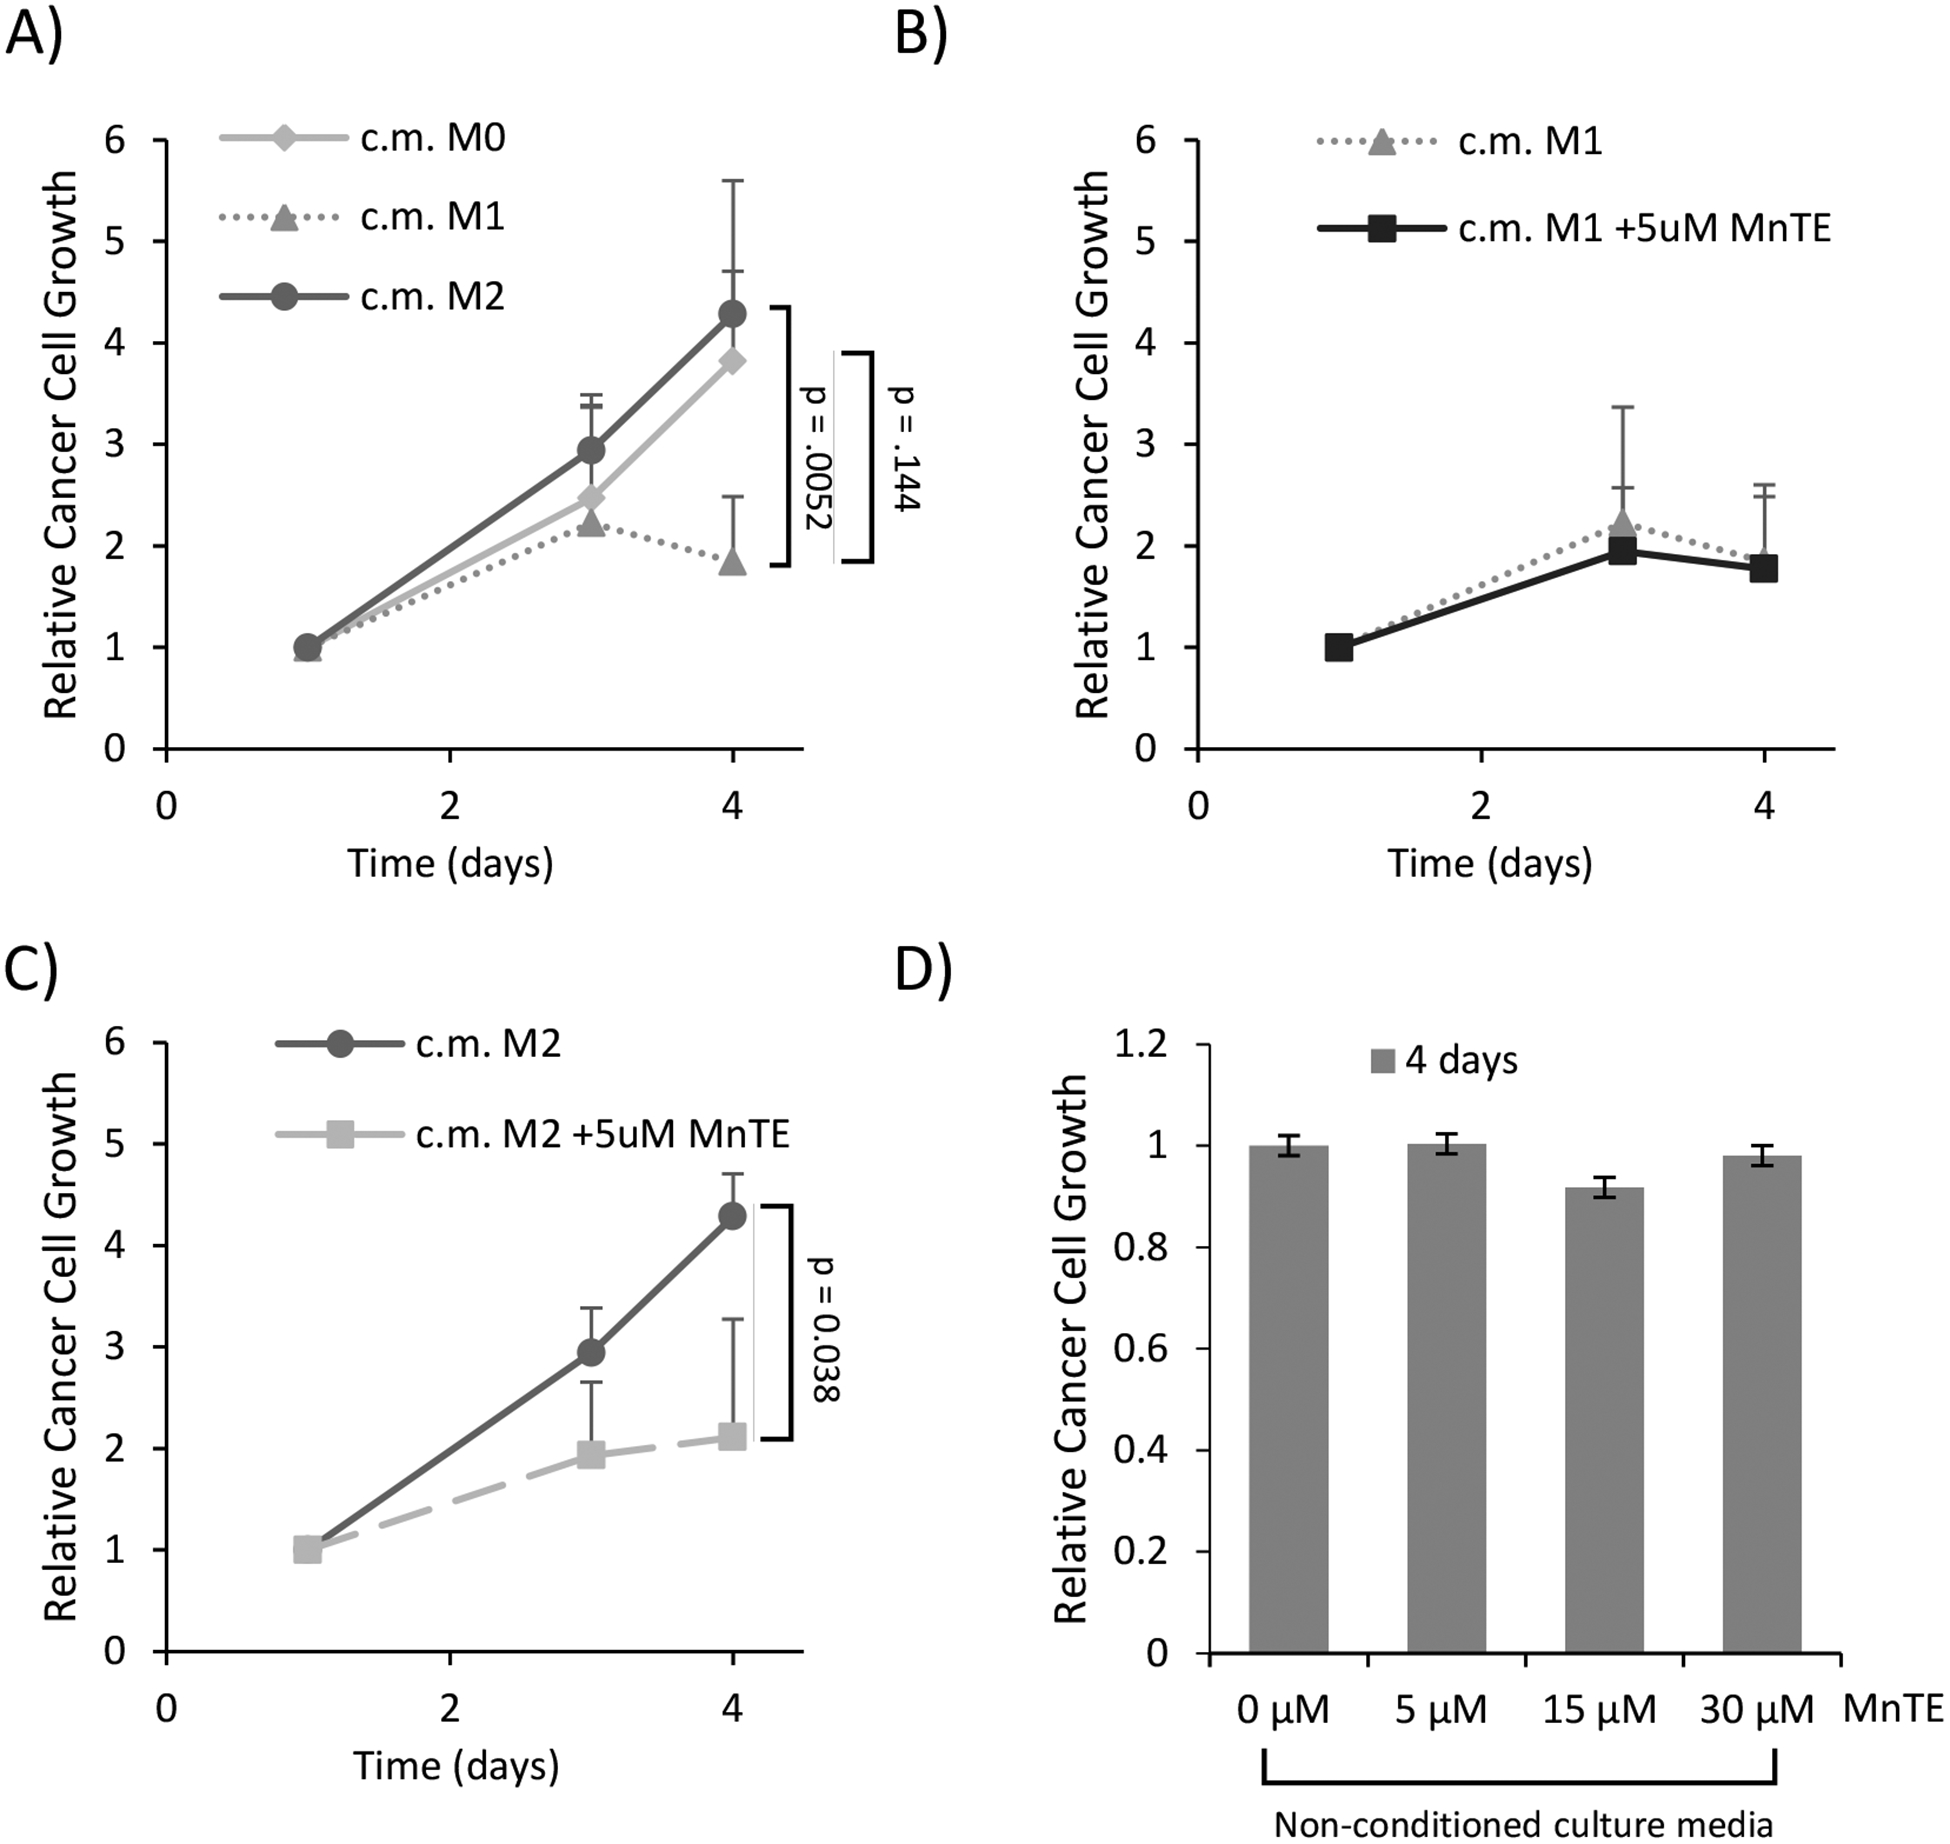
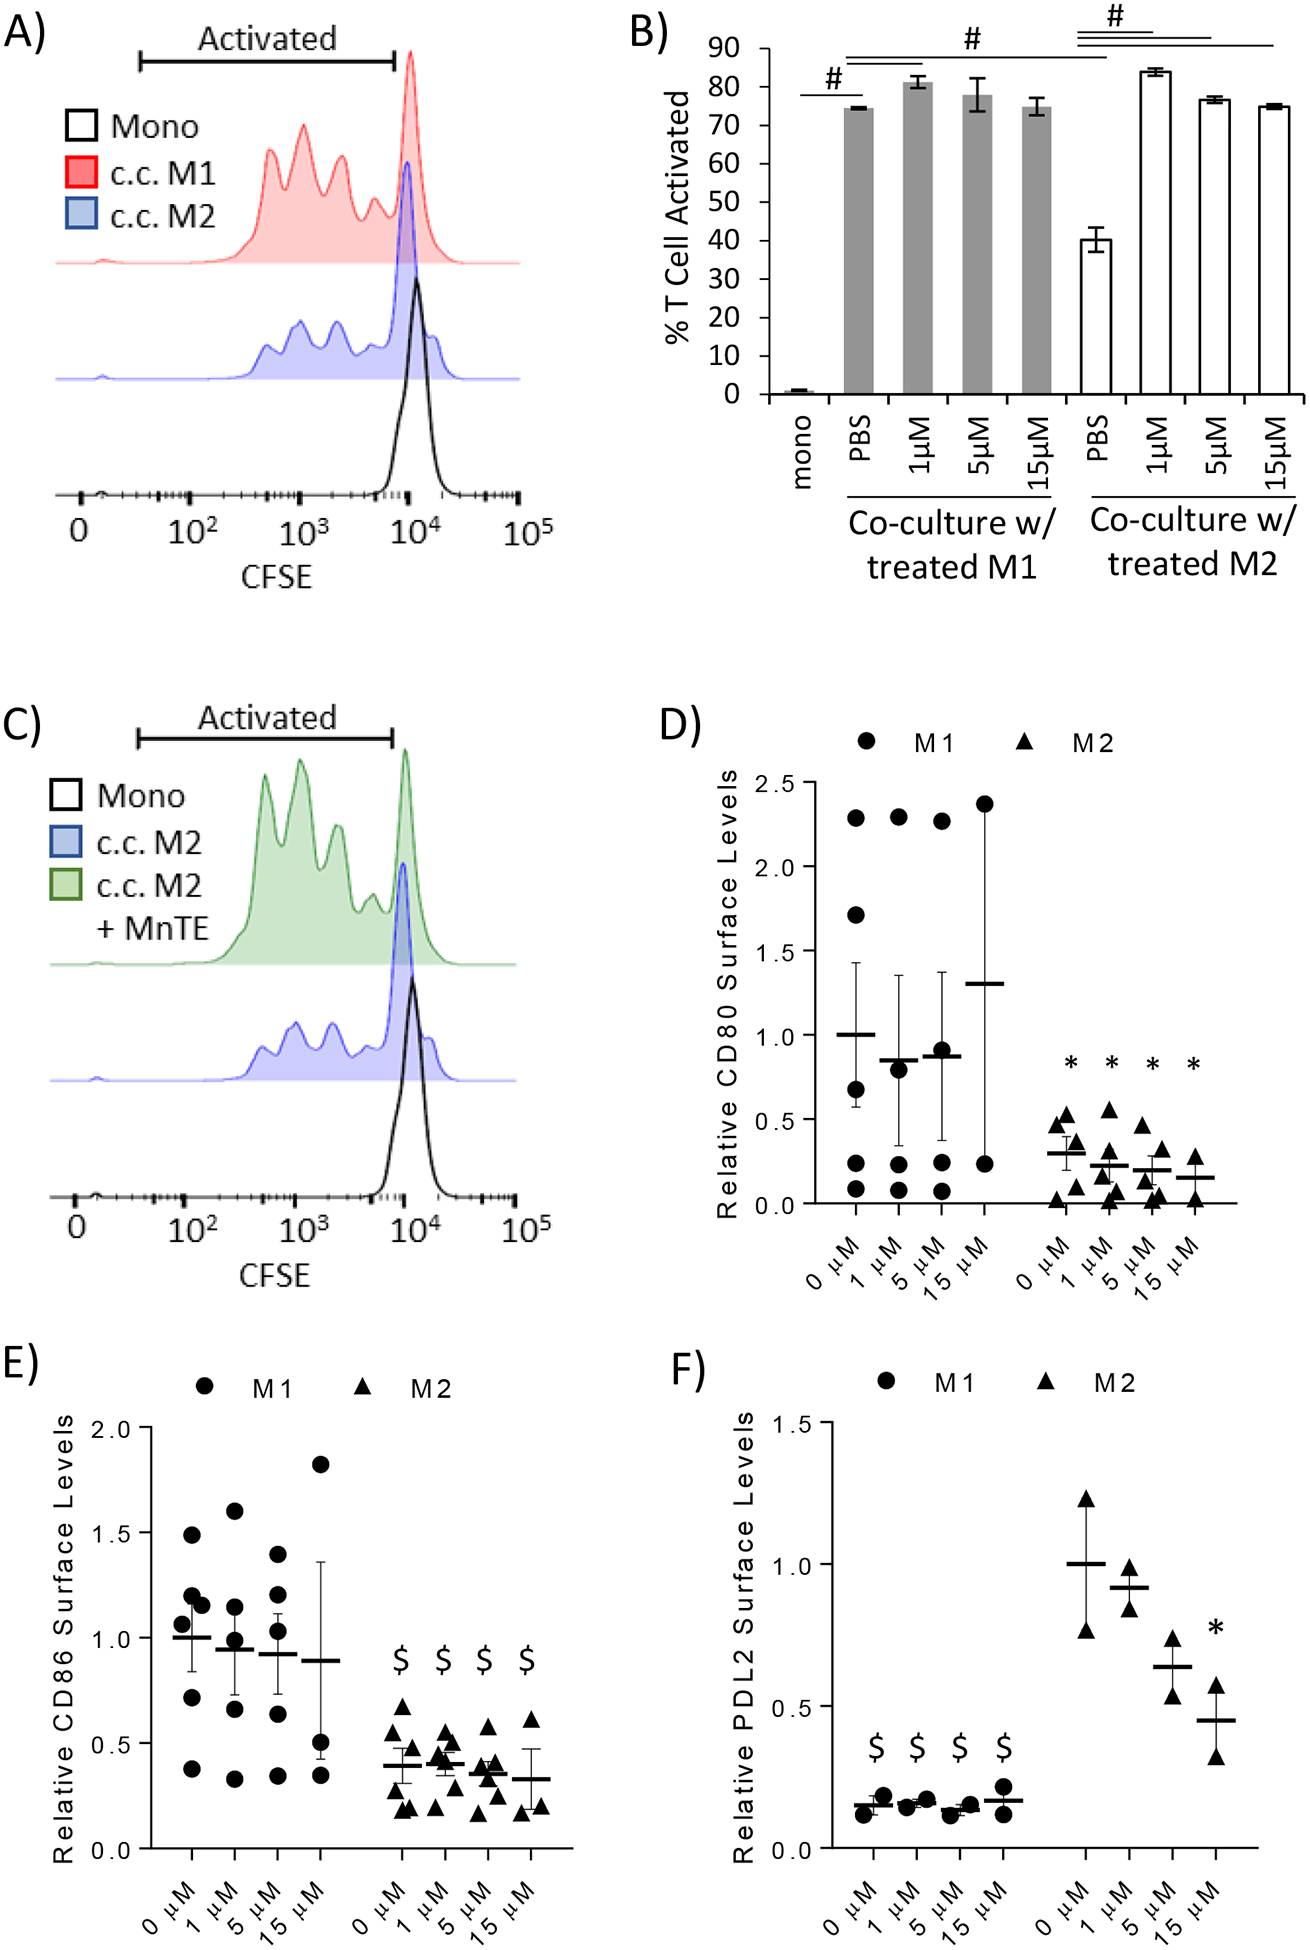
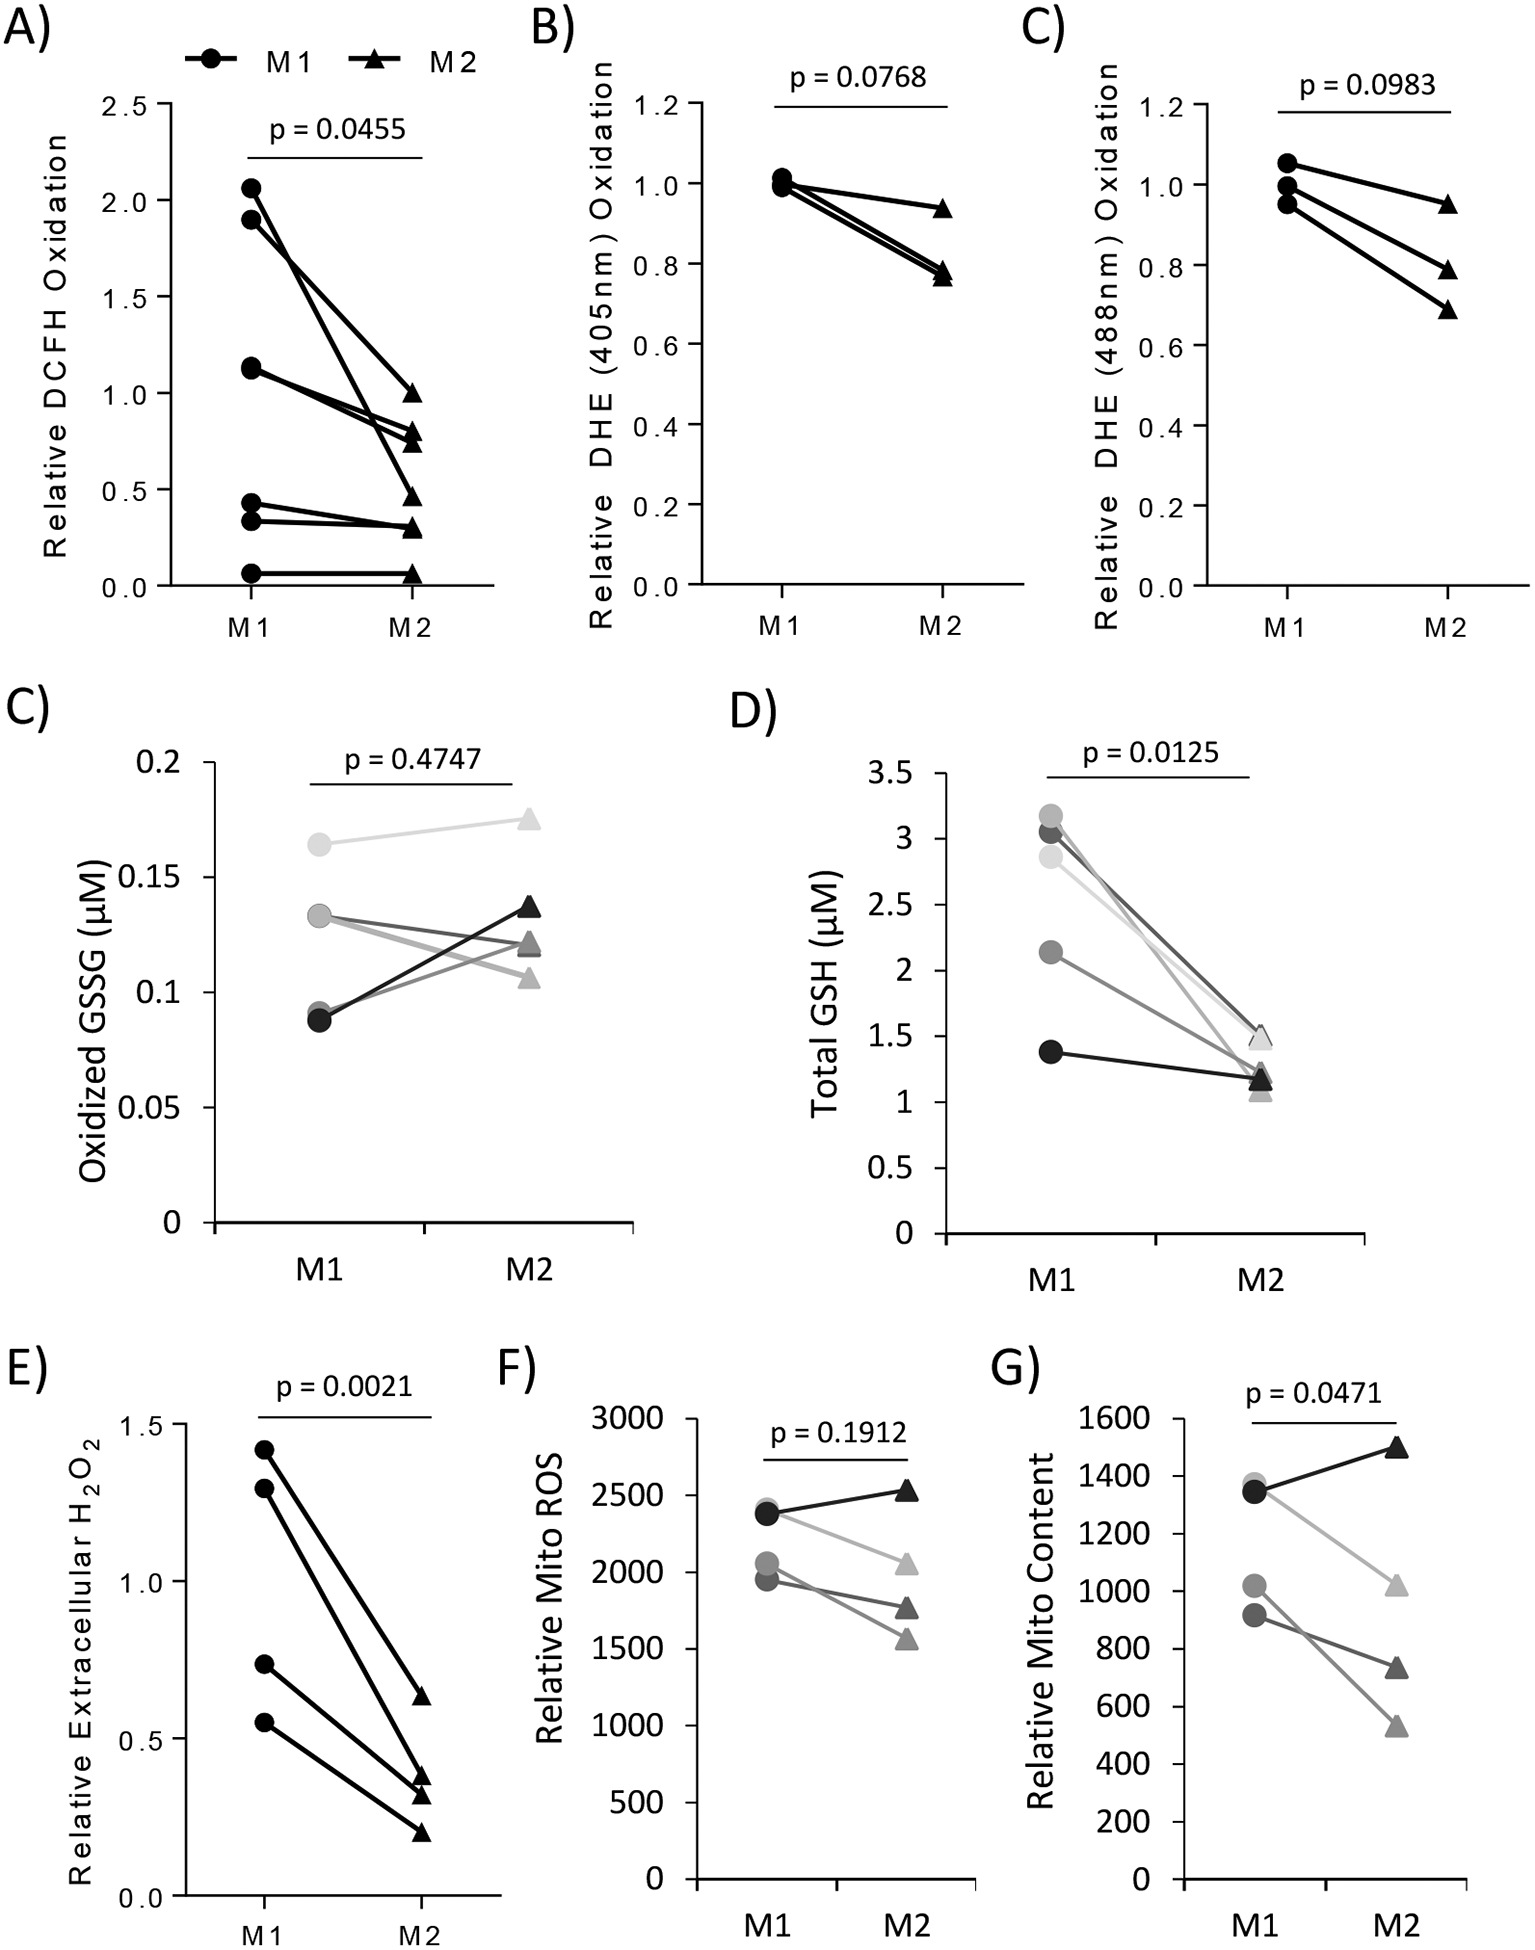
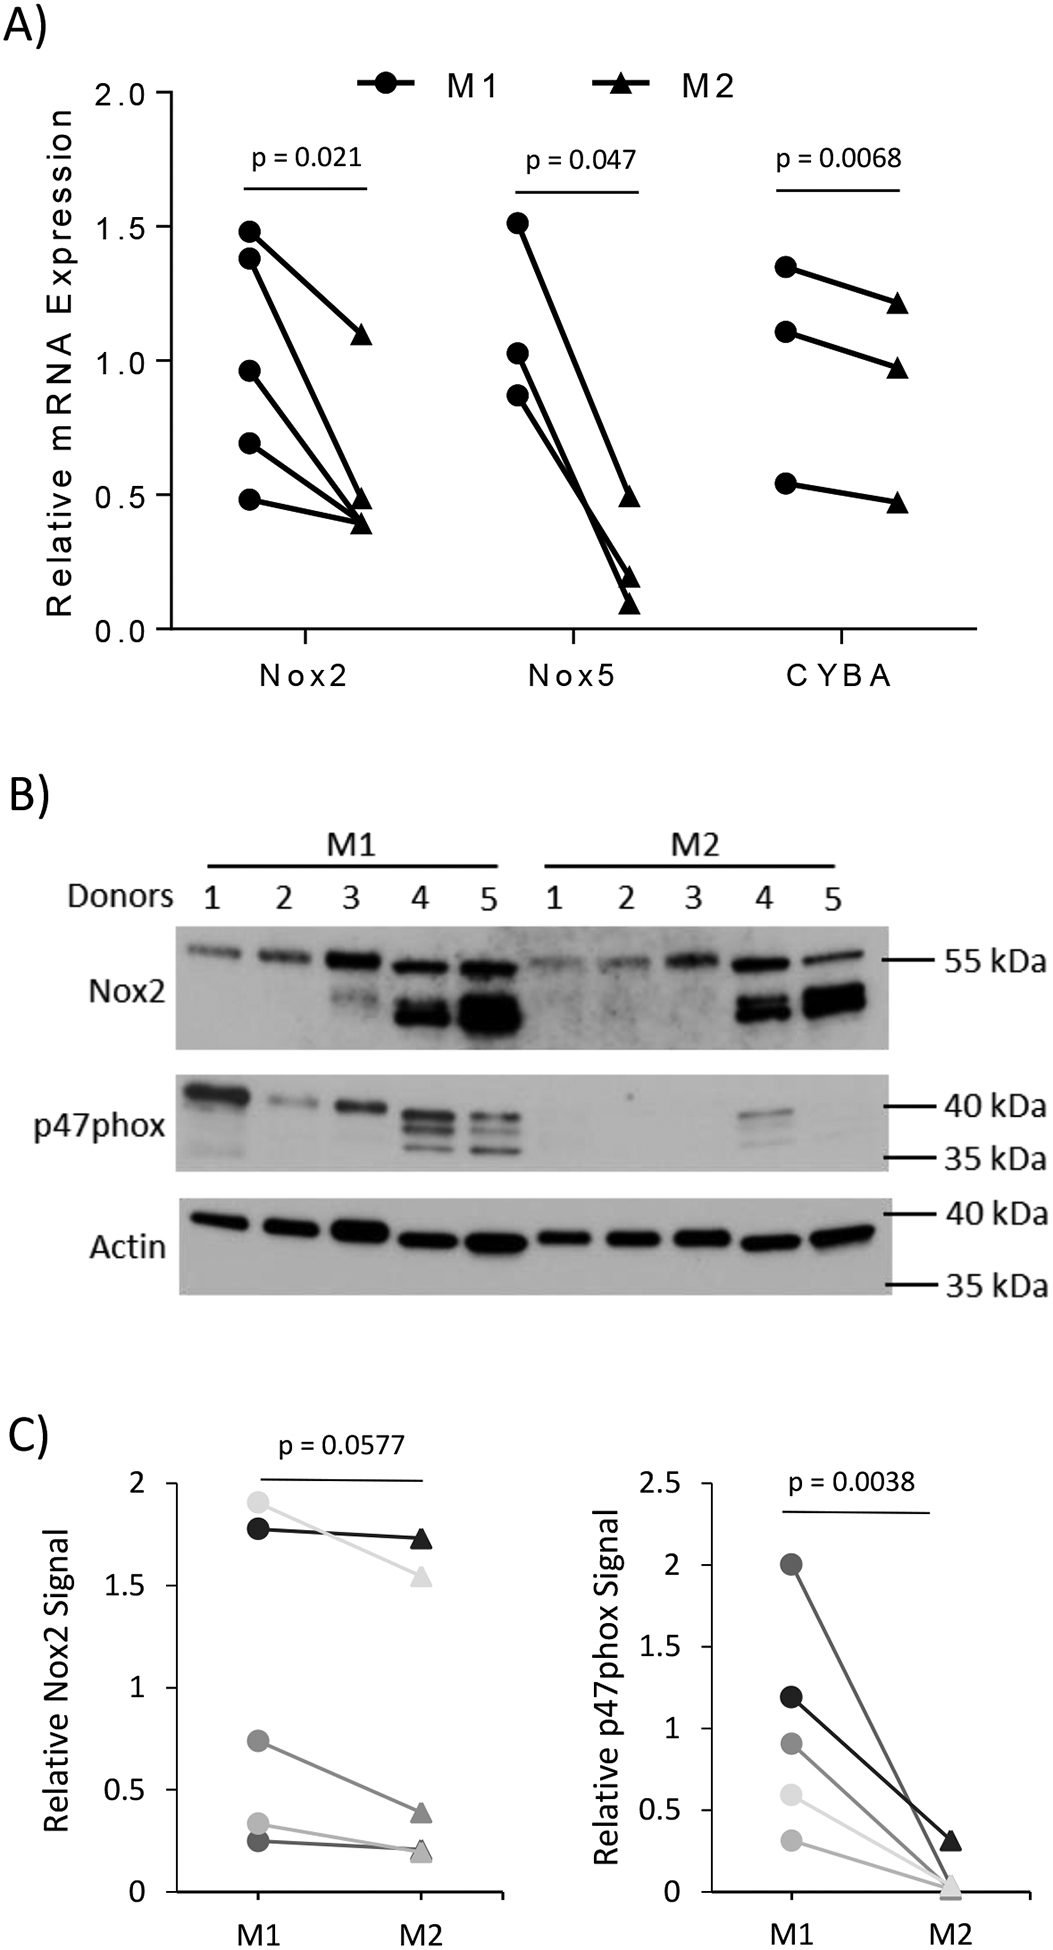
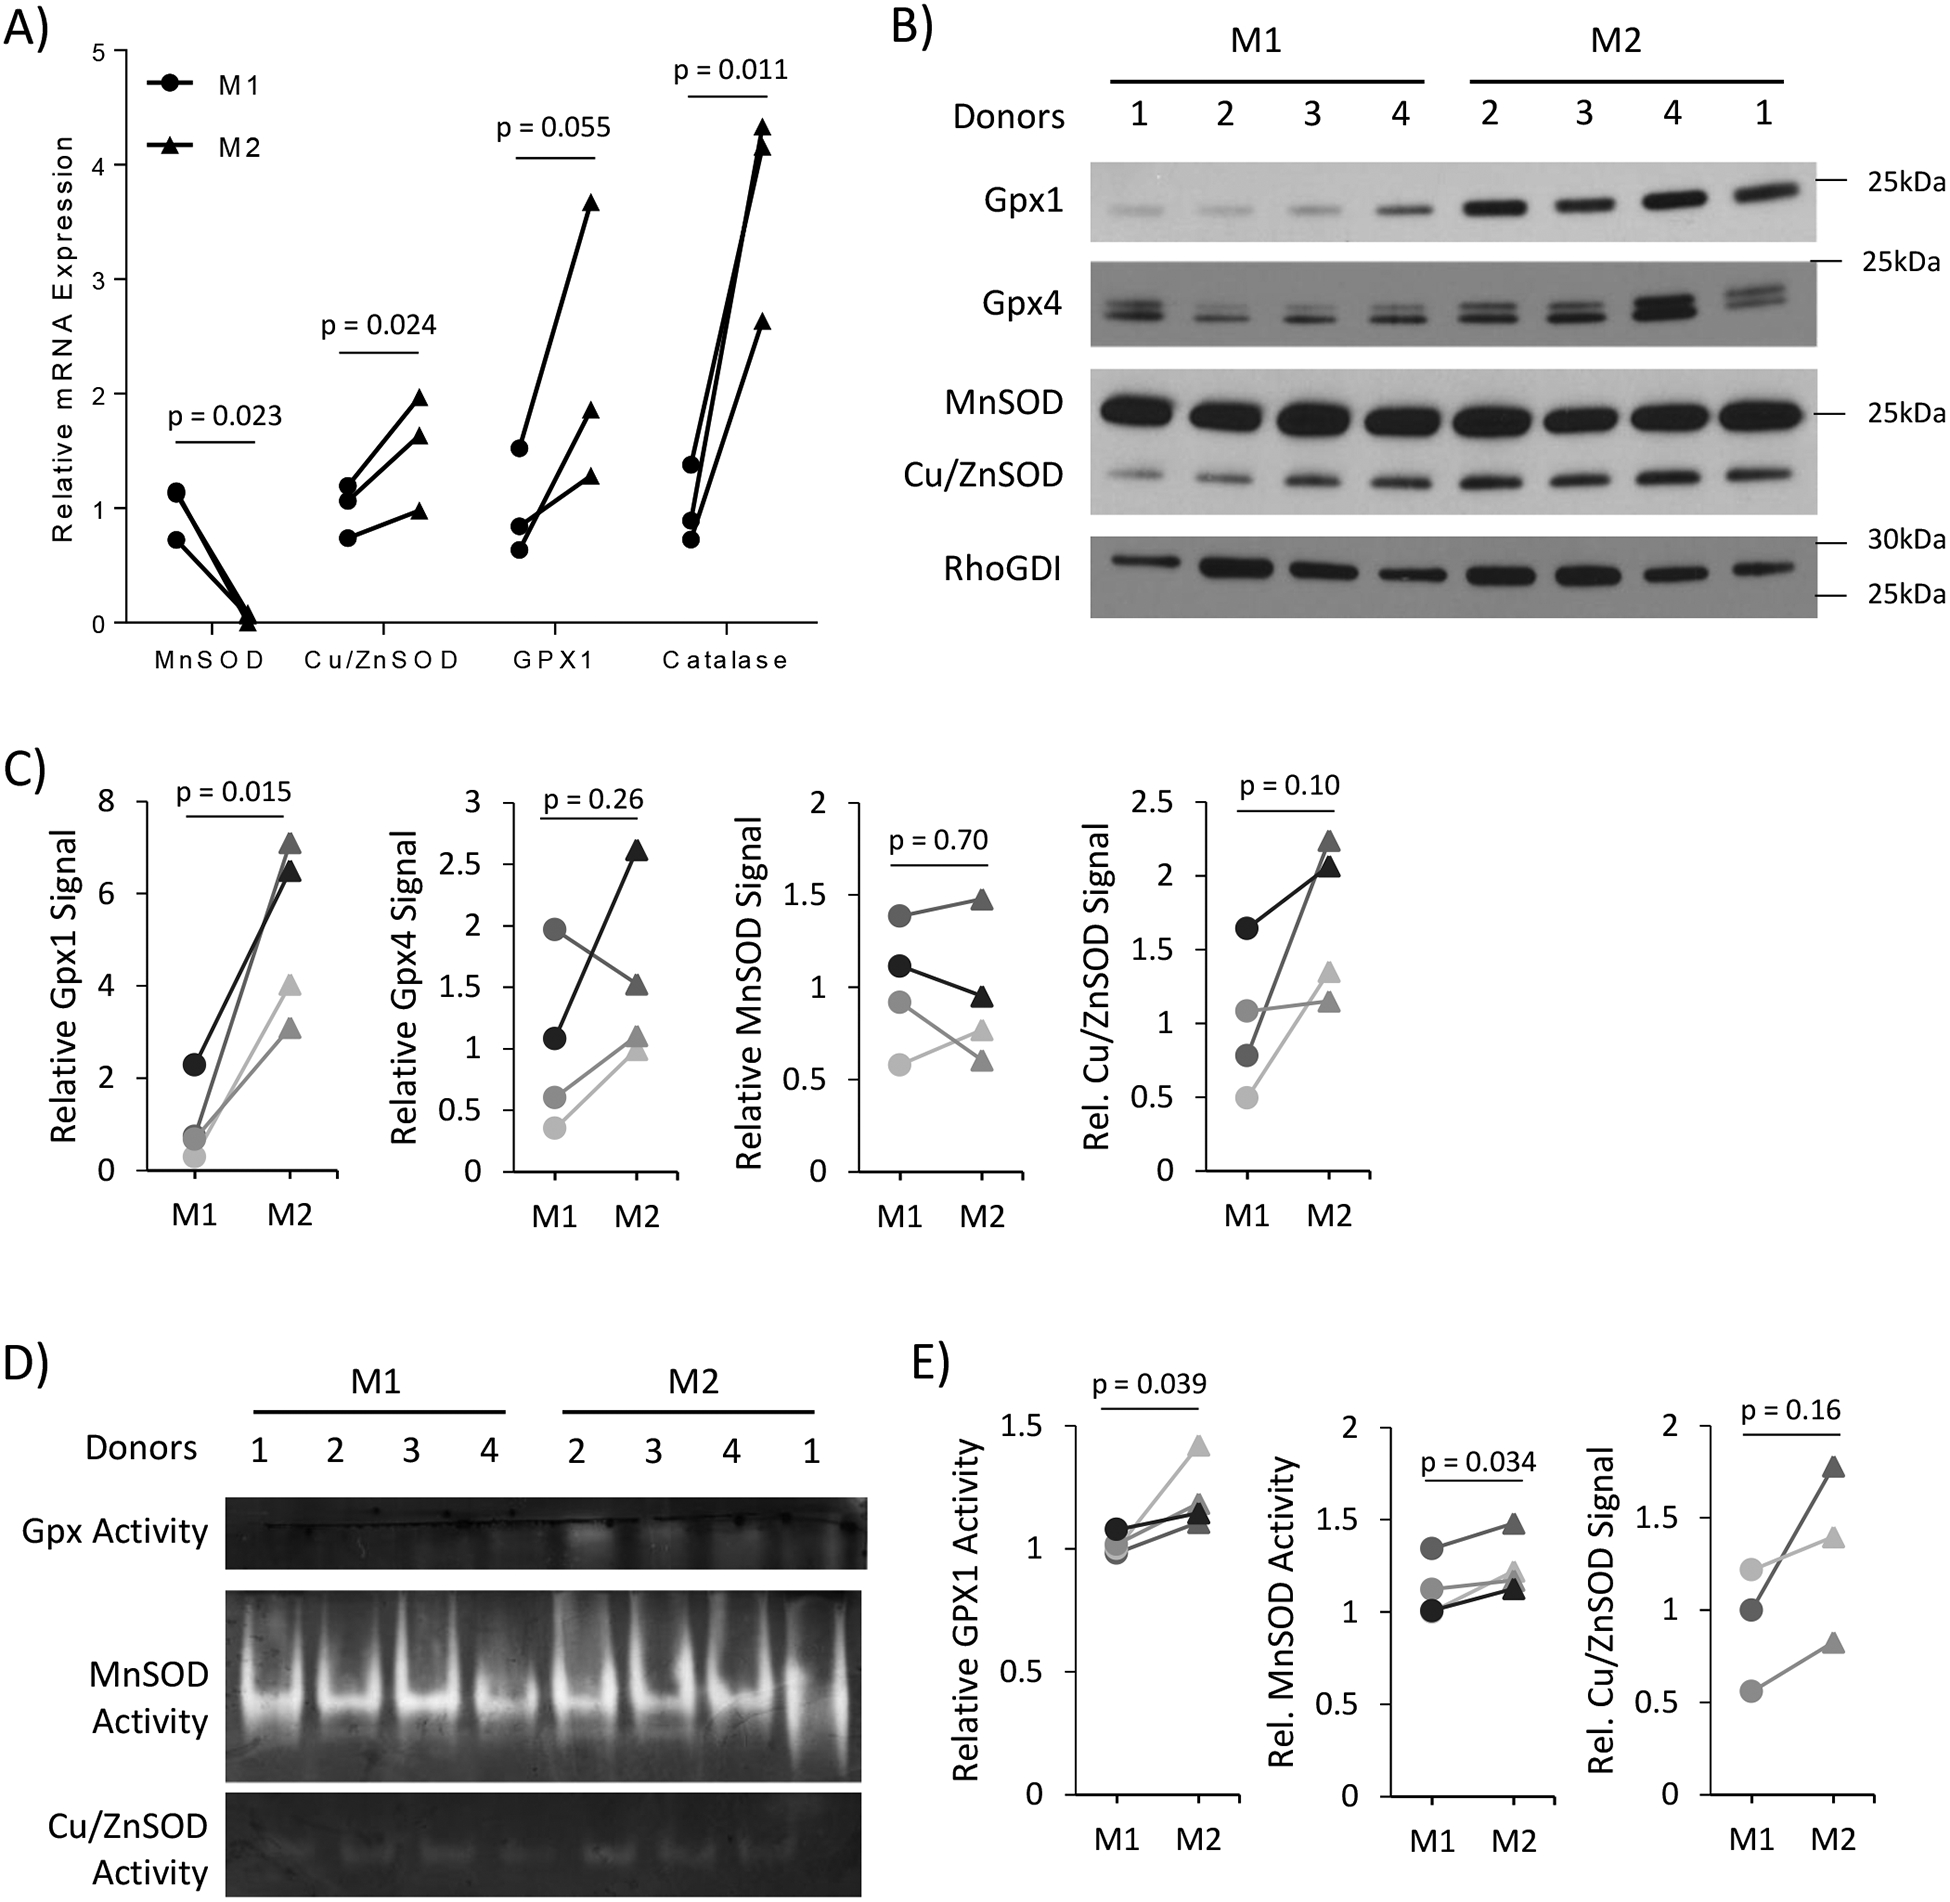
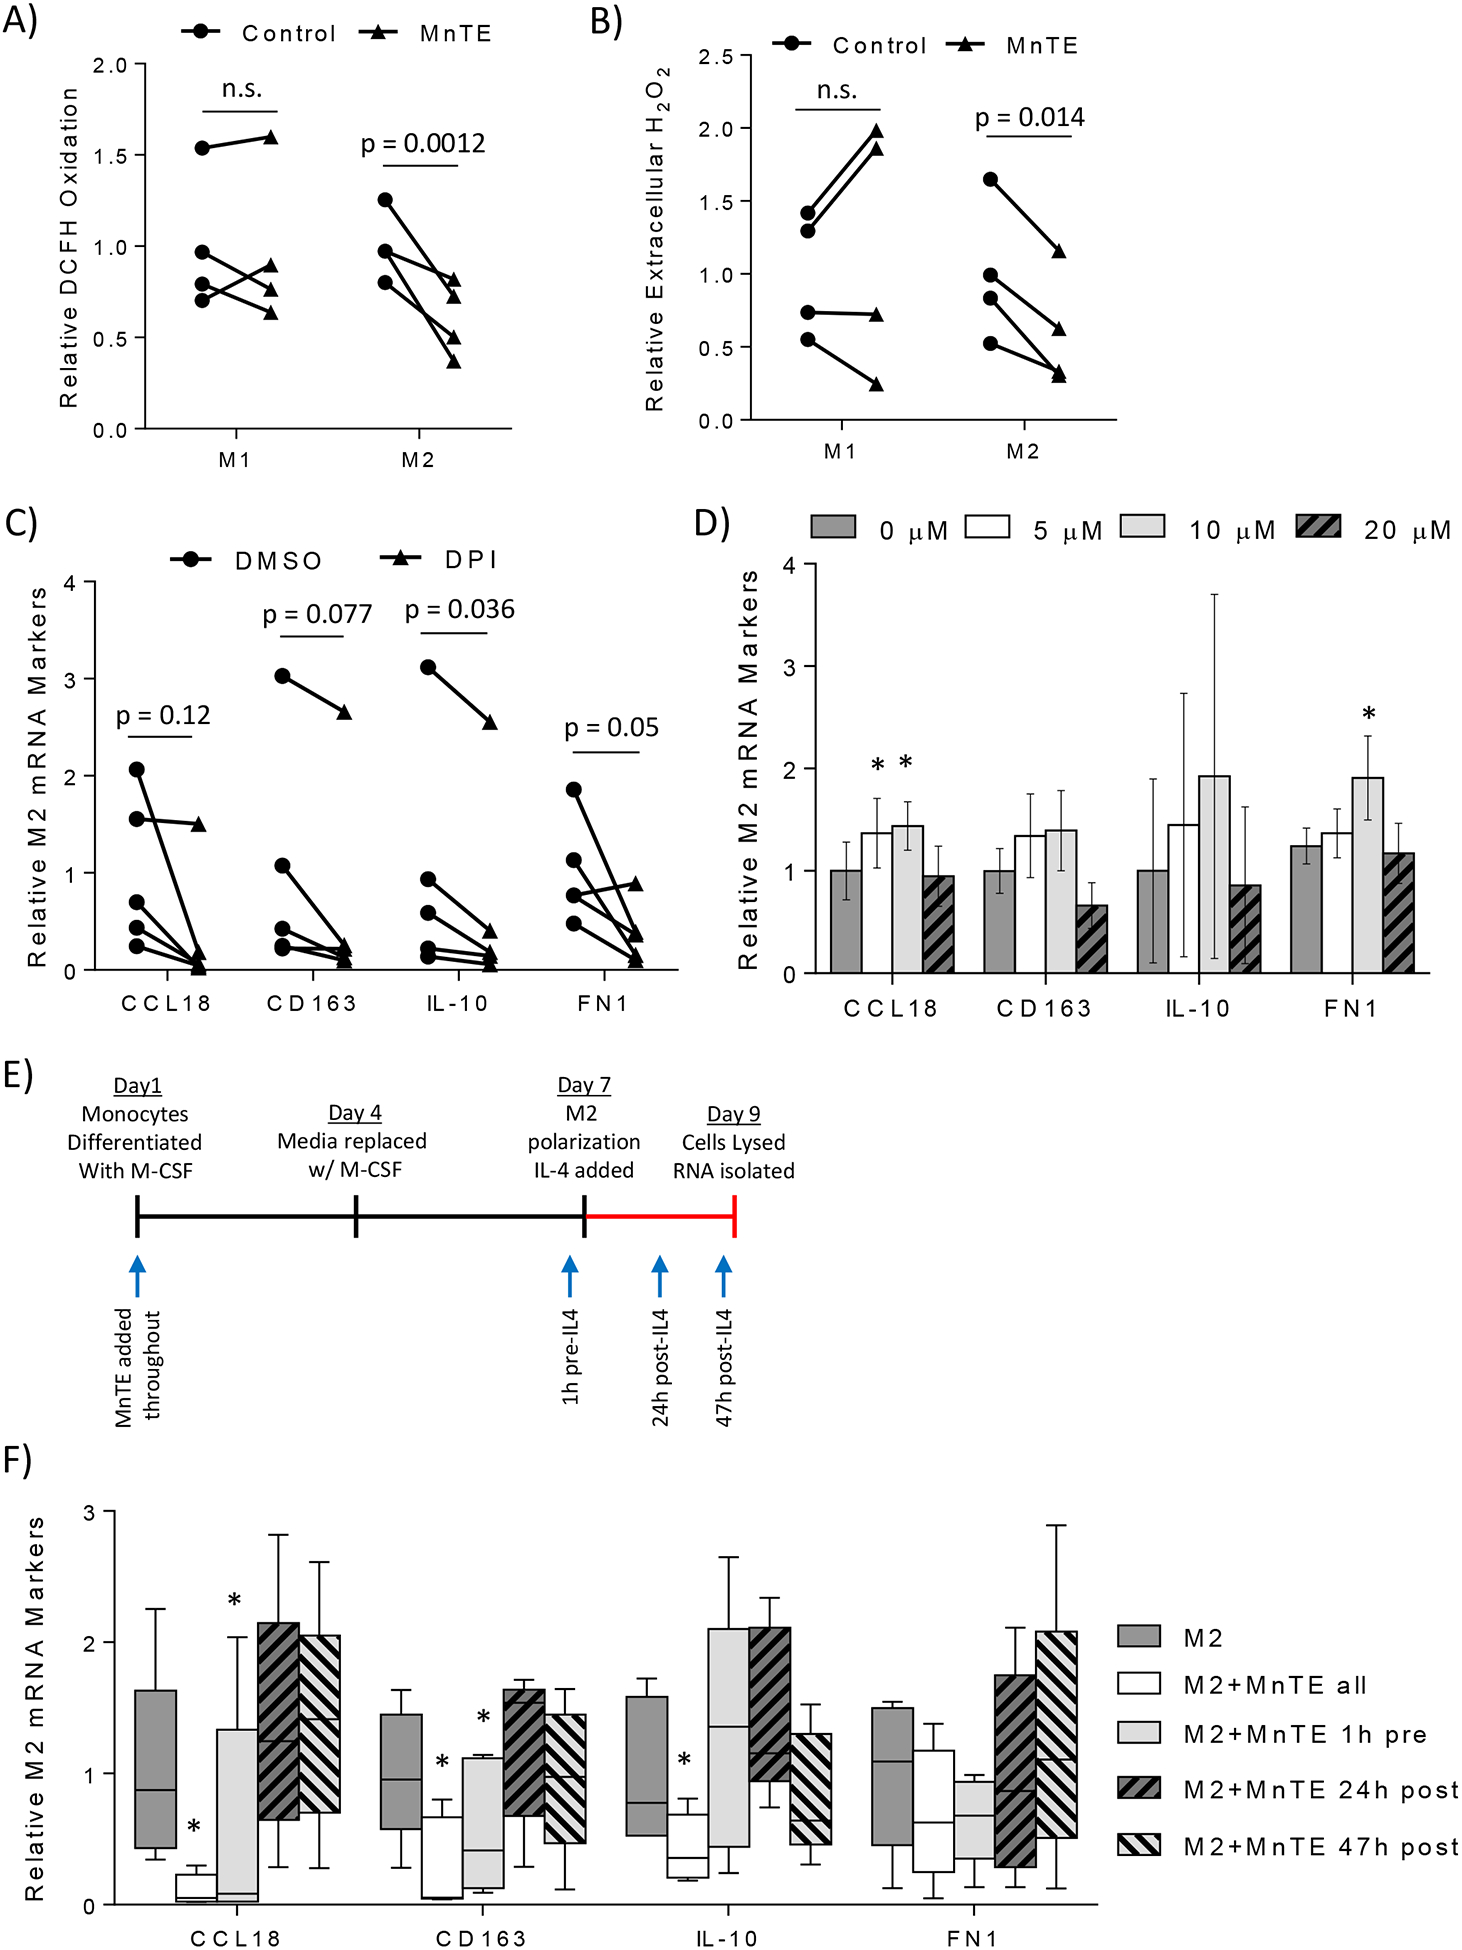
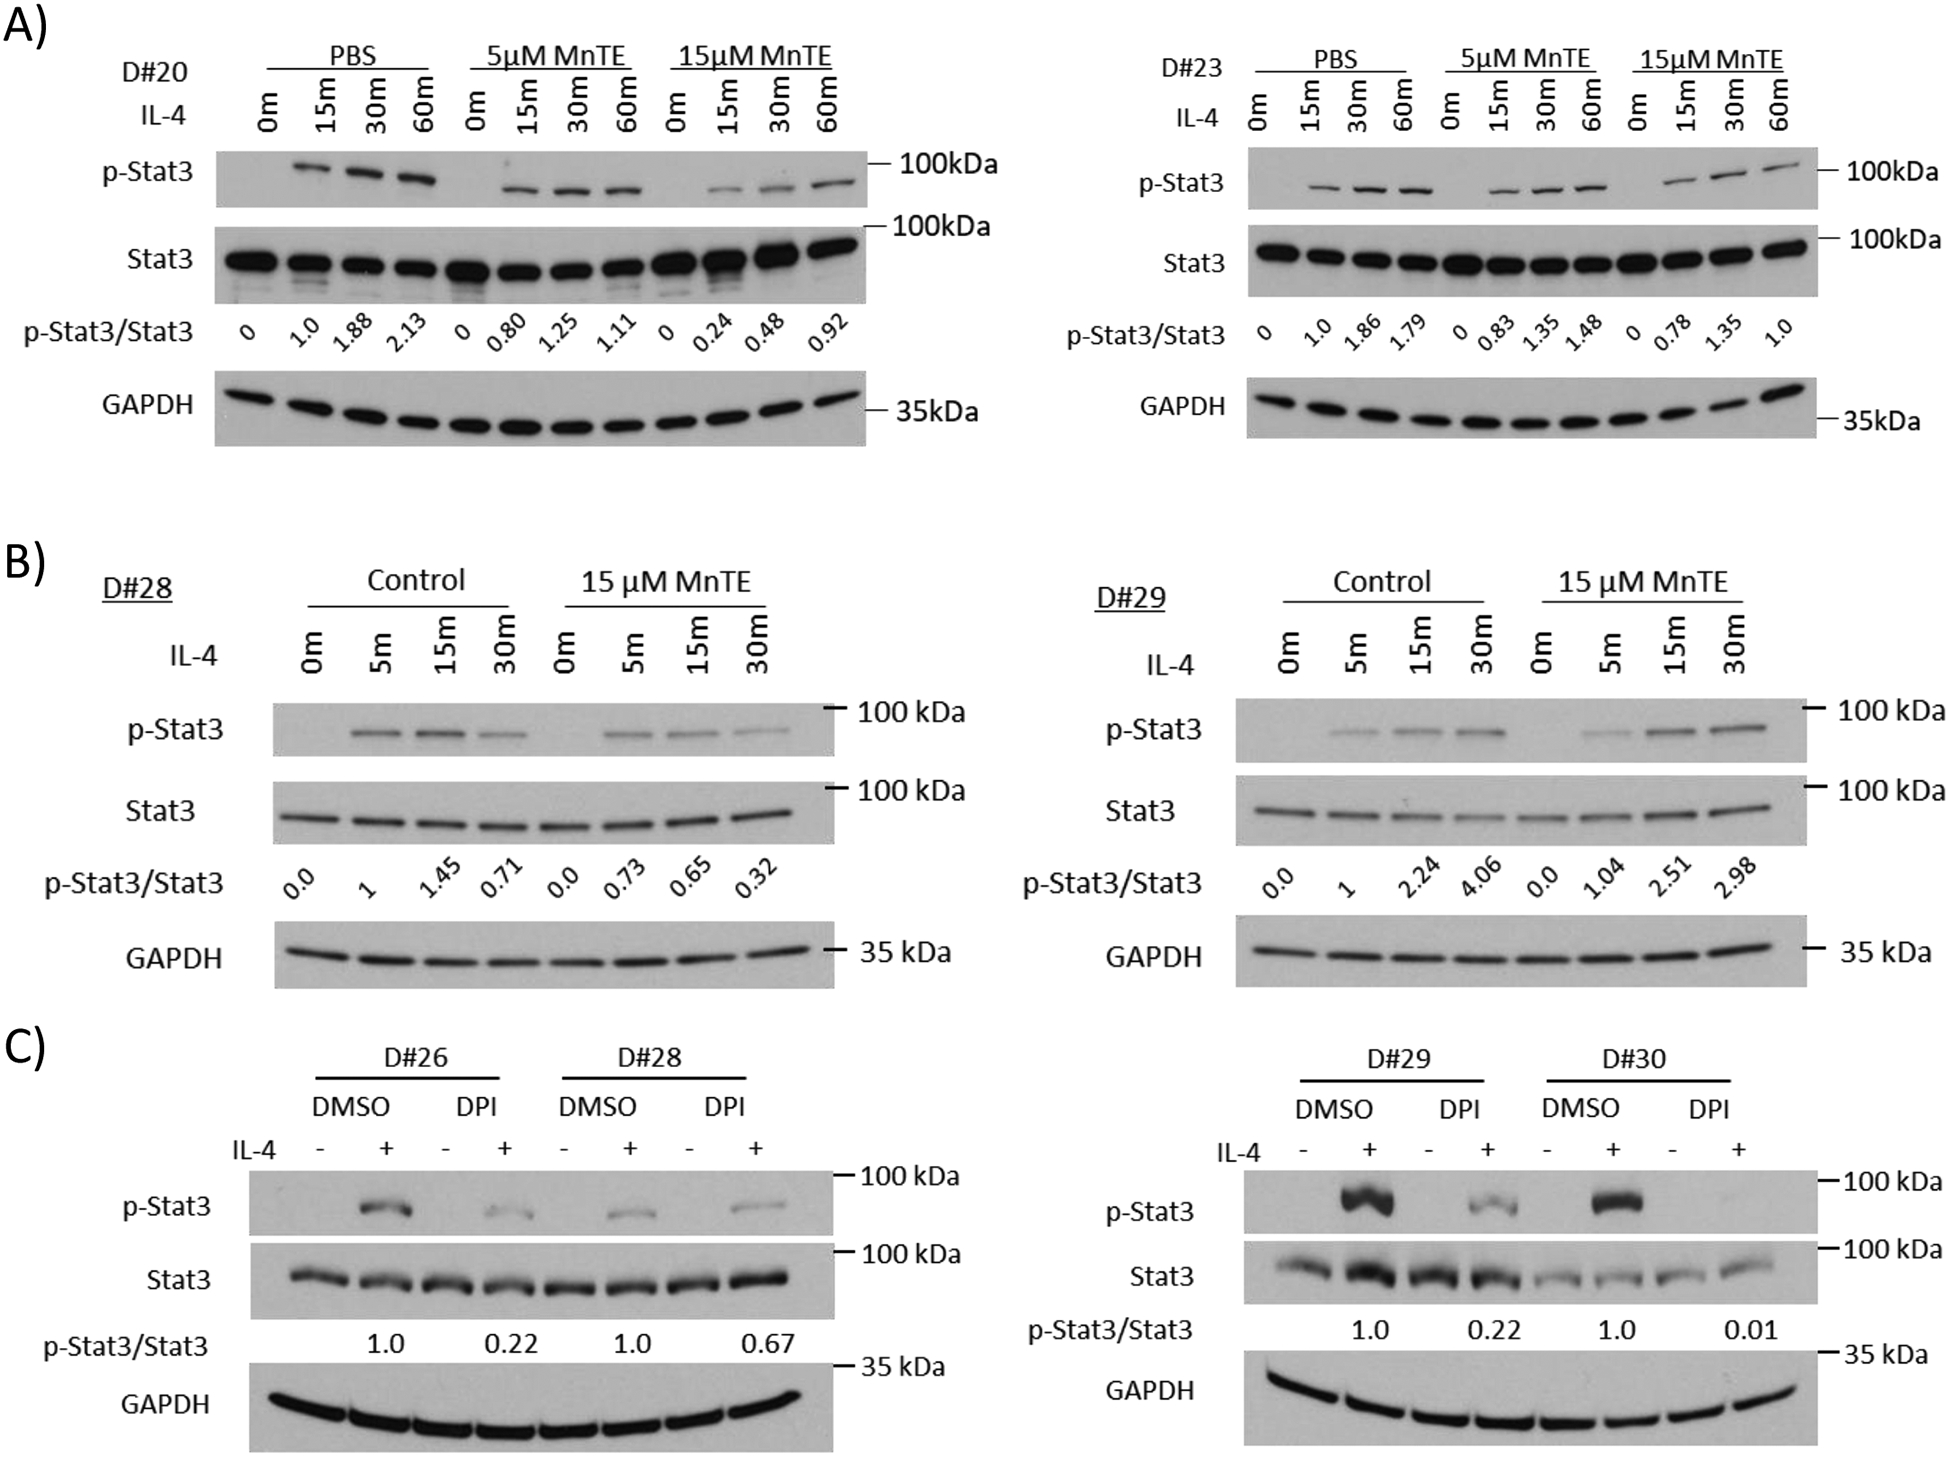
Tumor associated macrophages (TAM) enhance the aggressiveness of breast cancer via promoting cancer cell growth, metastasis, and suppression of the patient's immune system. These TAMs are polarized in breast cancer with features more closely resembling the pro-tumorigenic and immunosuppressive M2 type rather than the anti-tumor and pro-inflammatory M1 type. The goal of our study was to examine primary human monocyte-derived M1 and M2 macrophages for key redox differences and determine sensitivities of these macrophages to the redox-active drug, MnTE-2-PyP5+. This compound reduced levels of M2 markers and inhibited their ability to promote cancer cell growth and suppress T cell activation. The surface levels of the T cell suppressing molecule, PD-L2, were reduced by MnTE-2-PyP5+ in a dose-dependent manner. This study also examined key differences in ROS generation and scavenging between M1 and M2 macrophages. Our results indicate that M2 macrophages have lower levels of reactive oxygen species (ROS) and lower production of extracellular hydrogen peroxide compared to the M1 macrophages. These differences are due in part to reduced expression levels of pro-oxidants, Nox2, Nox5, and the non-enzymatic members of the Nox complex, p22phox and p47phox, as well as higher levels of antioxidant enzymes, Cu/ZnSOD, Gpx1, and catalase. More importantly, we found that despite having lower ROS levels, M2 macrophages require ROS for proper polarization, as addition of hydrogen peroxide increased M2 markers. These TAM-like macrophages are also more sensitive to the ROS modulator and a pan-Nox inhibitor. Both MnTE-2-PyP5+ and DPI inhibited expression levels of M2 marker genes. We have further shown that this inhibition was partly mediated through a decrease in Stat3 activation during IL4-induced M2 polarization. Overall, this study reveals key redox differences between M1 and M2 primary human macrophages and that redox-active drugs can be used to inhibit the pro-tumor and immunosuppressive phenotype of TAM-like M2 macrophages. This study also provides rationale for combining MnTE-2-PyP5+ with immunotherapies.

Keywords: Breast cancer; Immunosuppression; ROS; SOD mimetics; Stat3; Tumor associated macrophages.


Conflict of interest statement

The authors declare no conflict

Figures

Figure 1)
Figure 1)
MnTE inhibits M2 polarization. Primary human macrophages were generated from isolated monocytes which were differentiated to macrophages and polarized to M1 or M2 types. The macrophages were analyzed 24 hours after polarization. (A) Representative phase contrast pictures of M1 and M2 macrophages treated with varying concentrations of MnTE. Expression of (B) M1 and (C) M2 mRNA markers in macrophages treated with or without 15 μM MnTE from 3 and 4 different donors, respectively. (D) A representative histogram of CD206 surface staining in M1 and M2 macrophages. (E, F) A box plot graph depicting flow cytometry analysis of M2 surface marker levels in M2 macrophages from 6 different donors treated with varying concentrations of MnTE. Relative values were calculated by comparing the change of MnTE treated samples to its untreated donor-specific control. Student t-test was used to calculate p-value for figures 1B and 1C. A one-way ANOVA followed by a post-hoc Tukey test was used to determine significance of samples treated with different concentrations of MnTE in figures 1E and 1F. Symbols indicate significance between the treatment groups and M2 control (* < 0.05, $ < 0.005, # < 0.0005).
Figure 2)
Figure 2)
MnTE treatment inhibits M2-mediated cancer cell growth. MDA-MB231 breast cancer cells were grown in 50% conditioned media from M1 or M2 macrophages, with or without MnTE pre-treatment. (A-C) Line graphs depicting the relative growth of MDA-MB231 cancer cells in macrophage conditioned media from 4 different donors. (A) This line graph compares growth of MDA-MB231 in the control conditioned media (of unstimulated M0 macrophages) to M1 and M2 macrophages. (B-C). Line graphs depicting the effect of 5 μM MnTE pre-treatment on (B) M1 and (C) M2 macrophage conditioned media versus control conditioned media. (D) The relative cancer cell growth after 4 days in unconditioned media with the addition of varying MnTE doses. Error bars are the standard deviation. Student t-test was used to calculate p-value with statistical significance being < 0.05. P-values between MnTE pretreated conditioned media and their respective controls are indicated by lines between the different groups.
Figure 3)
Figure 3)
MnTE inhibits M2-mediated T cell suppression. A T cell activation assay was performed to assess the ability of macrophages to modify T cell activation. Human peripheral blood lymphocytes (PBLs) were stained with CFSE to track their activation. PBLs were directly co-cultured with autologous control of pre-treated macrophages and stimulated with anti-CD3. Flow cytometry was used to track the dilution of CFSE as a proxy for T cell activation. (A) A representative histogram of T cells comparing unstimulated mono-culture T cells with anti-CD3 stimulated T cells co-cultured with either M1 or M2 macrophages. The bracket delineates the activated T cells measured in the bar graph. (B) A bar graph depicting the average percent T cell activated after direct co-culture with the control or pre-treated M1 and M2 macrophages. Four technical replicates from a representative donor are shown here. Similar results were obtained in 3 different donors. (C) A representative histogram highlighting the ability of pre-treated M2 macrophages to promote T cell activation. (D-F) Flow cytometry analysis of surface markers known to affect T cell activation in treated M1 and M2 macrophages. The following co-activators of (D) CD80, (E) CD86 were analyzed. Relative expression levels of the co-inhibitory molecule, PD-L2 is shown in (F). A two-way ANOVA followed by post-hoc Tukey test was used to calculate p-value with statistical significance being < 0.05. Symbols indicate significance between the M1 control group and the indicated sample in figures 1D–E. The symbols in figure 1F indicate statistical significance between the M2 control group and the indicated sample (* < 0.05, $ < 0.005, # < 0.0005).
Figure 4).
Figure 4).
M2 macrophages have differential redox status compared to M1. Primary human macrophages were analyzed after 24 hours of polarization. The ROS levels of primary human macrophages from 7 different human donors were measured by (A) DCFH. (B) DHE measured ROS levels in primary human macrophages from 4 different donors. DHE excitation at 405nm and 488nm was used to measure superoxide-specific levels and general ROS levels respectively. (C, D) The levels of oxidized GSSG and total GSH were measured using GSH/GSSG-glo assay in 5 different donors. (E) The levels of extracellular H2O2 were measured using AmplexRed via plate reader from 4 different donors. (F, G) The levels of mitochondrial ROS production and mitochondrial number in macrophages from 4 different donors were assessed using MitoSox and MitoTrackerGreen respectively. Each color indicating changes between M1 and M2 for each specific donor. (A, B, F, G) Fluorescence was assessed using flow cytometry. Relative values were calculated by comparing the change of the M2 sample to its donor specific M1 sample making each change donor specific to account for the heterogeneity of different human donors. Error bars are the standard deviation between all donors M1 or M2 samples. Paired student t-test was used to calculate p-value with statistical significance being < 0.05.
Figure 5).
Figure 5).
M2 macrophages have lower ROS producers than M1. (A) Messenger RNA was isolated from M1 and M2 macrophages 24 hours after addition of polarizing cytokines. The mRNA expression of Nox family members and co-factors was measured using rt-qPCR. The differences between M1 and M2 were calculated using the ΔΔ Ct method with 18S as the loading control. Analysis of gene expression was performed using N = 3–5 donors. (B) The protein expression of Nox2, p47phox, and β-actin in M1 and M2 macrophages was analyzed using Western blot analysis from 5 different donors. (C) Densitometry analysis of Nox2 and p47phox compared to the loading control, β-actin, is indicated in line graphs comparing the change of the change of M2 sample to its donor specific M1 sample to account for the heterogeneity of different human donors. The bar graphs indicate the average gene expression with error bars indicating the standard deviation. Paired student t-test was used to calculate p-value with statistical significance being < 0.05.
Figure 6).
Figure 6).
M2 macrophage have higher antioxidant enzyme expression and activity compared to M1. (A) Antioxidant gene expression was measured using rt-qPCR to determine differences between M1 and M2 macrophages. Analysis of gene expression was performed using N = 3–4 donors. (B) Western blot analysis of antioxidant genes indicating the differential protein levels between M1 and M2 macrophages from 4 different donors. (C) Densitometry analysis of Gpx1, Gpx4, MnSOD, and Cu/ZnSOD compared to the loading control, RhoGDI. The line graphs indicate the relative difference between M1 and M2 samples of each individual donor. (D) In-gel activity assays for Gpx and SOD proteins using M1 and M2 whole cell lysate. (E) Densitometry analysis of Gpx and SOD in-gel activity assays. Paired student t-test was used to calculate p-value with statistical significance being < 0.05.
Figure 7)
Figure 7)
ROS is a required secondary messenger during IL-4 stimulated M2 polarization. (A) Flow cytometry analysis of ROS levels using DCFH in M1 and M2 macrophages from 4 different donors treated with or without 15 μM MnTE. (B) Bar graph depicting the relative change in extracellular H2O2 levels in control versus 15 μM MnTE treated M1 and M2 macrophages from 4 different donors. (C, D) Measurement of M2 mRNA markers 24 hours after addition of IL-4. Macrophages were treated with either (C) DMSO or 10 μM DPI for 1 hour before addition of IL-4 or (D) exogenous H2O2 immediately after addition of IL-4. (E, F) Macrophages were treated with MnTE at different times throughout the differentiation and polarization protocol. (E) Diagram indicating the M2 polarization protocol with arrows indicating when MnTE was added in the different samples. (F) Relative M2 mRNA marker expression of macrophages compared to untreated control measured 48 hours after addition of IL-4. Error bars are the standard error of the mean. A paired student t-test was used to calculate the displayed p-values for figures 7A, 7B, and 7C. A one-way ANOVA and a post-hoc Tukey test was performed for figures 7D and 7F. Symbols indicate significance between the M2 control group and the indicated treatment group (* < 0.05, $ < 0.005, # < 0.0005).
Figure 8)
Figure 8)
MnTE inhibits Stat3 activation. (A-C) Western blot analysis of p-Stat3, total Stat3, and loading control GAPDH in macrophages from different donors treated with MnTE or DPI. Macrophages were serum starved overnight before IL-4 addition. Macrophages were stimulated with IL-4 for varying time points indicated above each lane. The densitometry indicating the relative p-Stat3/total Stat3 ratio is include below the total Stat3 blot. (A) Macrophages were treated with PBS or MnTE (5 μM or 15 μM) throughout differentiation and IL-4 stimulation. (B) Macrophages were treated with PBS or MnTE (15 μM) 1 hour before addition of IL-4. (C) Macrophages were treated with DMSO or DPI (10 μM) for 1 hour before stimulation with IL-4.

Similar articles

Cited by

References

    1. Murray Peter J., et al., Macrophage Activation and Polarization: Nomenclature and Experimental Guidelines. Immunity, 2014. 41(1): p. 14–20. - PMC - PubMed
    1. Martinez FO and Gordon S, The M1 and M2 paradigm of macrophage activation: time for reassessment. F1000prime reports, 2014. 6: p. 13–13. - PMC - PubMed
    1. Leek RD, et al., Association of Macrophage Infiltration with Angiogenesis and Prognosis in Invasive Breast Carcinoma. Cancer Research, 1996. 56(20): p. 4625–4629. - PubMed
    1. Mantovani A, et al., Tumour-associated macrophages as treatment targets in oncology. Nature Reviews Clinical Oncology, 2017. 14: p. 399. - PMC - PubMed
    1. Bingle L, Brown NJ, and Lewis CE, The role of tumour-associated macrophages in tumour progression: implications for new anticancer therapies. J Pathol, 2002. 196(3): p. 254–65. - PubMed

Publication types

Substances