

Evaluation of a conducting elastomeric composite material for intramuscular electrode application
- PMID: 31863910
- PMCID: PMC7996067
- DOI: 10.1016/j.actbio.2019.12.021
Evaluation of a conducting elastomeric composite material for intramuscular electrode application
Abstract
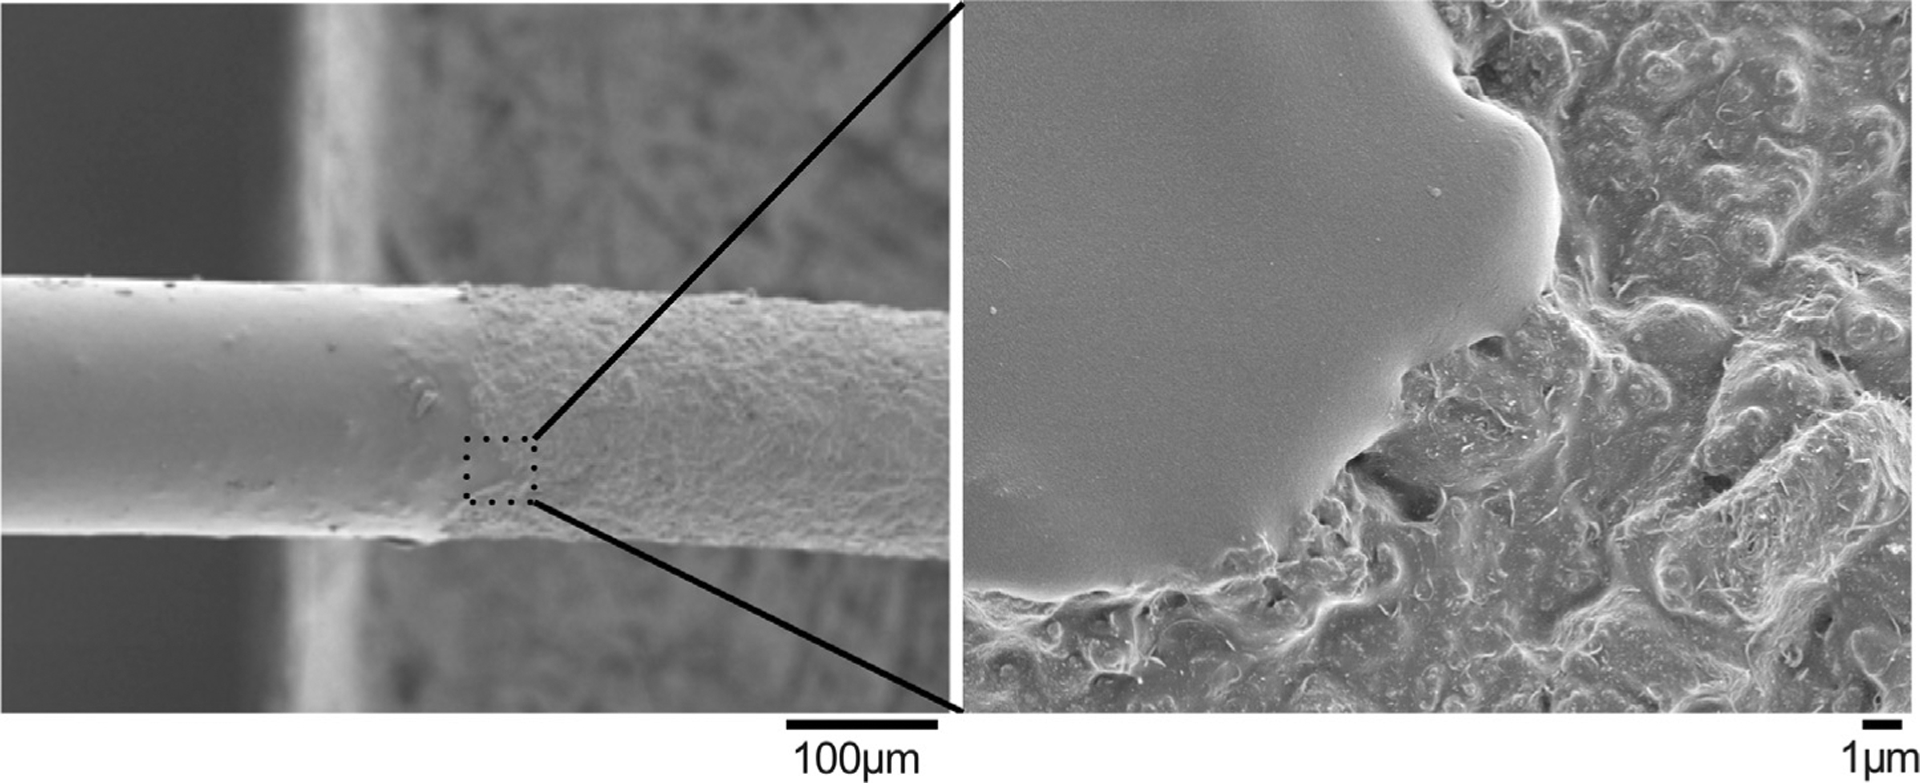
Electrical stimulation of the muscle has been proven efficacious in preventing atrophy and/or reanimating paralyzed muscles. Intramuscular electrodes made from metals have significantly higher Young's Moduli than the muscle tissues, which has the potential to cause chronic inflammation and decrease device performance. Here, we present an intramuscular electrode made from an elastomeric conducting polymer composite consisting of PEDOT-PEG copolymer, silicone and carbon nanotubes (CNT) with fluorosilicone insulation. The electrode wire has a Young's modulus of 804 (±99) kPa, which better mimics the muscle tissue modulus than conventional stainless steel (SS) electrodes. Additionally, the non-metallic composition enables metal-artifact free CT and MR imaging. These soft wire (SW) electrodes present comparable electrical impedance to SS electrodes of similar geometric surface area, activate muscle at a lower threshold, and maintain stable electrical properties in vivo up to 4 weeks. Histologically, the SW electrodes elicited significantly less fibrotic encapsulation and less IBA-1 positive macrophage accumulation than the SS electrodes at one and three months. Further phenotyping the macrophages with the iNOS (pro-inflammatory) and ARG-1 (pro-healing) markers revealed significantly less presence of pro-inflammatory macrophage around SW implants at one month. By three months, there was a significant increase in pro-healing macrophages (ARG-1) around the SW implants but not around the SS implants. Furthermore, a larger number of AchR clusters closer to SW implants were found at both time points compared to SS implants. These results suggest that a softer implant encourages a more intimate and healthier electrode-tissue interface. STATEMENT OF SIGNIFICANCE: Intramuscular electrodes made from metals have significantly higher Young's Moduli than the muscle tissues, which has the potential to cause chronic inflammation and decrease device performance. Here, we present an intramuscular electrode made from an elastomeric conducting polymer composite consisting of PEDOT-PEG copolymer, silicone and carbon nanotubes with fluorosilicone insulation. This elastomeric composite results in an electrode wire with a Young's modulus mimicking that of the muscle tissue, which elicits significantly less foreign body response compared to stainless steel wires. The lack of metal in this composite also enables metal-artifact free MRI and CT imaging.
Keywords: Conducting polymer; Foreign body response; Intramuscular electrodes.
Copyright © 2019. Published by Elsevier Ltd.
Conflict of interest statement
Declaration of Competing Interest
Authors have no conflict of interests to declare.
Figures


Similar articles
-
Ultrasoft microwire neural electrodes improve chronic tissue integration.Acta Biomater. 2017 Apr 15;53:46-58. doi: 10.1016/j.actbio.2017.02.010. Epub 2017 Feb 6. Acta Biomater. 2017. PMID: 28185910 Free PMC article.
-
Elastomeric and soft conducting microwires for implantable neural interfaces.Soft Matter. 2015 Jun 28;11(24):4847-61. doi: 10.1039/c5sm00174a. Epub 2015 May 20. Soft Matter. 2015. PMID: 25993261 Free PMC article.
-
Soft Conducting Elastomer for Peripheral Nerve Interface.Adv Healthc Mater. 2019 May;8(9):e1801311. doi: 10.1002/adhm.201801311. Epub 2019 Mar 6. Adv Healthc Mater. 2019. PMID: 30843365
-
The role of materials biocompatibility for functional electrical stimulation applications.Artif Organs. 2011 Mar;35(3):237-41. doi: 10.1111/j.1525-1594.2011.01221.x. Artif Organs. 2011. PMID: 21401666 Review.
-
Electrochemical polymerization of conducting polymers in living neural tissue.J Neural Eng. 2007 Jun;4(2):L6-L13. doi: 10.1088/1741-2560/4/2/L02. Epub 2007 Feb 2. J Neural Eng. 2007. PMID: 17409471 Review.
Cited by
-
Stretchable, Fully Polymeric Electrode Arrays for Peripheral Nerve Stimulation.Adv Sci (Weinh). 2021 Feb 5;8(8):2004033. doi: 10.1002/advs.202004033. eCollection 2021 Apr. Adv Sci (Weinh). 2021. PMID: 33898185 Free PMC article.
-
Electrical stimulation with polypyrrole-coated polycaprolactone/silk fibroin scaffold promotes sacral nerve regeneration by modulating macrophage polarisation.Biomater Transl. 2024 Jun 28;5(2):157-174. doi: 10.12336/biomatertransl.2024.02.006. eCollection 2024. Biomater Transl. 2024. PMID: 39351163 Free PMC article.
-
Accurate and stable chronic in vivo voltammetry enabled by a replaceable subcutaneous reference electrode.iScience. 2022 Aug 2;25(8):104845. doi: 10.1016/j.isci.2022.104845. eCollection 2022 Aug 19. iScience. 2022. PMID: 35996579 Free PMC article.
-
Carbon Nanomaterials Embedded in Conductive Polymers: A State of the Art.Polymers (Basel). 2021 Feb 27;13(5):745. doi: 10.3390/polym13050745. Polymers (Basel). 2021. PMID: 33673680 Free PMC article. Review.
References
-
- Erika Scremin AM, Kurta L, Gentili A, Wiseman B, Perell K, Kunkel C, Scremin OU, Increasing muscle mass in spinal cord injured persons with a functional electrical stimulation exercise program, Arch. Phys. Med. Rehabil 80 (12) (1999) 1531–1536. - PubMed
Publication types
MeSH terms
Substances
Grants and funding
LinkOut - more resources
Full Text Sources
Research Materials
Miscellaneous
