

Interim effect evaluation of the hepatitis C elimination programme in Georgia: a modelling study
- PMID: 31864917
- PMCID: PMC7025283
- DOI: 10.1016/S2214-109X(19)30483-8
Interim effect evaluation of the hepatitis C elimination programme in Georgia: a modelling study
Abstract
Background: Georgia has a high prevalence of hepatitis C, with 5·4% of adults chronically infected. On April 28, 2015, Georgia launched a national programme to eliminate hepatitis C by 2020 (90% reduction in prevalence) through scaled-up treatment and prevention interventions. We evaluated the interim effect of the programme and feasibility of achieving the elimination goal.
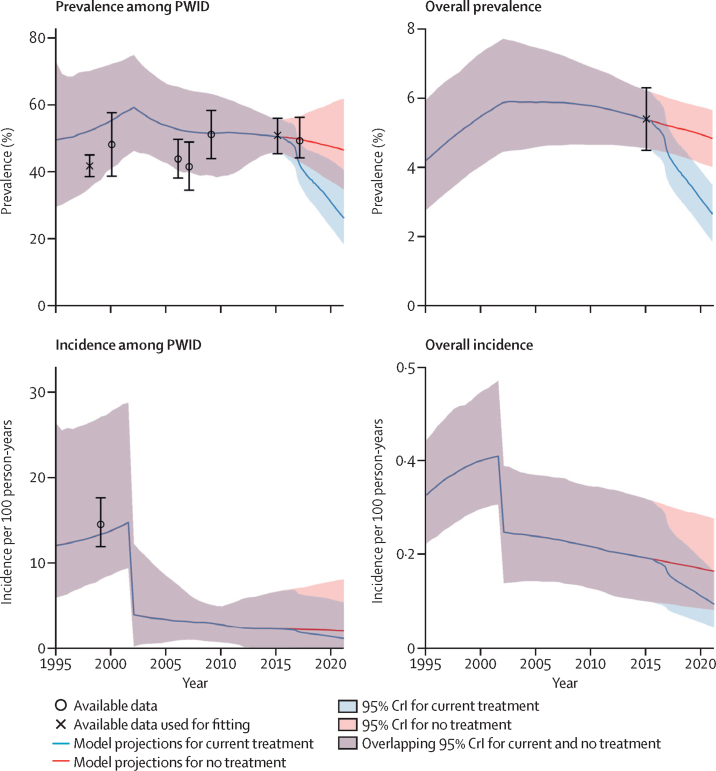
Methods: We developed a transmission model to capture the hepatitis C epidemic in Georgia, calibrated to data from biobehavioural surveys of people who inject drugs (PWID; 1998-2015) and a national survey (2015). We projected the effect of the administration of direct-acting antiviral treatments until Feb 28, 2019, and the effect of continuing current treatment rates until the end of 2020. Effect was estimated in terms of the relative decrease in hepatitis C incidence, prevalence, and mortality relative to 2015 and of the deaths and infections averted compared with a counterfactual of no treatment over the study period. We also estimated treatment rates needed to reach Georgia's elimination target.
Findings: From May 1, 2015, to Feb 28, 2019, 54 313 patients were treated, with approximately 1000 patients treated per month since mid 2017. Compared with 2015, our model projects that these treatments have reduced the prevalence of adult chronic hepatitis C by a median 37% (95% credible interval 30-44), the incidence of chronic hepatitis C by 37% (29-44), and chronic hepatitis C mortality by 14% (3-30) and have prevented 3516 (1842-6250) new infections and averted 252 (134-389) deaths related to chronic hepatitis C. Continuing treatment of 1000 patients per month is predicted to reduce prevalence by 51% (42-61) and incidence by 51% (40-62), by the end of 2020. To reach a 90% reduction by 2020, treatment rates must increase to 4144 (2963-5322) patients initiating treatment per month.
Interpretation: Georgia's hepatitis C elimination programme has achieved substantial treatment scale-up, which has reduced the burden of chronic hepatitis C. However, the country is unlikely to meet its 2020 elimination target unless treatment scales up considerably.
Funding: CDC Foundation, National Institute for Health Research, National Institutes of Health.
Copyright © 2020 The Author(s). Published by Elsevier Ltd. This is an Open Access article under the CC BY-NC-ND 4.0 license. Published by Elsevier Ltd.. All rights reserved.
Figures


Comment in
-
Evaluating the impact of Georgia's hepatitis C elimination plan: lessons learned for the global initiative.Lancet Glob Health. 2020 Feb;8(2):e163-e164. doi: 10.1016/S2214-109X(19)30537-6. Epub 2019 Dec 18. Lancet Glob Health. 2020. PMID: 31864918 No abstract available.
References
-
- Thein HH, Yi Q, Dore GJ, Krahn MD. Estimation of stage-specific fibrosis progression rates in chronic hepatitis C virus infection: a meta-analysis and meta-regression. Hepatology. 2008;48:418–431. - PubMed
-
- Graham CS, Swan T. A path to eradication of hepatitis C in low- and middle-income countries. Antiviral Res. 2015;119:89–96. - PubMed
-
- Degenhardt L, Charlson F, Stanaway J. Estimating the burden of disease attributable to injecting drug use as a risk factor for HIV, hepatitis C, and hepatitis B: findings from the Global Burden of Disease Study 2013. Lancet Infect Dis. 2016;16:1385–1398. - PubMed
Publication types
MeSH terms
Grants and funding
LinkOut - more resources
Full Text Sources
Miscellaneous
