Meta-Analysis
. 2020 Feb;47(1):19-45.
doi: 10.1007/s10928-019-09666-z. Epub 2019 Dec 21.

Comparison of the gamma-Pareto convolution with conventional methods of characterising metformin pharmacokinetics in dogs

Affiliations
Meta-Analysis

Comparison of the gamma-Pareto convolution with conventional methods of characterising metformin pharmacokinetics in dogs

Carl A Wesolowski et al. J Pharmacokinet Pharmacodyn. 2020 Feb.

Abstract

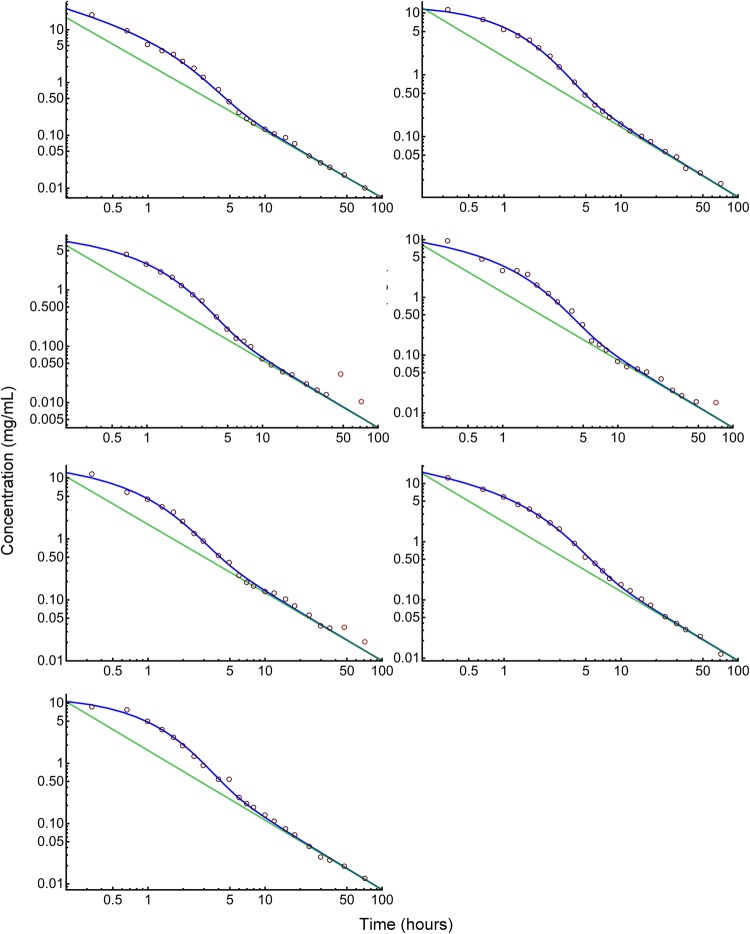
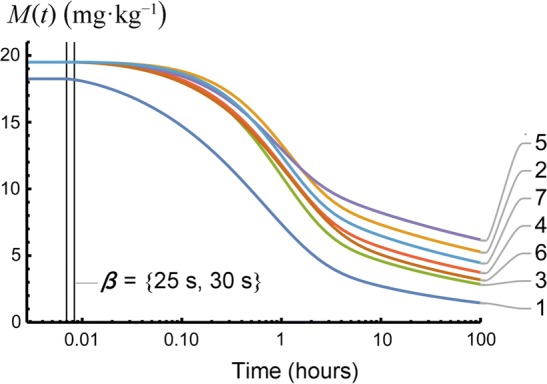
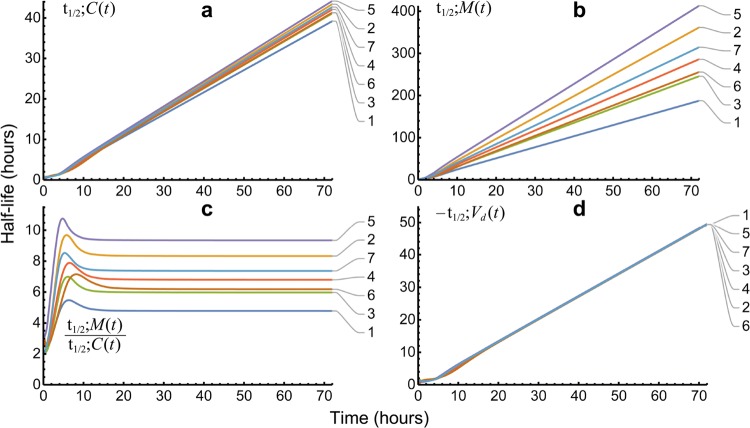
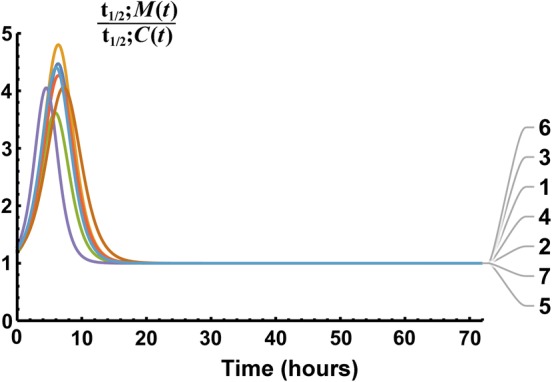
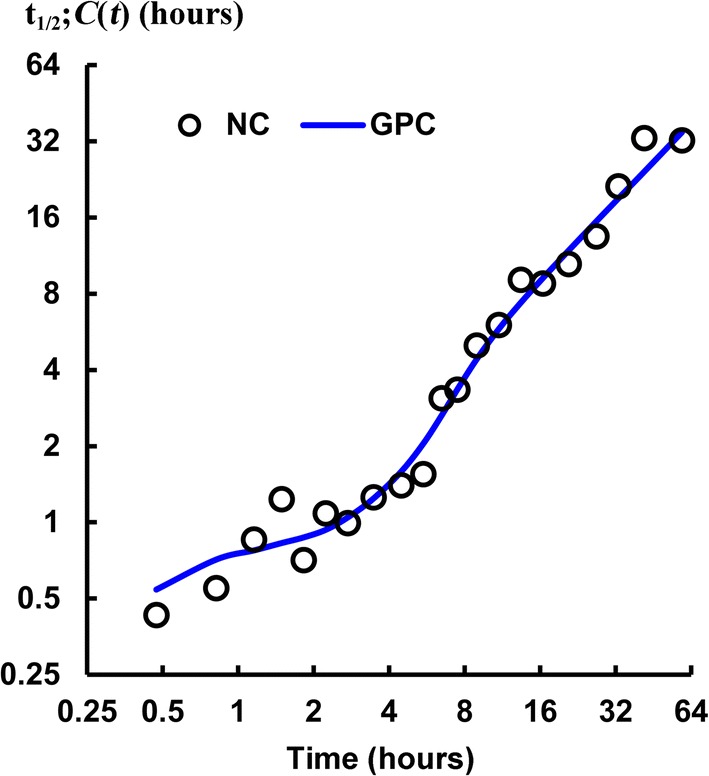
A model was developed for long term metformin tissue retention based upon temporally inclusive models of serum/plasma concentration ([Formula: see text]) having power function tails called the gamma-Pareto type I convolution (GPC) model and was contrasted with biexponential (E2) and noncompartmental (NC) metformin models. GPC models of [Formula: see text] have a peripheral venous first arrival of drug-times parameter, early [Formula: see text] peaks and very slow washouts of [Formula: see text]. The GPC, E2 and NC models were applied to a total of 148 serum samples drawn from 20 min to 72 h following bolus intravenous metformin in seven healthy mongrel dogs. The GPC model was used to calculate area under the curve (AUC), clearance ([Formula: see text]), and functions of time, f(t), for drug mass remaining (M), apparent volume of distribution ([Formula: see text]), as well as [Formula: see text] for [Formula: see text], [Formula: see text] and [Formula: see text]. The GPC models of [Formula: see text] yielded metformin [Formula: see text]-values that were 84.8% of total renal plasma flow (RPF) as estimated from meta-analysis. The GPC [Formula: see text]-values were significantly less than the corresponding NC and E2 [Formula: see text]-values of 104.7% and 123.7% of RPF, respectively. The GPC plasma/serum only model predicted 78.9% drug [Formula: see text] average urinary recovery at 72 h; similar to prior human urine drug [Formula: see text] collection results. The GPC model [Formula: see text] of [Formula: see text], [Formula: see text] and [Formula: see text], were asymptotically proportional to elapsed time, with a constant limiting [Formula: see text] ratio of M/C averaging 7.0 times, a result in keeping with prior simultaneous [Formula: see text] and urine [Formula: see text] collection studies and exhibiting a rate of apparent volume growth of [Formula: see text] that achieved limiting constant values. A simulated constant average drug mass multidosing protocol exhibited increased [Formula: see text] and [Formula: see text] with elapsing time, effects that have been observed experimentally during same-dose multidosing. The GPC heavy-tailed models explained multiple documented phenomena that were unexplained with lighter-tailed models.

Keywords: Clearance; Drug mass; Loading dose regimen; Mathematical modelling pdf; Metformin; Pharmacokinetics; Serum concentration.


Figures

Fig. 1
Fig. 1
Log-log profiles of metformin concentrations versus time in seven dogs. The black circles are data. The red circles are the five samples left out following outlier testing. The blue curves are the GPC concentration models and the green lines are the Pareto (power function) asymptotes of the GPC models. Note the maximum distance between the blue and green curves at 1–2 h. That is the peak effect time of GD convolution. At those times, the convolution of GD function’s slow mixing increased the PD function magnitude several fold
Fig. 2
Fig. 2
This shows the early time pdf, i.e., each having an AUC of 1, of the GPC model (blue) and the gamma density (GD, in red) for dog 5. The GD is shown truncated at its top, and is the faster decaying of two GPC constituent functions. Note that the GPC starts a small time (25 s here) later than the GD, and the GD is less than the GPC for late time
Fig. 3
Fig. 3
GPC fit relative errors (± is over/under estimate) plotted for sample-time groups in temporal sequence. Note the normal distribution of error, the narrow the 95% confidence intervals, and the closeness to zero error of the connected black circles of mean values for samples. The red connected circles are mean values of 5 left-out samples
Fig. 4
Fig. 4
E2 fit relative errors (± is over/under estimate) plotted for sequential samples groups. Note the skewed distribution of error, the wide 95% confidence intervals, and the M-shaped variation of the connected black circles of mean values for samples. The mean values of 5 noisy samples left out not shown
Fig. 5
Fig. 5
An example E2 fit to data (dog 6, blue curve). The black circles are the time samples. The approximate times for correct E2 slopes are shown at the point of tangency of the log-log tangent red line segments. Note the M-shaped wandering of the E2 function above and below the data locations, and especially the underestimation of sample concentration as well as incorrect slopes below the earliest and latest time samples
Fig. 6
Fig. 6
Linear-log plot of metformin (as base) mass retained in seven dogs as calculated from D·S(t) of the GPCC(t) model. Note how the dose (in mg per kg body weight) is retained in time. Note the constant mass until the Pareto density scale, β; the vascular first transit times of the models, occurred at 25 or 30 s. Dog 1 received a lesser dosage than the other dogs, and also rapidly cleared mass
Fig. 7
Fig. 7
GPC model t1/2 functions of time. Panel a shows t1/2;C(t); tightly grouped concentration t1/2 functions. Panel b shows t1/2;M(t); more dispersed drug mass t1/2 functions. Panel c shows the ratios of t1/2;M(t) to t1/2;C(t) converged to a mean of 7.0× by 10h. Panel d shows that the (negative) half-life of Vd(t) became proportional to ln2t, by 20h
Fig. 8
Fig. 8
Shown are E2 mass and concentration half-life ratios for metformin in seven dogs. Note the convergence of these ratios to 1 after approximately 21 h. In effect, the two compartments function as a single compartment after that time and volume growth collapsed to trace amounts
Fig. 9
Fig. 9
This shows how the noncompartmental (NC) median half-lives of seven dogs vary with predicted median GPC model half-lives. The NC median t1/2;C(t) model values are shown as black circles. These are discrete serum concentration half-lives from adjacent time sample groups. Each pair of adjacent time sample-groups exhibited a different half-life with a definite overall trend for increased half-life for increasing time of measurement. More robust results were obtained from the continuous median GPC concentration half-life curve (blue) from all seven dogs
Fig. 10
Fig. 10
Shown are constant infusion simulations from a biexponential bolus model (left panel) a GPC bolus model (right panel) from dog 6 data. Each steady state concentration CSS is plotted as 100% (red lines). As seen in the figure, at 72 h the biexponential model is already at 99.1% of CSS, whereas the GPC model is only at 82.6% at that same time
Fig. 11
Fig. 11
Semi-log plot of dog 6 simulations of Q12 h IV metformin multidosing for unit mean dose mass in the body. The amplitude of peak-to-trough ratio decreased markedly with time from 7.1 during the first dose interval to 1.5 during the 84–96 h dose interval. See text for the constant mass loading dose regimen
Fig. 12
Fig. 12
This simulation (dog 4 simulation 17) had a GPC fit error of 14.0%, the second worst fit error in the series of 35 simulations. The original data are shown as red circles, and the bootstrap resampling of residuals are shown as black circles. The blue curve is the GPC simulation model fit, and the green line is the limiting Pareto distribution tail

References

    1. Johnston CA, Dickinson VSM, Alcorn J, Gaunt MC. Pharmacokinetics and oral bioavailability of metformin hydrochloride in healthy mixed-breed dogs. Am J Vet Res. 2017;78(10):1193–1199. - PubMed
    1. Wypij JM. Pilot study of oral metformin in cancer-bearing cats. Vet Comp Oncol. 2017;15(2):345–354. - PubMed
    1. Andrzejewski S, Gravel SP, Pollak M, St-Pierre J. Metformin directly acts on mitochondria to alter cellular bioenergetics. Cancer Metab. 2014;2(1):12. - PMC - PubMed
    1. Xie F, Ke AB, Bowers GD, Zamek-Gliszczynski MJ. Metformin’s intrinsic blood-to-plasma partition ratio (B/P): reconciling the perceived high in vivo B/P>10 with the in vitro equilibrium value of unity. J Pharmacol Exp Ther. 2015;354(2):225–229. - PubMed
    1. Kajbaf F, Bennis Y, Hurtel-Lemaire AS, Andréjak M, Lalau JD. Unexpectedly long half-life of metformin elimination in cases of metformin accumulation. Diabet Med. 2016;33(1):105–110. doi: 10.1111/dme.12959. - DOI - PubMed

Publication types