. 2020 Jan 9;180(1):122-134.e10.
doi: 10.1016/j.cell.2019.11.041. Epub 2019 Dec 19.

Structure of the Cardiac Sodium Channel

Affiliations

Structure of the Cardiac Sodium Channel

Daohua Jiang et al. Cell. .

Abstract

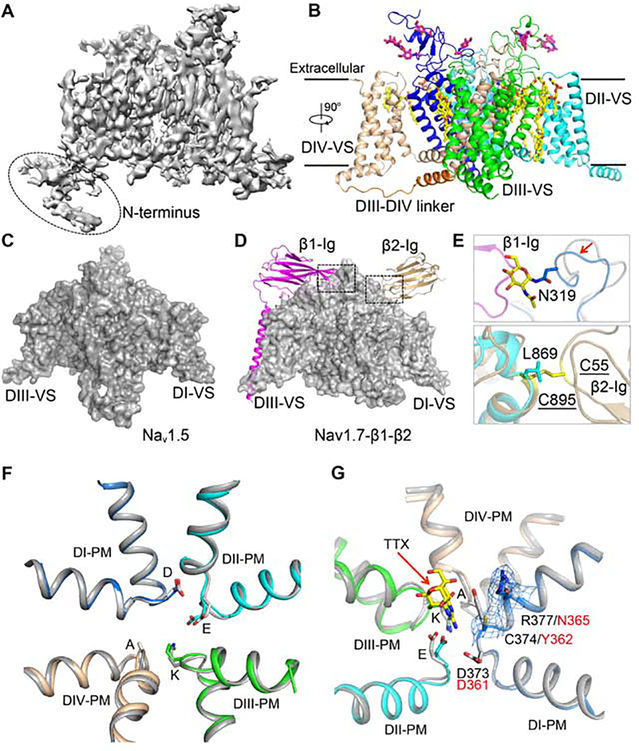
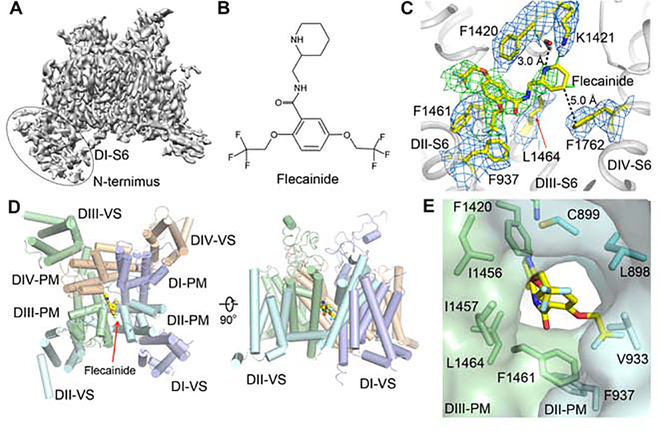
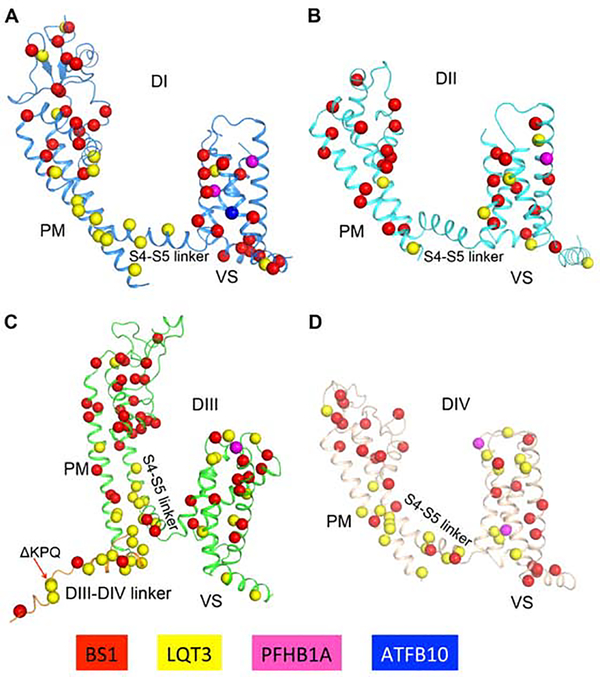
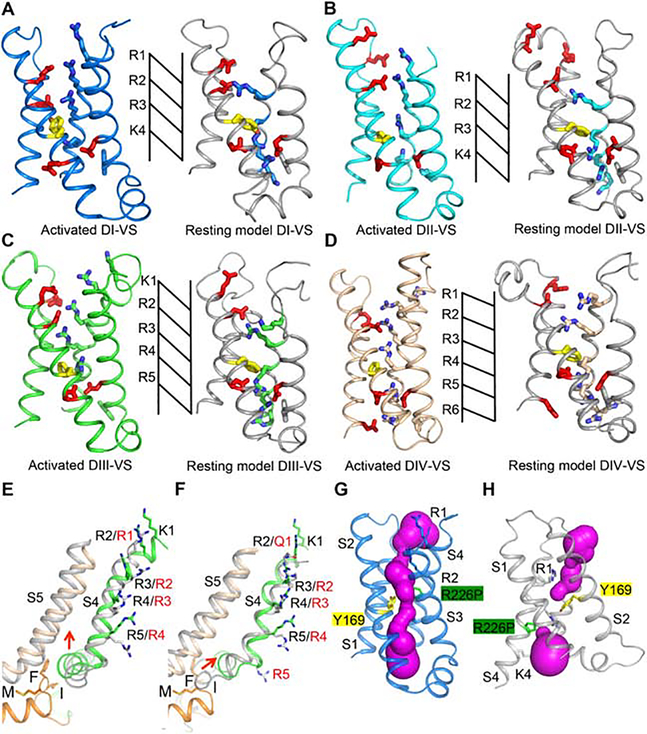
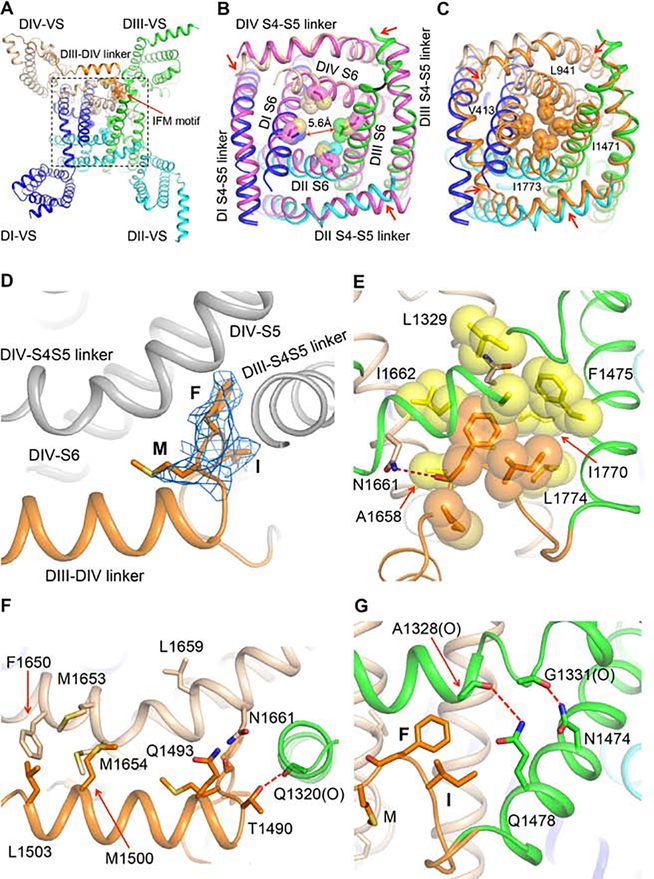
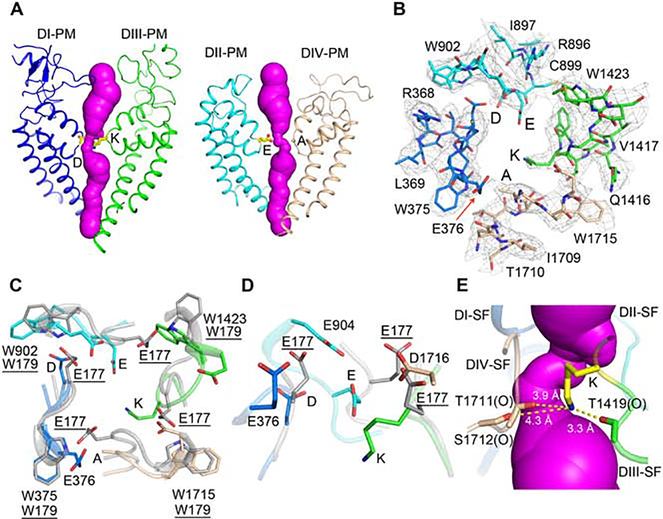
Voltage-gated sodium channel Nav1.5 generates cardiac action potentials and initiates the heartbeat. Here, we report structures of NaV1.5 at 3.2-3.5 Å resolution. NaV1.5 is distinguished from other sodium channels by a unique glycosyl moiety and loss of disulfide-bonding capability at the NaVβ subunit-interaction sites. The antiarrhythmic drug flecainide specifically targets the central cavity of the pore. The voltage sensors are partially activated, and the fast-inactivation gate is partially closed. Activation of the voltage sensor of Domain III allows binding of the isoleucine-phenylalanine-methionine (IFM) motif to the inactivation-gate receptor. Asp and Ala, in the selectivity motif DEKA, line the walls of the ion-selectivity filter, whereas Glu and Lys are in positions to accept and release Na+ ions via a charge-delocalization network. Arrhythmia mutation sites undergo large translocations during gating, providing a potential mechanism for pathogenic effects. Our results provide detailed insights into Nav1.5 structure, pharmacology, activation, inactivation, ion selectivity, and arrhythmias.

Keywords: antiarrhytymic drugs; cryoelectron microscopy arrhythmia; fast inactivation; gating pore current; heart; sodium channel; sodium selectivity.


Conflict of interest statement

Declaration of interests

The authors declare no competing interests.

Figures

Figure 1.
Figure 1.. Cryo-EM Structure of rNaV1.5C
(A) Side view of the overall cryo-EM reconstruction of the rNaV1.5C. (B) Cartoon representation of the overall structure of the rNaV1.5C. DI, DII, DIII, DIII-DIV linker, and DIV were colored blue, cyan, green, orange and wheat, respectively. The same color scheme is applied hereafter in this manuscript unless specified otherwise. The glycosyl moieties, lipids, and detergents shown in sticks are colored in magenta and yellow, respectively. (C) Side view of rNaV1.5C with surface colored in grey. (D) Side view of human NaV1.7-β1-β2 complex shown in grey surface for the α-subunit and in cartoons for β1 and β2 subunits colored in magenta and gold, respectively. (E) Close-up view of β1 (Top panel) and β2 (Bottom panel) binding sites. (F) SF alignment between rNaV1.5C and NaV1.7 (Grey). The side chains of the DEKA motif (DEKA: Asp373-Glu901-Lys1421-Ala1713) are shown in sticks. (G) Comparison of the SF of the TTX-resistant rNaV1.5c (colored) and the TTX-sensitive human NaV1.7 (grey) with TTX bound. Cys374 and Arg377 are shown with electron density mesh presented at 3 a. TTX is shown in yellow. DEKA: Asp373-Glu901-Lys1421-Ala1713.
Figure 2.
Figure 2.. The Cryo-EM Structure of rNaV1.5C and Flecainide Complex
(A) Side view of the overall cryo-EM reconstruction of the rNaV1.5C and flecainide complex. (B) Chemical structure of flecainide. (C) EM density for flecainide binding pocket with key residues for flecainide binding shown in yellow sticks. The densities for the residues and flecainide were countered at 3 σ and colored in blue and green, respectively. (D) Top and side view of rNaV1.5C structure with flecainide shown in yellow sticks. (E) Side view of DII-DIII fenestration.
Figure 3.
Figure 3.. Molecular Mapping of Arrhythmia Mutations.
(A-D). Arrhythmia related mutations are located on DI, DII, DIII and DIV. Mutation sites are shown in sticks for BS1, LQT3, PFHB1A and ATFB10 colored in red, yellow, magenta and blue, respectively.
Figure 4.
Figure 4.. Structural Comparison of the DI-DIV VS in Activated and Resting States
(A-D) Structures of each of the four VS and the corresponding resting state models. Resting models are colored in grey. Key residues are shown with sidechains in sticks. Arg and Lys gating charges are colored blue, Glu residues in the ENC and INC are colored red, and the key Phe in the HCS is colored yellow. Extracellular Negative Cluster (ENC): DI, Asn145, Glu162; DII, Glu738, Glu747, Asn754; DIII, Glu1227, Glu1242, Asp1245; DIV, Glu1550, Asp1556. Intracellular Negative Cluster (INC): DI, Glu172, Asp198; DII, Glu764, Asp786; DIII, Glu1255, Asp1277; DIV, Asp1533, Glu1576, Asp1597. (E) The VS of rNaV1.5C DIII aligned with the VS of the open-state structure of NavAb-Δ40 (PDB code: 5VB8) shown in grey. (F) The VS of rNaV1.5C DIII aligned with the VS of DIII of NavPas in grey (PDB code: 6A90). (G) Structure of the activated state of the VS of DI with the R226P mutation in green. Brugada Syndrome target residue Y169 is nearby in yellow. Water-accessible space calculated by MOLE2 is shown in magenta. (H) Structure of the resting state of the VS of DI with the R226P mutation in green. Brugada Syndrome target residue Y169 is nearby in yellow. Water-accessible space calculated by MOLE2 is shown in magenta.
Figure 5.
Figure 5.. Activation and Fast Inactivation Gates.
(A) Bottom view of the rNaV1.5C intracellular activation gate. The IFM motif (Ile1485-Phe1486-Met1487) and the sidechains of amino acid residues that partially close the activation gate are shown in sticks with half-transparent van der Waals surface. (B) Close-up view of the rNaV1.5C intracellular activation gate aligned with the open-state structure of NavAb-Δ40 (PDB code: 5VB8) colored in magenta. (C) Close-up view of the NaV1.5C intracellular activation gate aligned with the resting state model of rNaV1.5C activation gate calculated by MODELLER based on the resting state structure of NavAb (PDB code: 6P6W). The resting model is colored in orange with key residues sealing the activation gate shown in sticks and half-transparent van der Waals surface. (D) Side view of the IFM motif shown in sticks with electron density mesh contoured at 3 σ. (E) Close-up view of IFM motif bound to the hydrophobic pocket shown in yellow. Dotted line in red, hydrogen bond. (F) Interaction of DIII-DIV linker with DIII and DIV S4-S5 linker. “(O)” indicates an important interaction with a backbone carbonyl group. Dotted line in red, hydrogen bond. (G) Interaction of DIII S6 with DIII S4-S5 linker. “(O)” indicates an important interaction with a backbone carbonyl group. Dotted lines in red, hydrogen bonds.
Figure 6.
Figure 6.. Structure of the Pore and the Ion Selectivity Filter.
(A) The open ion permeation path shown in magenta surface calculated by MOLE2. DI and DIII PM with Asp373 and Lys1421 shown in sticks (Left panel), DII and DIV PM with Glu901 and Ala1713 shown in sticks (Right panel). DEKA: Asp373-Glu901-Lys1421-Ala1713. (B) Top view of the rNaV1.5C SF with electron density shown in grey mesh contoured at 3 σ. (C) SF comparison of NaV1.5c and activated NavAb (PDB,3RVY) shown in grey. (D) Side view comparing the SF of rNaV1.5c and activated NavAb (PDB,3RVY). (E) The charge delocalization complex of Lys1421. Lys1421 side chain interacts with adjacent backbone carbonyl group of Thr1419, Thr1711 and Thr1712, which are indicated by “(O)”. Magenta surface represents the ion permeation pathway inside the SF.

Comment in

References

    1. Adams PD, Afonine PV, Bunkoczi G, Chen VB, Davis IW, Echols N, Headd JJ, Hung LW, Kapral GJ, Grosse-Kunstleve RW, et al. (2010). PHENIX: a comprehensive Python-based system for macromolecular structure solution. Acta Crystallogr D Biol Crystallogr 66, 213–221. - PMC - PubMed
    1. Anno T, and Hondeghem LM (1990). Interactions of flecainide with guinea pig cardiac sodium channels. Importance of activation unblocking to the voltage dependence of recovery. Circ Res 66, 789–803. - PubMed
    1. Armstrong CM, and Bezanilla F (1973). Currents related to movement of the gating particles of the sodium channels. Nature 242, 459–461. - PubMed
    1. Bankston JR, Yue M, Chung W, Spyres M, Pass RH, Silver E, Sampson KJ, and Kass RS (2007). A novel and lethal de novo LQT-3 mutation in a newborn with distinct molecular pharmacology and therapeutic response. PLoS One 2, e1258. - PMC - PubMed
    1. Baroudi G, Acharfi S, Larouche C, and Chahine M (2002). Expression and intracellular localization of an SCN5A double mutant R1232W/T1620M implicated in Brugada syndrome. Circ Res 90, E11–16. - PubMed

Publication types

MeSH terms