. 2020 Jan 9;180(1):79-91.e16.
doi: 10.1016/j.cell.2019.11.026. Epub 2019 Dec 19.

Serum Amyloid A Proteins Induce Pathogenic Th17 Cells and Promote Inflammatory Disease

Affiliations

Serum Amyloid A Proteins Induce Pathogenic Th17 Cells and Promote Inflammatory Disease

June-Yong Lee et al. Cell. .

Erratum in

Abstract

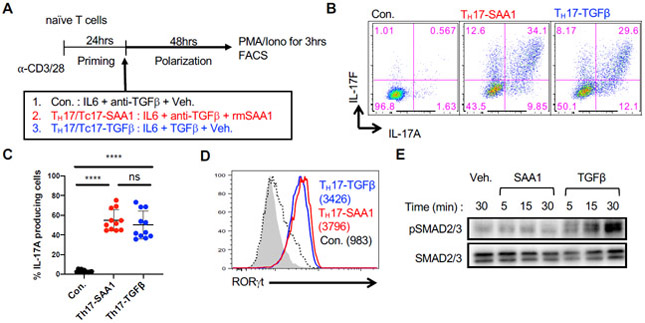
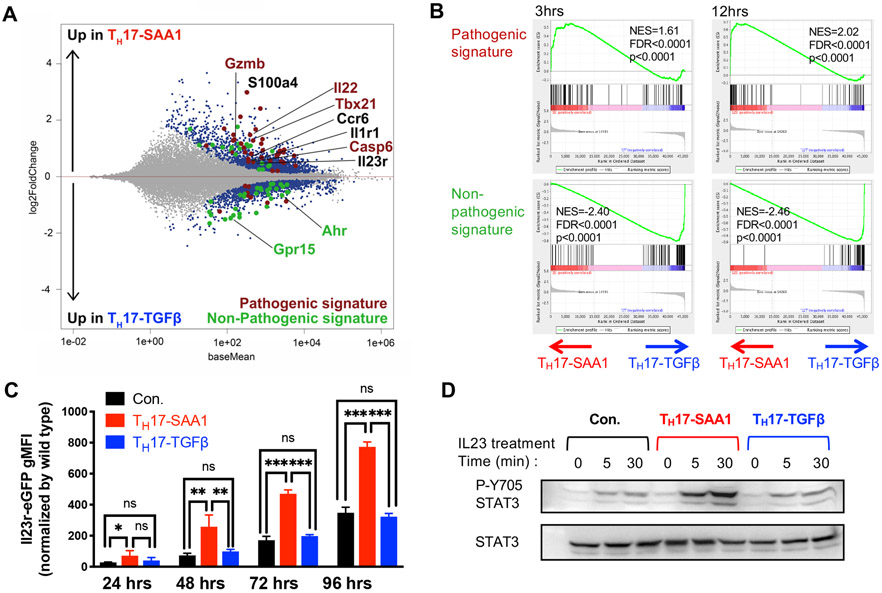
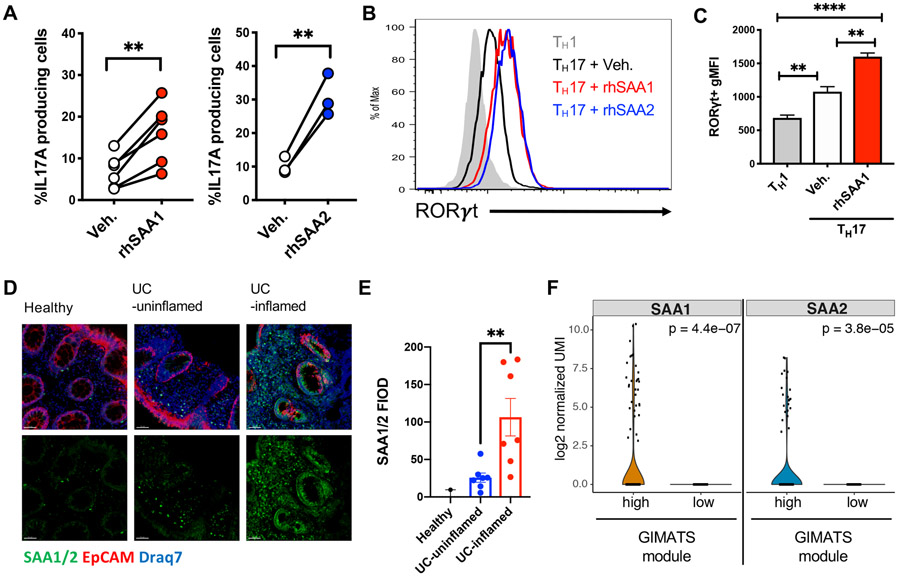
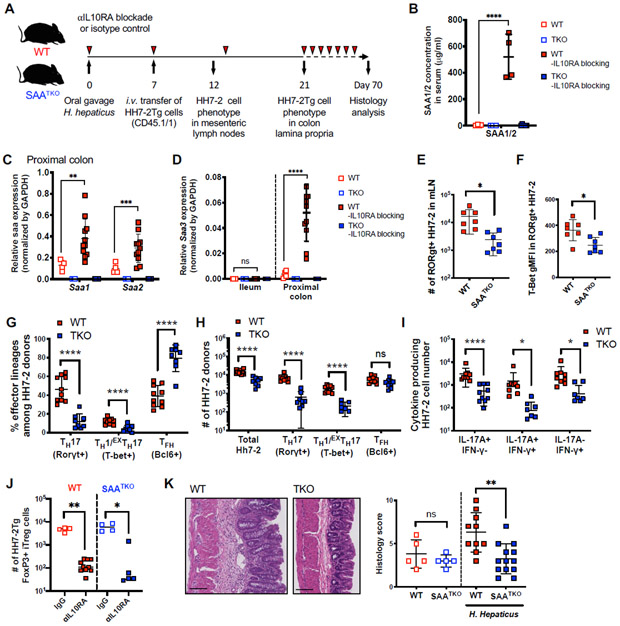
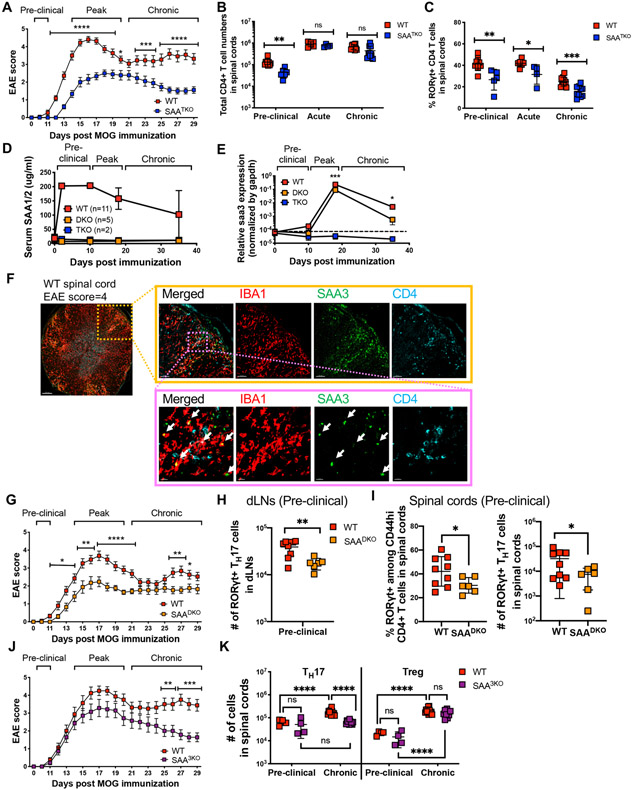
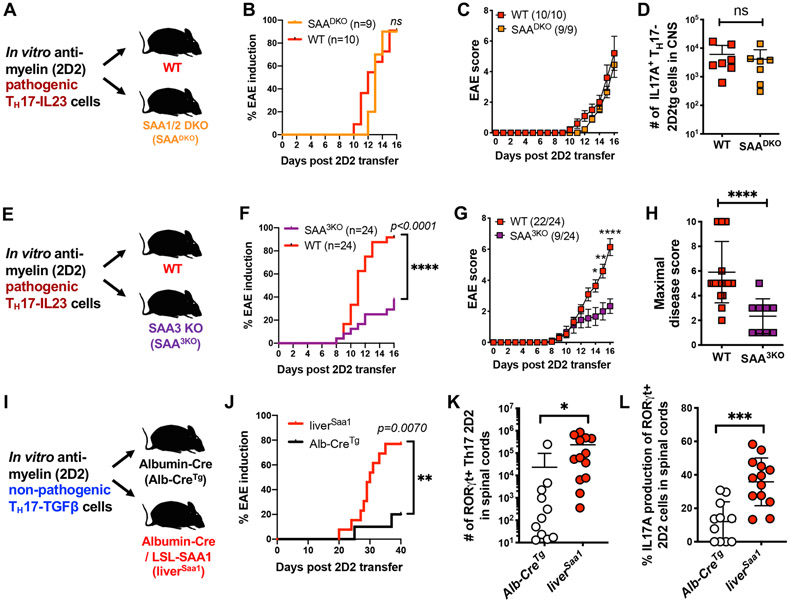
Lymphoid cells that produce interleukin (IL)-17 cytokines protect barrier tissues from pathogenic microbes but are also prominent effectors of inflammation and autoimmune disease. T helper 17 (Th17) cells, defined by RORγt-dependent production of IL-17A and IL-17F, exert homeostatic functions in the gut upon microbiota-directed differentiation from naive CD4+ T cells. In the non-pathogenic setting, their cytokine production is regulated by serum amyloid A proteins (SAA1 and SAA2) secreted by adjacent intestinal epithelial cells. However, Th17 cell behaviors vary markedly according to their environment. Here, we show that SAAs additionally direct a pathogenic pro-inflammatory Th17 cell differentiation program, acting directly on T cells in collaboration with STAT3-activating cytokines. Using loss- and gain-of-function mouse models, we show that SAA1, SAA2, and SAA3 have distinct systemic and local functions in promoting Th17-mediated inflammatory diseases. These studies suggest that T cell signaling pathways modulated by the SAAs may be attractive targets for anti-inflammatory therapies.

Keywords: EAE; Helicobacter hepaticus; IBD; IL-23; SFB; T cell transfer colitis; TGF-β; Th1(∗); acute phase reactant; chronic inflammation; experimental autoimmune encephalomyelitis; inflammatory bowel disease; segmented filamentous bacteria.


Conflict of interest statement

Declaration of Interests: The authors declare no competing interests.

Figures

Figure 1.
Figure 1.. SAAs act directly on mouse T cells to induce TH17 cell differentiation in vitro in absence of TGF-β.
(A) Experimental scheme for in vitro differentiation of naïve CD4+ or CD8+ T cells. (B and C) Flow cytometric analysis of IL-17A and IL-17F expression (B) and summary of IL-17A frequency (C) among re-stimulated cells. Summary of 3 experiments, with n = 11. Statistics were calculated using the unpaired two-sided Welch’s t-test. Error bars denote the mean ± s.d. ns = not significant, ****p < 0.0001. (D) RORγt expression in TH17 cells. Geometric mean fluorescence intensities (gMFI) are included in parentheses. Representative data of n > 10 experiments. (E) Immunoblotting for SMAD2/3 phosphorylation (pSMAD2/3) of primed CD4+ T cells upon rmSAA1 (10μg/ml) or TGF-β (1ng/ml) treatment for indicated times. Total SMAD2/3 is shown as a loading control. See also Figure S1.
Figure 2.
Figure 2.. SAA1 elicits a pathogenic TH17 program in vitro.
(A and B) RNA sequencing analysis of temporal gene expression in IL6 + αTGF-β + SAA1 (TH17-SAA1, n = 3) and IL6 + TGF-β (TH17-TGFβ n = 3) differentiated CD4+ T cells. (A) MA plot depicts differentially expressed (DE) genes of TH17-SAA1 versus TH17-TGFβ cells at 48h in vitro polarization. Colored dots are significant DE genes. Red dots or green dots highlight pathogenic or non-pathogenic TH17 signature genes, respectively. DE genes were calculated in DESeq2 using the Wald test with Benjamini-Hochberg correction to determine the false discovery rate (FDR < 0.01). (B) GSEA plots of pathogenic (top) or non-pathogenic (bottom) TH17 signatures amongst TH17-SAA1 and TH17-TGFβ gene sets. NES, normalized enrichment score. (C) Summary of eGFP expression in T cells from Il23reGFP mice following indicated condition and time of polarization. The gMFI of non-reporter, wild-type cells was subtracted from gMFI of eGFP to obtain the normalized gMFI. Representative data of two independent experiments. Statistics were calculated using the two-stage step-up method of Benjamini, Krieger and Yekutieliun. Error bars denote the mean ± s.d. ns = not significant, *p < 0.05, **p < 0.01, and ****p < 0.0001. (D) Amount of Y705 phosphorylated STAT3 following IL-23 treatment (10ng/ml) of TH17 cells differentiated under different conditions for indicated times. Total STAT3 is shown as a loading control. See also Figure S2.
Figure 3.
Figure 3.. Human SAA expression in inflamed tissue and induction of TH17 cell differentiation.
(A-C) Naïve human CD4+ T cells were isolated from cord blood and differentiated for 6 days in TH17 polarizing conditions ± recombinant human (rh) SAA1 or rhSAA2. (A) Summary of IL-17A production from in vitro polarized human TH17 cells. Connecting lines signify cells from the same donor. (B) Stacked histogram illustrates representative RORγT expression using the indicated polarizing conditions. (C) Summary of RORγT gMFI. Summary of 2 experiments with n = 6 donors for rhSAA1 and with n = 3 donors for rhSAA2. (D and E) Representative confocal images (D) and quantification of SAA1/2 by fluorescence integrated optical density (FIOD) levels (E) show prominent SAA expression in biopsies of inflamed tissue from ulcerative colitis (UC, n = 7) patients. Panels from left to right: Healthy (n = 2), UC-uninflamed, and UC-inflamed. Scale bar corresponds to 50μm. SAA1/2 (green), EPCAM (red) and nucleus (Draq7; blue). (F) Violin plots showing the log2 normalized UMI of SAA1 and SAA2 genes in the fibroblast cluster associated with the GIMATS module (IgG plasma cells, inflammatory MNP, activated T and stromal cells). Statistics were calculated using the paired two-tailed Student’s t-test. **p < 0.01, ****p < 0.0001. See also Figure S3.
Figure 4.
Figure 4.. SAAs drive pathogenic Th cell responses in IL-10 deficiency-dependent colitis.
(A) Experimental scheme to examine HH7-2tg cells in SAA1/2/3 triple knock-out (SAATKO) and WT littermate recipient mice colonized with H. hepaticus ± IL-10RA blockade (αIL10RA). (B) Serum concentrations of SAA1/2 of recipient mice at day 21 post H. hepaticus colonization. (C and D) Normalized expression of Saa1/2 in proximal colon (C) and Saa3 in ileum and colon (D) of recipient mice at day 21 post H. hepaticus colonization. (E and F) Characterization of HH7-2tg donor-derived cells 5 days post-adoptive transfer in mesenteric lymph nodes of recipient SAATKO (blue boxes, n = 8) and WT (red boxes, n = 10) littermates injected with αIL10RA. Number of RORγt expressing HH7-2 cells (E) and T-bet gMFI level in the RORγt+ HH7-2 cells (F). (G-J) Characterization of HH7-2tg donor-derived cells two weeks post-adoptive transfer in colon lamina propria of recipient mice injected with αIL10RA. Summary of 2 experiments with SAATKO (blue boxes, n = 8) and WT (red boxes, n = 10) littermates. Frequency (G) and number (H) of the indicated FoxP3 effector TH cells based on transcription factor expression as described in Figure S4A or cytokine expression after restimulation (I). Numbers of Foxp3+ iTreg cells in isotype-treated recipients (hollow boxes) versus αIL10RA-treated recipients (J). (K) Representative H&E staining (left) and summary of histology scores (right) of colon sections harvested from mice with or without H. hepaticus colonization, following twelve weeks of αIL10RA injection. Summary of two separate experiments is shown. Uncolonized mice (open boxes): WT + αIL10RA (red, n = 5), SAATKO + αIL10RA (blue, n = 5); or colonized with H. hepaticus (closed boxes): WT + αIL10RA (red, n = 10), SAATKO + αIL10RA (blue, n = 13). (B-F and K) Statistics were calculated using the unpaired two-sided Welch’s t-test. Error bars denote the mean ± s.d. ns = not significant, **p < 0.01, ***p < 0.001, and ****p < 0.0001. (G-J) Statistics were calculated using the two-stage step-up method of Benjamini, Krieger and Yekutieliun. Error bars denote the mean ± s.d. ns = not significant, *p < 0.05, ***p < 0.001, and ****p < 0.0001. See also Figure S4.
Figure 5.
Figure 5.. Distinct sources of SAAs promote and sustain autoimmune encephalomyelitis.
(A) Mean EAE scores of myelin oligodendrocyte glycoprotein (MOG)-immunized SAATKO (blue boxes, n = 18) and WT littermate mice (red boxes, n = 22). Summary of 3 experiments. (B and C) Number of CD4+ T cells (B) and frequency of RORγt+ TH17 cells among Foxp3Neg CD44hi CD4+ T cells (C) in the CNS of mice at the indicated stage of EAE. day 10 = preclinical, day 15 = acute, day 32 = chronic. Pre-clinical, (SAATKO = 6, WT = 9), acute, (SAATKO = 4, WT = 6) and Chronic, (SAATKO =10, WT = 11). Data combined two, two, and three experiments for the pre-clinical, acute, and chronic stages of disease, respectively. (D) Longitudinal mean serum concentrations of SAA1/2 in MOG-immunized mice. Error bars denote the s.d. (E) Normalized relative expression of Saa3 in CNS of MOG-immunized mice, measured by qPCR. Spinal cords were isolated at days 0, 10, 18, and 38 post-immunization. For WT, SAADKO, and SAATKO, the number of samples at each time point were 13, 7, and 13 (day 0); 5, 6, and 8 (day 10); 17, 11, and 10 (day 18); and 10, 3, 6 (day 38). (F) Representative confocal images of spinal cord cross section isolated from WT mouse (n = 2) at the peak of EAE (score 4) (6x (left), 20x (right top) and 80x (right bottom) magnification). IBA1 (red), SAA3 (green), and CD4 (aqua). White arrows indicate yellow regions with IBA1/SAA3 colocalization. (G) Mean EAE scores of MOG-immunized SAA1/2 DKO (SAADKO, orange boxes, n = 17) and WT littermate mice (red boxes, n = 19). Summary of 4 experiments. (H and I) Number of RORγt+ TH17 cells among CD44hi effector/memory CD4+ T cells isolated from draining lymph nodes (dLNs) (H) and spinal cord (I) of SAADKO (n = 6) or WT (n = 9) littermates at day 10 post immunization. (J) Mean EAE scores of MOG-immunized SAA3 KO (SAA3KO, purple boxes, n = 14) and WT littermate mice (red boxes, n = 16). Summary of 3 experiments. (K) Number of RORγt+ TH17 and Foxp3+ Treg cells at pre-clinical (day 10) and chronic (day 32) stages of EAE. Summary of 3 experiments, with SAA3KO (n = 14) and WT (n = 16) littermates. (A-C, E, G, J, and K) Statistics were calculated using the two-stage step-up method of Benjamini, Krieger and Yekutieliun. Error bars denote the mean ± s.e.m (A, G, and J) or mean ± s.d. (B, C, E, H, I, and K). *p < 0.05, **p < 0.01, ***p < 0.001, and ****p < 0.0001. (H and I) Statistics were calculated using the unpaired two-sided Welch’s t-test. Error bars denote the mean ± s.d. ns = not significant, *p < 0.05, **p < 0.01, ***p < 0.001, ****p < 0.0001. See also Figure S5.
Figure 6.
Figure 6.. SAA regulation of pathogenicity of in vitro-differentiated encephalitogenic TH17 cells
(A-D) Examination of EAE development and the 2D2tg cell response in SAADKO and WT littermate recipients of 2D2tg TH17-IL-23 cells. Summary of 2 experiments, with SAADKO (orange, n = 9) and WT (red, n = 10) mice. Experimental scheme (A), EAE incidence (B) and mean score (C), and number of 2D2tg IL17A+ TH17 cells in spinal cords (D). (E-H) Examination of EAE development and the 2D2tg cell response in SAA3KO and WT littermate recipients of 2D2tg TH17-IL-23 cells. Summary of 4 experiments, with SAA3KO (purple, n = 24) and WT (red, n = 24) mice. Experimental scheme (E), EAE incidence (F) and mean score (G), and maximal disease score (H). (I-L) Examination of EAE development and the 2D2tg cell response in liver-specific SAA1tg (liverSAA1) and control Alb-Cretg littermates following transfer of 2D2tg TH17-TGFβ cells. Summary of 2 experiments, with liverSAA1 (red circles, n = 13) and Alb-Cretg (white circles, n = 11) mice. Experimental scheme (I), incidence of EAE onset (J), number of 2D2tg RORγt+ TH17 cells (K) and frequency of IL17A+ cells amongst RORγt+ TH17 cells in spinal cords at day 40 post-adoptive transfer (L). (B, F, and J) Statistics were calculated by log-rank test using the Mantal-Cox method. (C and G) Statistics were calculated using the two-stage step-up method of Benjamini, Krieger and Yekutieliun. Error bars denote the mean ± s.e.m. *p < 0.05, **p < 0.01, and ****p < 0.0001, (D, H, K, and L) Statistics were calculated using the unpaired two-sided Welch’s t-test. Error bars denote the mean ± s.d. ns = not significant, *p < 0.05, ***p < 0.001, ****p < 0.0001. See also Figure S6.

References

    1. Abdollahi E, Tavasolian F, Momtazi-Borojeni AA, Samadi M, and Rafatpanah H (2016). Protective role of R381Q (rs11209026) polymorphism in IL-23R gene in immune-mediated diseases: A comprehensive review. J Immunotoxicol 13, 286–300. - PubMed
    1. Ajami B, Bennett JL, Krieger C, McNagny KM, and Rossi FMV (2011). Infiltrating monocytes trigger EAE progression, but do not contribute to the resident microglia pool. Nat Neurosci 14, 1142–U1263. - PubMed
    1. Awasthi A, Riol-Blanco L, Jager A, Korn T, Pot C, Galileos G, Bettelli E, Kuchroo VK, and Oukka M (2009). Cutting edge: IL-23 receptor gfp reporter mice reveal distinct populations of IL-17-producing cells. J Immunol 182, 5904–5908. - PMC - PubMed
    1. Bettelli E, Carrier YJ, Gao WD, Korn T, Strom TB, Oukka M, Weiner HL, and Kuchroo VK (2006). Reciprocal developmental pathways for the generation of pathogenic effector T(H)17 and regulatory T cells. Nature 441, 235–238. - PubMed
    1. Chai JN, Peng Y, Rengarajan S, Solomon BD, Ai TL, Shen Z, Perry JSA, Knoop KA, Tanoue T, Narushima S, et al. (2017). Helicobacter species are potent drivers of colonic T cell responses in homeostasis and inflammation. Sci Immunol 2. - PMC - PubMed

Publication types

MeSH terms