. 2020 Jan 9;180(1):92-106.e11.
doi: 10.1016/j.cell.2019.11.032. Epub 2019 Dec 19.

Restricted Clonality and Limited Germinal Center Reentry Characterize Memory B Cell Reactivation by Boosting

Affiliations

Restricted Clonality and Limited Germinal Center Reentry Characterize Memory B Cell Reactivation by Boosting

Luka Mesin et al. Cell. .

Abstract

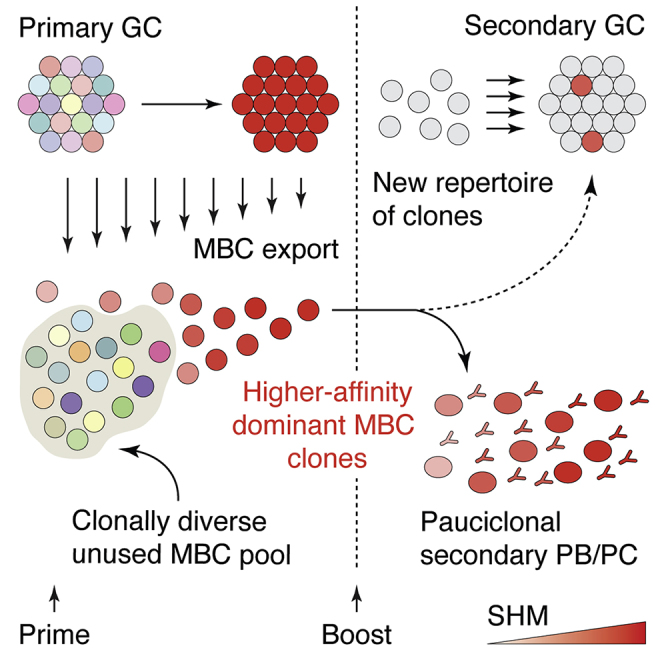
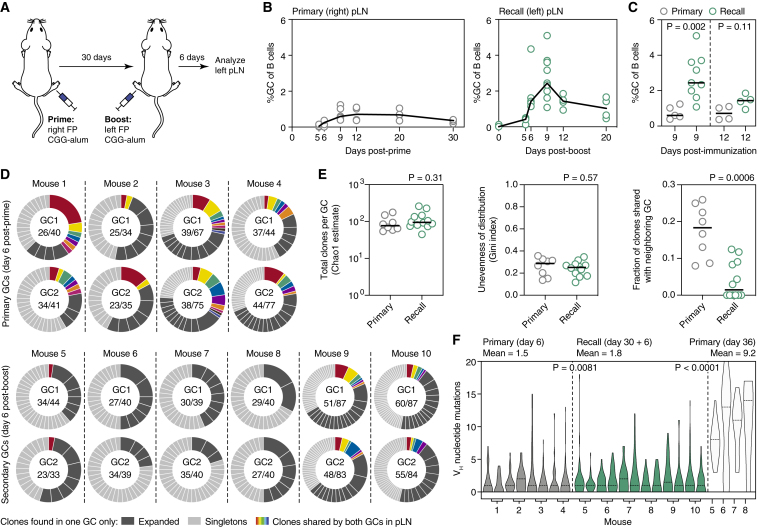
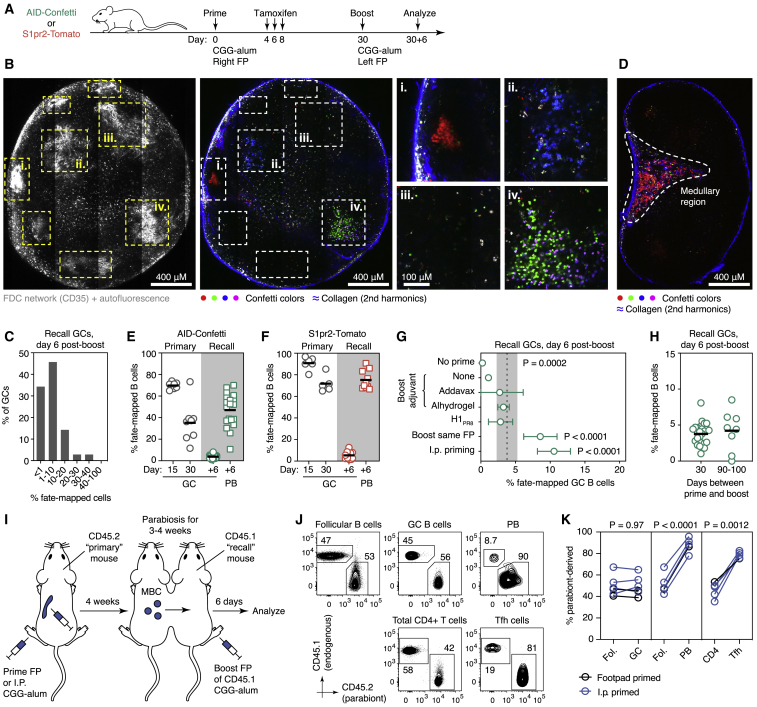
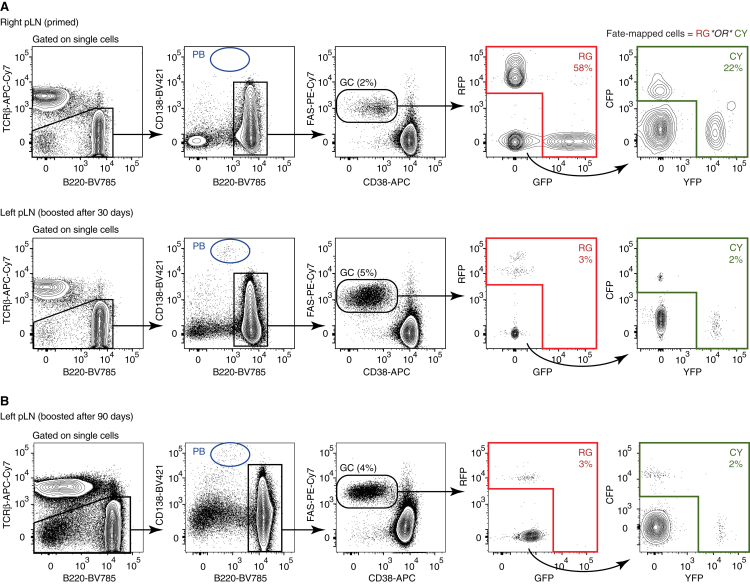
Repeated exposure to pathogens or their antigens triggers anamnestic antibody responses that are higher in magnitude and affinity than the primary response. These involve reengagement of memory B cell (MBC) clones, the diversity and specificity of which determine the breadth and effectiveness of the ensuing antibody response. Using prime-boost models in mice, we find that secondary responses are characterized by a clonality bottleneck that restricts the engagement of the large diversity of MBC clones generated by priming. Rediversification of mutated MBCs is infrequent within secondary germinal centers (GCs), which instead consist predominantly of B cells without prior GC experience or detectable clonal expansion. Few MBC clones, generally derived from higher-affinity germline precursors, account for the majority of secondary antibody responses, while most primary-derived clonal diversity is not reengaged detectably by boosting. Understanding how to counter this bottleneck may improve our ability to elicit antibodies to non-immunodominant epitopes by vaccination.

Keywords: affinity maturation; antibody response; clonal dynamics; germinal center memory B cell; immunological memory; influenza A virus; memory reactivation.


Conflict of interest statement

The authors declare no competing interests.

Figures

None
Graphical abstract
Figure 1
Figure 1
Secondary GCs Are Clonally Diverse and Have Low SHM Load (A) Schematic representation of the immunization protocol. (B and C) Kinetics of primary and recall GC responses in wild-type mice immunized and boosted (B) as in (A), summarized in (C). Graphs indicate the percentage of GC B cells (CD38lowFashi) among total B cells. Each symbol represents one mouse; lines represent median. (D) Clonal diversity of individual early primary GCs (reanalyzed from Tas et al., 2016) or early recall GCs (this study) obtained by in situ photoactivation. PA-GFP transgenic mice were crossed to Rosa26Lox-Stop-Lox-tdTomato and AicdaCre/+ (primary) or Ighg1Cre/+ (recall) for visualization of GCs prior to photoactivation. Numbers are (clones observed)/(cells sequenced). Two GCs were sequenced from each pLN; colored slices represent clones that were found in both GCs from the same node. (E) Clonal richness (Chao1 estimator, downsampled to the smallest no. of cells, Left), evenness of clonal distribution (Gini index, Center), and sharing between neighboring GCs (Right) in early primary and early recall GCs. Each symbol represents one GC, with two GCs per mouse as in (D); lines represent median. (F) Distribution of somatic mutations per B cell in early primary and early recall GCs. Each bar/violin plot represents one GC, with two GCs per mouse as in (D). Dashed lines represent median. All data are pooled from at least two independent experiments. p values are for Mann-Whitney U test (C and E) and Kruskal-Wallis test with Dunn’s multiple comparison test (F).
Figure 2
Figure 2
Secondary GCs Are Composed Primarily of B Cells without Prior GC Experience (A) Experimental protocol for (B)–(F). (B) Multiphoton image showing GCs in the left pLN at 6 days post-boost. GCs (dashed lines) were identified by presence of follicular dendritic cell (FDC) networks (labeled in vivo using a far-red anti-CD35 antibody) and autofluorescent tingible body macrophages (leftmost panel; image is a collapsed 40 μm, 3-slice z stack). Confetti colors and collagen fibers (second harmonics, blue) for a single Z slice are shown in the central panel. GCs marked with roman numerals are magnified in the smaller panels to the right. (C) Distribution of GCs from five pLNs according to fate-mapped cell density, quantified from images as shown in (B). (D) Image of explanted lymph node slice showing accumulation of fluorescent cells in medullary region. (E and F) Percentage of fate-mapped cells in the indicated compartments by flow cytometry, in AID-Confetti (E) or S1pr2-Tomato (F) mice. Each symbol represents one mouse; lines represent mean. Recall GCs and PBs are from the same sample. All data are from at least 2 independent experiments. (G) Percentage of fate-mapped cells in recall GCs in AID-Confetti mice immunized using different protocols. Dashed line and shaded area represent mean ± SD of standard protocol (day +6 GC from E). Rows are mean ± SD for 3–9 mice from at least two independent experiments per condition. p values are for one-way ANOVA with Dunnett’s multiple comparison test; only p < 0.05 is shown. (H) Percentage of fate-mapped cells in AID-Confetti mice boosted 30 or 90–100 days after priming. Each symbol represents one mouse; bars represent median. Data for day 30+6 are the same as in (E). (I) Experimental protocol for (J) and (K). (J) Flow cytometry of the boosted pLN of the recall mouse showing fraction of cells originating from primary (CD45.2) and recall (CD45.1) parabionts. Primary mouse in this example was immunized i.p. (K) Quantification of data from multiple pairs from 3–4 independent experiments, primed i.p. (blue) or s.c. (black). Each symbol represents one parabiont pair. p values are for paired Student’s t test.
Figure S1
Figure S1
Flow Cytometry Gating Strategy for Identifying Fate-Mapped GC B Cells in the AID-Confetti Model, Related to Figure 2 (A) Mice were primed and boosted as in Figure 2A. Flow cytometry plots show cells from the primed right pLN and the boosted left pLN. The final fate-mapped gate was a Boolean “OR” gate combining fluorescence in the four Confetti colors. A similar strategy was used to identify fate-mapped plasmablasts, starting from the “PB” gate shown in blue. (B) Flow cytometry showing fate-mapping in secondary GCs for a mouse primed as in (A) but boosted after 90-100 days.
Figure S2
Figure S2
Production of Recombinant HAs, Related to Figure 2 Cysteine-stabilized HAs (Lee et al., 2015) were produced in CHO cells and purified as detailed in the STAR Methods. Left, stained SDS-PAGE gel of H1PR8 under reducing and non-reducing conditions. HA is shown prior to and after thrombin digestion to remove trimerization, biotinylation, AviTag, and HisTag domains. Right, non-reducing SDS-PAGE gel of HAs used for heterologous boosting (pandemic H1 A/California/07/2009 (H1Cal), and H5 A/Indonesia/05/2005 (H5Ind)) after thrombin digestion. Both strips are cropped from the same gel.
Figure 3
Figure 3
B Cells with Primary GC Experience Are Not at a Competitive Advantage in Secondary GCs Experimental design as in Figure 2A. (A) Change over time in the percentage of fate-mapped cells in secondary GCs by flow cytometry, in AID-Confetti (Left) or S1pr2-Tomato mice (Right). Each symbol represents one mouse; lines represent mean. All data are from at least 2 independent experiments. Data for day 6 are reproduced from Figures 2E and 2F. (B) Quantification of the fraction of fate-mapped B cells in individual GCs by two-photon microscopy at 6 and 20 days post-boost. Each symbol represents one GC and violin plots show aggregate data from all mice; lines represent mean. Data are from 2–3 independent experiments with at least six GCs analyzed per LN. (C) Two-photon images of GCs containing fate-mapped B cells (roman numerals correspond to those indicated in B). (D) Percentage of GCs with high (>10%), mid (1%–10%), and no/low (<1%) fate-mapped B cell content. Note the increase in GCs with <1% labeled cells at the late time point. Data are the same as in (B).
Figure 4
Figure 4
Clonal Dynamics of Secondary GC and PB Responses Experimental design as in Figure 2A. (A) Pie charts showing clonal distribution of all fate-mapped GC B cells from individual boosted pLNs. Each slice in inner (gray) rings represents one clone (distinct V(D)J rearrangement); outer rings show Confetti color. Numbers are (clones observed)/(cells sequenced). (B) Quantification of data in (A). Each symbol represents one pLN; bar represents median. (C) Clonality maps showing distribution and sharing of clones between secondary GC and PB compartments from the same pLN in AID-Confetti and S1pr2-Tomato mice. Each slice of a column represents an individual clone; each column represents one LN. GC/PB pairs are from the same pLN. Clones found in both compartments are connected and colored green. Numbers are as in (A). (D) Quantification of data in (C). Each symbol represents GCs or PBs from one pLN; bar represents median. (E) Scatterplot showing abundance of expanded clones (>1 copy) in PB and GC compartments in the same pLN. Data are from (C). Each symbol represents one clone. Presence of >1 clone in same X-Y position is denoted by larger/darker symbols. 35% of expanded clones had both GC and PB members. (F) Trees showing phylogenetic relationships between VH sequences (excluding CDR3) of cells from selected clones. The top line represents the clone’s unmutated VH region (UVH). Numbers inside cells indicate how many times a particular sequence/color/cell-type combination was observed. PB and GC B cells sharing the same VH sequence are shown as adjacent circles and marked by black arrowheads. Symbols colored according to Confetti colors. (G and H) Distance between observed PB or GC B cell sequences and their last common ancestor (LCA) with a cell in the opposite compartment, shown as a histogram (G) or as a heatmap according to distance from UVH (H). Note that most PBs are identical (0 mutations distant) from their LCA with a GC B cell, indicative of a single MBC of origin. Data are from (C).
Figure 5
Figure 5
Clonal Dynamics of the Response to HA Immunization following Influenza Infection (A) Experimental protocol for Figures 5B–5J. (B) (Left) GC size (percentage of GCs of all B cells); (Center) percentage of fate-mapped cells in GC and PB compartments; and (Right) MBCs per 106 B cells, at different time points after primary influenza PR8 infection (gray symbols) or boosting with homologous H1PR8 protein (green symbols). Each symbol represents one mouse; bar represents median; data are pooled from 2–3 independent experiments. Equivalent data for the S1pr2-Tomato strain are presented in Figure S3B. (C) Clonality maps tracking fate-mapped clones across multiple compartments. FM+, only fate-mapped cells sorted; HA+, only H1PR8-binding cells sorted. Clones present in more than one compartment are connected and depicted in color. Pie chart insets show clonal distribution in the entire secondary GC, including non-fate-mapped cells. Equivalent data for 2 additional mice is shown in Figure S4A; clonal diversity and dominance data for all mice are summarized in Figure S4B. (D–J) Analysis of data depicted in (C) and Figure S4A. (D) Estimated clonal diversity (Chao1) and dominance (N75) of the indicated compartments. Each symbol represents one mouse. (E–J) Characteristics of MBC clones responding (used) and not detectably responding (unused) to secondary immunization. (E) Memory clone size, given as a percentage of the total memory compartment of each mouse. Each symbol represents one clone, and boxplots are median and quartiles; whiskers are 10th and 90th percentiles. Cells with the exact same sequence are collapsed into one data point. (F) Number of memory compartments spanned by each MBC clone. (G) Fraction of all memory clones still present in the primary (mLN) GC. For (F) and (G), number of clones analyzed is indicated in each chart. (H) Percentage of IgM+ cells among used and unused MBC clones. Number of cells analyzed is indicated in each chart. (I) Distribution of somatic mutations among used and unused MBC clones. Data are collapsed by sequence as in (E). (J) Estimated total number of distinct clones (Chao1) among all MBCs (circles) and used MBCs (triangles), with downsampling analysis. Each line/symbol represents one mouse. For (E)–(I), sequences are pooled from 2 mice per genotype. p values are for Mann-Whitney U test (E and I) and chi-square test (F–H).
Figure S3
Figure S3
Flow Cytometric Analyis of Fate-Mapped B Cell Responses Following Influenza Infection, Related to Figure 5 (A) Gating strategy used for sorting the cell populations sequenced in Figures 5C and S4A. Only AID-Confetti mice are shown. Mice were infected and boosted as in Figure 5A. Plots are from day 6 post-boost. Gating is shown for mLN, boosted pLN, spleen, and BM. Gates sorted for sequencing are in green (percentage of parent indicated), and correspond to the cell populations shown in the clonality map in Figure 5C. (B) Fate-mapping of primary and recall cells in S1pr2-Tomato, as shown for AID-Confetti in Figure 5B. Left, GC size (% GC of all B cells); center, % fate-mapped cells in GC and PB compartments; and right, MBC per 106 B cells, at different time points after primary influenza PR8 infection (gray symbols) or boosting with homologous H1PR8 protein (red symbols). Each symbol represents one mouse, bar represents median; pooled from 1-3 independent experiments. (C) Absence of fate-mapped HA-binding B cells in mLN and spleen of uninfected S1pr2-Tomato mice. Uninfected mice were treated as in Figure 5A, but infection was omitted. Plots show the pre-boost time point. Graph shows quantification for three mice per condition from different experiments. ND, none detected. (D) Proportion of fate-mapped cells in secondary GCs generated as in Figure 5A but boosted with heterologous HA strains (H1Cal, pandemic H1 A/California/07/2009; H5Ind, H5 A/Indonesia/05/2005) and assayed at 9 days post-boost. Data for HAPR8 are reproduced from Figure 5B for comparison. Bars represent medians. P values are for one-way ANOVA with Dunnett’s multiple comparison test. (E) Increase in serum antibody titers to H1PR8 upon protein boosting. Mice infected and boosted as in Figure 5A. The day 45 sample is pre-boost. Geometric mean + SD for 3-10 mice from at least 2 independent experiments are shown.
Figure S4
Figure S4
Clonal Analysis of the Response to HA Immunization Following Influenza Infection, Related to Figure 5 (A) Clonal maps showing distribution of clones across different compartments 6 days post-boost. Data as in Figure 5C, showing two additional mice. In mouse 4, FM+ cells were present in only one pLN GC. (B) Quantification of clonal dominance (N75) and total diversity (Chao1) in different compartments for all 4 mice. Data are for two AID-Confetti and two S1pr2-Tomato mice (Figures 5C and S4A). Each symbol represents one mouse, except for S1pr2-Tomato pLN cells, where both FPs were boosted and each symbol represents one pLN. One sample of FM+ pLN GC B cells from S1pr2-Tomato was omitted from the analysis due to low cell count. Bar represents median. (C) Average VH mutations per clone in fate-mapped and non-fate-mapped GC B cells from Figures 5C and S4A (all four mice are pooled). P value is for Mann-Whittney U test. (D) Proportion of cells (left) and clones (right) found in the “used” MBC fraction (blue and green colors in Figures 5C and S4A). P value is for one-way ANOVA with Dunnett’s multiple comparisons test.
Figure S5
Figure S5
Comparative Clonal Composition of the Secondary Response to HA, Related to Figure 5 (A) Clonal sharing between footpads in fate-mapped and non-fate-mapped secondary GC B cells. S1pr2-Tomato mice were infected with influenza then boosted in both hind footpads with recombinant HA as described in Figure 5. Figures show the clonal composition of non-fate-mapped GC B cells (left panel) and fate-mapped MBC, PB, and GC B cells (right panel) in the two pLNs at 6 days after boost. Clones found in both left and right pLN are highlighted in blue. Data correspond to mice 3 and 4 from Figures 5A and S4A. (B) Clonal maps showing distribution of clones across different compartments. Data as in Figure 5C but analyzed at day 9 post boost. MBCs and PBs for mouse 6 were not analyzed due to the very low number of cells. (C) Quantification of clonal diversity and dominance for the data in (B). (D) Average VH mutations per clone in fate-mapped and non-fate-mapped GC B cells from (B). P value is for Mann-Whittney U test.
Figure 6
Figure 6
Repeated Recall of Dominant B Cell Clones into PB and PC Compartments (A and B) Phylogenetic trees showing relationship between VH sequences (excluding CDR3) of cells from selected clones from Figures 5C and S4A, (A) AID-Confetti and (B) S1pr2-Tomato strains. UVH, unmutated VH region. Open circles indicate cells present in primary (mLN) GC. Closed circles indicate sequences found in MBC, secondary (mLN) PB, or BM PC compartments (specified by the color of the adjacent arrowhead). Numbers indicate how many cells with a particular sequence were observed. (C) Histograms showing distribution of SHM in used MBCs, secondary pLN PBs, and BM PCs. Distributions for total MBCs and for the primary (mLN) GC are shown as lines for comparison. p values are for Mann-Whitney U test comparing the population of interest against total MBCs. Med, median; Sk, skewness (a measure of how skewed the distribution is toward the left [positive] or right [negative]). Data are pooled from two AID-Confetti and two S1pr2-Tomato mice (shown in Figures 5C and S4A) and collapsed by VH sequence (cells with the exact same sequence are counted only once, to avoid skewing due to clonal expansion induced by the boost). (D) Binding to HAPR8 of monoclonal antibodies (mAbs) derived from the UCAs of used and unused MBCs. mAbs were cloned from 18 used and 18 unused MBCs and assayed for binding to recombinant HAPR8 by ELISA. (Left) graph shows mAb reactivity at 3-fold serial dilutions (each line represents one mAb). (Right) Lowest positive concentration (Absorbance at 450 nm >0.2) for each mAb. Each symbol represents one mAb. Data are representative of two experiments. p value is for Mann-Whitney U test. (E) Fab affinity for four used memory UCAs from (D) (dotted box), as measured by biolayer interferometry.

Comment in

References

    1. Allie S.R., Bradley J.E., Mudunuru U., Schultz M.D., Graf B.A., Lund F.E., Randall T.D. The establishment of resident memory B cells in the lung requires local antigen encounter. Nat. Immunol. 2019;20:97–108. - PMC - PubMed
    1. Arpin C., Banchereau J., Liu Y.J. Memory B cells are biased towards terminal differentiation: a strategy that may prevent repertoire freezing. J. Exp. Med. 1997;186:931–940. - PMC - PubMed
    1. Askonas B.A., Williamson A.R. Dominance of a cell clone forming antibody to DNP. Nature. 1972;238:339–341. - PubMed
    1. Bajic G., Maron M.J., Adachi Y., Onodera T., McCarthy K.R., McGee C.E., Sempowski G.D., Takahashi Y., Kelsoe G., Kuraoka M. Influenza Antigen Engineering Focuses Immune Responses to a Subdominant but Broadly Protective Viral Epitope. Cell Host Microbe. 2019;25:827–835. - PMC - PubMed
    1. Berek C., Milstein C. Mutation drift and repertoire shift in the maturation of the immune response. Immunol. Rev. 1987;96:23–41. - PubMed

Publication types

MeSH terms