. 2020 Jan 2;26(1):27-33.e4.
doi: 10.1016/j.stem.2019.11.001. Epub 2019 Dec 19.

Broad Distribution of Hepatocyte Proliferation in Liver Homeostasis and Regeneration

Affiliations

Broad Distribution of Hepatocyte Proliferation in Liver Homeostasis and Regeneration

Feng Chen et al. Cell Stem Cell. .

Abstract

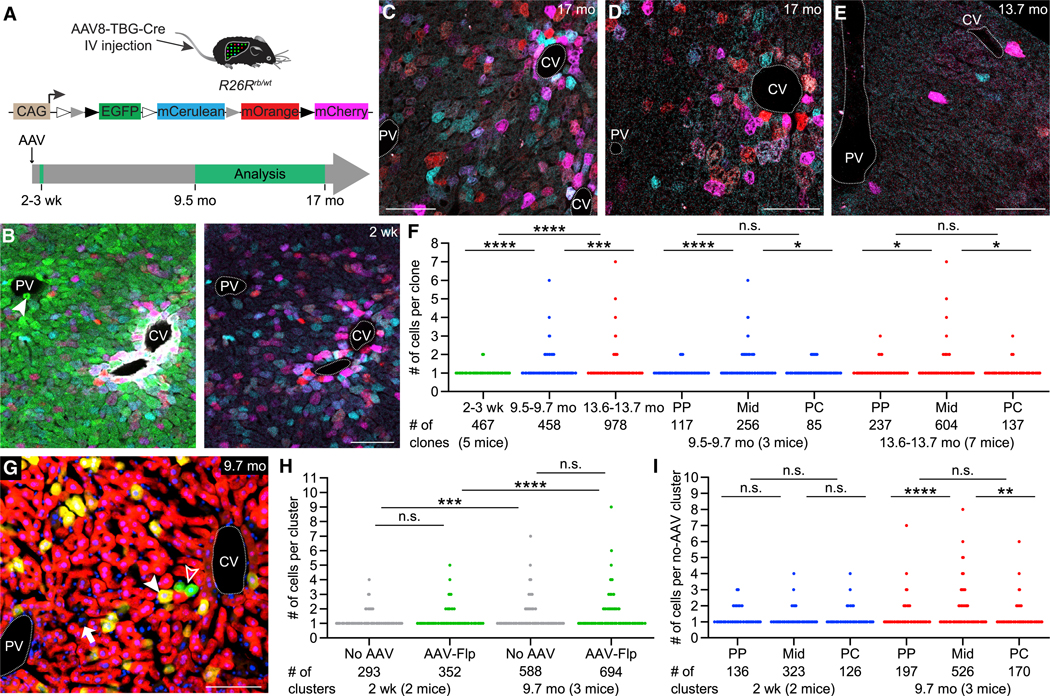
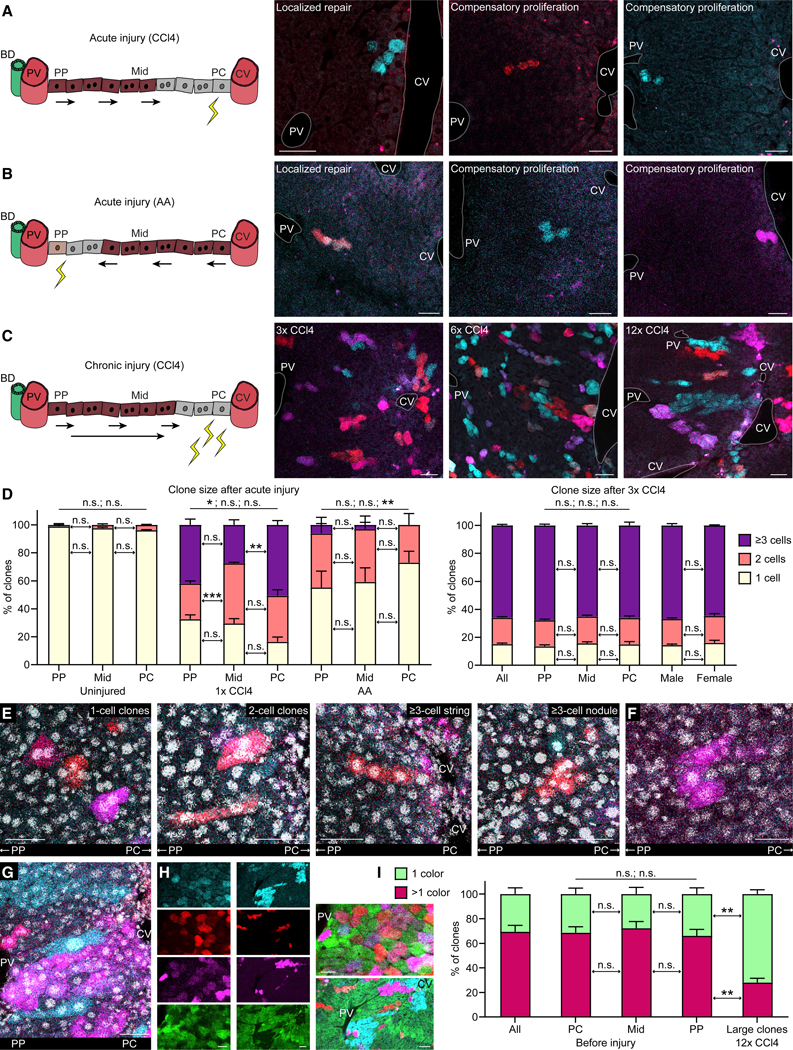
Hepatocyte proliferation is the principal mechanism for generating new hepatocytes in liver homeostasis and regeneration. Recent studies have suggested that this ability is not equally distributed among hepatocytes but concentrated in a small subset of hepatocytes acting like stem cells, located around the central vein or distributed throughout the liver lobule and exhibiting active WNT signaling or high telomerase activity, respectively. These findings were obtained by utilizing components of these growth regulators as markers for genetic lineage tracing. Here, we used random lineage tracing to localize and quantify clonal expansion of hepatocytes in normal and injured liver. We found that modest proliferation of hepatocytes distributed throughout the lobule maintains the hepatocyte mass and that most hepatocytes proliferate to regenerate it, with diploidy providing a growth advantage over polyploidy. These results show that the ability to proliferate is broadly distributed among hepatocytes rather than limited to a rare stem cell-like population.

Keywords: clonal expansion; hepatocyte; homeostasis; lineage tracing; liver; liver regeneration; liver stem cells; liver zonation; ploidy; regeneration.


Figures

Figure 1.
Figure 1.. Hepatocyte Proliferation in Liver Homeostasis
(A) Rosa26-Rainbow Cre reporter allele and lineage-tracing strategy. In the absence of Cre, R26Rrb/wt mice express EGFP in all cells. Hepatocyte-targeted AAV8-TBG-Cre mediates recombination at 1 set of the variant loxP sites, which deactivates EGFP and randomly activates mCerulean, mOrange, or mCherry expression. IV, intravenous; mo, months; wk, weeks; white triangle, loxN; gray triangle, lox2272; black triangle, loxP. (B) Liver of a male R26Rrb/wt mouse 2 weeks after high-dose AAV8-TBG-Cre injection. Lineage-traced hepatocytes express mCerulean (light blue), mOrange (red), or mCherry (magenta) or a combination of these fluorophores. Hepatocytes and other liver cells not transduced by the AAV vector express only EGFP (green). Left image shows all 4 fluorophores; right image shows only the 3 Cre-activated fluorophores. Rare lineage-traced hepatocytes also express EGFP, presumably because 1 of the reporter alleles was not recombined. Portal tracts are identified by bile ducts (arrowhead) and pericentral hepatocytes by glutamine synthetase immunofluorescence (white). CV, central vein; PV, portal vein. Scale bar, 100μm. (C–E) Livers of male R26Rrb/wt mice imaged at the indicated time points after high-dose (C), medium-dose (D), or low-dose (E) AAV8-TBG-Cre injection. Results are representative of 5–7 male and 4–6 female mice for each dose analyzed 9.5–17 months after AAV injection (Table S1). Scale bars, 100 μm. (F) Number of hepatocytes per 3D clone in male and female R26Rrb/wt mice at the indicated time points after low-dose AAV8-TBG-Cre injection. 54–153 clones were analyzed in each mouse at 2 to 3 weeks, 142–167 clones at 9.5–9.7 months, and 103–181 clones at 13.6–13.7 months. PP, periportal; Mid, midlobular; PC, pericentral. Mann-Whitney U test; ****p < 0.0001; ***p < 0.001; *p < 0.05; n.s., not significant. (G) Liver of a female R26RtdRFP/ZG mouse 9.7 months after co-injection of AAV8-TBG-Cre and AAV9-TTR-Flp. AAV8-TBG-Cre-lineage-traced hepatocytes express tdRFP (red) and AAV9-TTR-Flp-lineage-traced hepatocytes express EGFP (green; open arrowhead). Hepatocytes transduced with both AAV vectors express tdRFP and EGFP and appear yellow in the merged image (closed arrowhead), whereas hepatocytes not transduced with either AAV vector express neither tdRFP nor EGFP and are identified by large nuclei (DAPI staining, blue; arrow). Scale bar, 100 μm. (H) Number of hepatocytes per 2D cluster not transduced with any AAV (no AAV) or transduced with AAV9-TTR-Flp (AAV-Flp) in 1 male and 1 female R26RtdRFP/ZG mouse 2 weeks and 1 male and 2 female mice 9.7 months after AAV8-TBG-Cre and AAV9-TTR-Flp co-injection. 99 and 194 no-AAV clusters and 117 and 235 AAV-Flp clusters were analyzed in male and female mice, respectively, at 2 weeks; 188–201 no-AAV and 206–275 AAV-Flp clusters were analyzed in each mouse at 9.7 months. Student’s t test on standardized cluster size (see STAR Methods and Figure S1M); ****p < 0.0001; ***p < 0.001. (I) Number of hepatocytes per not transduced 2D cluster in male and female R26RtdRFP/ZG mice 2 weeks and 9.7 months after AAV8-TBG-Cre and AAV9-TTR-Flp co-injection (same mice as in H). 220 and 365 clusters were analyzed in each mouse at 2 weeks; 201–466 clusters were analyzed in each mouse at 9.7 months. Student’s t test on standardized cluster size (see STAR Methods and Figure S1N); ****p < 0.0001; **p < 0.01.
Figure 2.
Figure 2.. Hepatocyte Proliferation in Liver Regeneration
(A) Livers of male and female R26Rrb/wt mice injected with low-dose AAV8-TBG-Cre analyzed 2 weeks after 1 dose of CCl4. Lineage-traced hepatocytes express mCerulean (light blue) or mOrange (red). BD, bile duct. In the cartoons, healthy hepatocytes are brown, injured hepatocytes are gray, injury is represented by yellow zigzags, and arrows indicate the direction of hepatocyte clone expansion. Results are representative of 4 (2 male and 2 female) mice. An additional female mouse analyzed 5 days after the CCl4 dose showed similar results (data not shown). Scale bars, 50 μm. (B) Liver of a female R26Rrb/wt mouse injected with low-dose AAV8-TBG-Cre analyzed 2 weeks after 2 doses of AA. mCerulean and mOrange double-positive hepatocytes appear orange. Small white and magenta dots are autofluorescent cellular debris. Results are representative of 2 (1 male and 1 female) mice. Additional 3 (2 male and 1 female) mice analyzed 1 week after the last AA dose showed similar results (data not shown). Scale bars, 50 μm. (C) Livers of 3 male R26Rrb/wt mice injected with high-dose AAV8-TBG-Cre analyzed 2 weeks after 3, 6, or 12 doses of CCl4. Results are representative of 5 (3 male and 2 female) mice for 3 doses and 2 (1 male and 1 female) mice each for 6 doses and 12 doses. Additional 3, 1, and 2 male and female mice analyzed 3–6 days after the last of 3, 6, and 12 doses of CCl4 showed similar results (data not shown). Scale bars, 50 μm. (D) Left graph shows percentage of 3D clones with the indicated number of hepatocytes in 3 (1 male and 2 female) uninjured R26Rrb/wt mice injected with low-dose AAV8-TBG-Cre (mice also shown in Figure 1F), 2 (1 male and 1 female) R26Rrb/wt mice injected with low-dose and 1 female mouse injected with medium-dose AAV8-TBG-Cre, all injured with 1 dose of CCl4, and 3 (2 male and 1 female) R26Rrb/wt mice injected with low-dose AAV8-TBG-Cre and injured with 2 doses of AA. Livers were analyzed 2 weeks after the single CCl4 dose or 1 week after the last AA dose. 46–99 clones from the midlobular zone and 21–69 clones each from the periportal and pericentral zones were analyzed in each mouse. Right graph shows percentage of 3D clones with the indicated number of hepatocytes in 8 (4 male and 4 female) R26Rrb/wt mice injected with high-dose AAV8-TBG-Cre analyzed 4–6 days or 2 weeks after 3 doses of CCl4. 76–180 clones from the midlobular zone and 32–102 clones each from the periportal and pericentral zones were analyzed in each mouse. In mice receiving AA, liver lobules lacking injured portal areas were excluded from analysis (see STAR Methods). Results are means + SEM. Student’s t test; ***p < 0.001; **p < 0.01; *p < 0.05. Differences between 1-, 2-, and ≥3-cell clones in periportal and pericentral zones are indicated by p values above bars. (E) Characteristic types of hepatocyte clones in a male R26Rrb/wt mouse injected with high-dose AAV8-TBG-Cre analyzed 4 days after 3 doses of CCl4, including single large (hypertrophied) binucleated hepatocytes, hepatocytes that divided once and generated 2-cell clones, or hepatocytes that proliferated more than once, generating ≥3 cells that either streamed along the portal to central axis or formed a nodule. Nuclei are identified by DAPI staining (white). Results are representative of 2 (1 male and 1 female) mice. Scale bars, 50 μm. (F) mCherry (magenta)-expressing clone consisting of several small hepatocytes with small nuclei and 2 large hepatocytes with large nuclei in a male R26Rrb/wt mouse injected with low-dose AAV8-TBG-Cre analyzed 3 days after 6 doses of CCl4. Nuclei are identified by DAPI staining (white). Scale bar, 50 μm. (G) mCherry (magenta)-expressing clone consisting of many small hepatocytes that covers the distance from the portal vein to the central vein in a female R26Rrb/wt mouse injected with high-dose AAV8-TBG-Cre analyzed 4 days after 12 doses of CCl4. Adjacent to this clone is an mCerulean (light blue)-expressing 1-cell clone consisting of a large hepatocyte stretching along the portal to central axis. Nuclei are identified by DAPI staining (white). Scale bar, 50 μm. (H) Columns of small images show the fluorophores mCerulean (light blue), mOrange (red), mCherry (magenta), and EGFP (green) separately; large images show them merged. Left column and related merged image show hepatocytes in a male R26Rrb/wt mouse 2 weeks after high-dose AAV8-TBG-Cre injection before initiation of liver injury. Many hepatocytes express more than 1 fluorophore, i.e., are polyploid. Scale bar, 25 μm. Right column and related merged image show hepatocyte clones in a male R26Rrb/wt mouse injected with high-dose AAV8-TBG-Cre analyzed 4 days after 12 doses of CCl4. Many large clones consist of diploid hepatocytes as indicated by expression of only 1 fluorophore. Scale bar, 50 μm. (I) Percentages of diploid-enriched (1 color) and polyploid (>1 color) hepatocyte clones in 4 (2 male and 2 female) R26Rrb/wt mice analyzed 2 weeks after high-dose AAV8-TBG-Cre injection and in 4 (2 male and 2 female) R26Rrb/wt mice injected with high-dose AAV8-TBG-Cre analyzed 4 days or 2 weeks after 12 doses of CCl4. In injured mice, only large clones consisting of ≥12 cells were analyzed. Results are means + SEM. Welch’s t test; **p < 0.01. Differences between 1 color and >1 color in pericentral and periportal zones are indicated by p values above bars.

Comment in

References

    1. Alvarado TF, Puliga E, Preziosi M, Poddar M, Singh S, Columbano A, Nejak-Bowen K, and Monga SP (2016). Thyroid hormone receptor β agonist induces b-catenin-dependent hepatocyte proliferation in mice: implications in hepatic regeneration. Gene Expr. 17, 19–34. - PMC - PubMed
    1. Arrojo E Drigo R, Lev-Ram V, Tyagi S, Ramachandra R, Deerinck T, Bushong E, Phan S, Orphan V, Lechene C, Ellisman MH, and Hetzer MW (2019). Age mosaicism across multiple scales in adult tissues. Cell Metab. 30, 343–351.e3. - PMC - PubMed
    1. Bell P, Wang L, Gao G, Haskins ME, Tarantal AF, McCarter RJ, Zhu Y, Yu H, and Wilson JM (2011). Inverse zonation of hepatocyte transduction with AAV vectors between mice and non-human primates. Mol. Genet. Metab 104, 395–403. - PMC - PubMed
    1. Davidoff AM, Ng CY, Zhou J, Spence Y, and Nathwani AC (2003). Sex significantly influences transduction of murine liver by recombinant adeno-associated viral vectors through an androgen-dependent pathway. Blood 102, 480–488. - PubMed
    1. Duncan AW, Taylor MH, Hickey RD, Hanlon Newell AE, Lenzi ML, Olson SB, Finegold MJ, and Grompe M. (2010). The ploidy conveyor of mature hepatocytes as a source of genetic variation. Nature 467, 707–710. - PMC - PubMed

Publication types