. 2020 Jan 8;27(1):68-78.e5.
doi: 10.1016/j.chom.2019.11.003. Epub 2019 Dec 19.

Staphylococcus epidermidis Contributes to Healthy Maturation of the Nasal Microbiome by Stimulating Antimicrobial Peptide Production

Affiliations

Staphylococcus epidermidis Contributes to Healthy Maturation of the Nasal Microbiome by Stimulating Antimicrobial Peptide Production

Qian Liu et al. Cell Host Microbe. .

Abstract

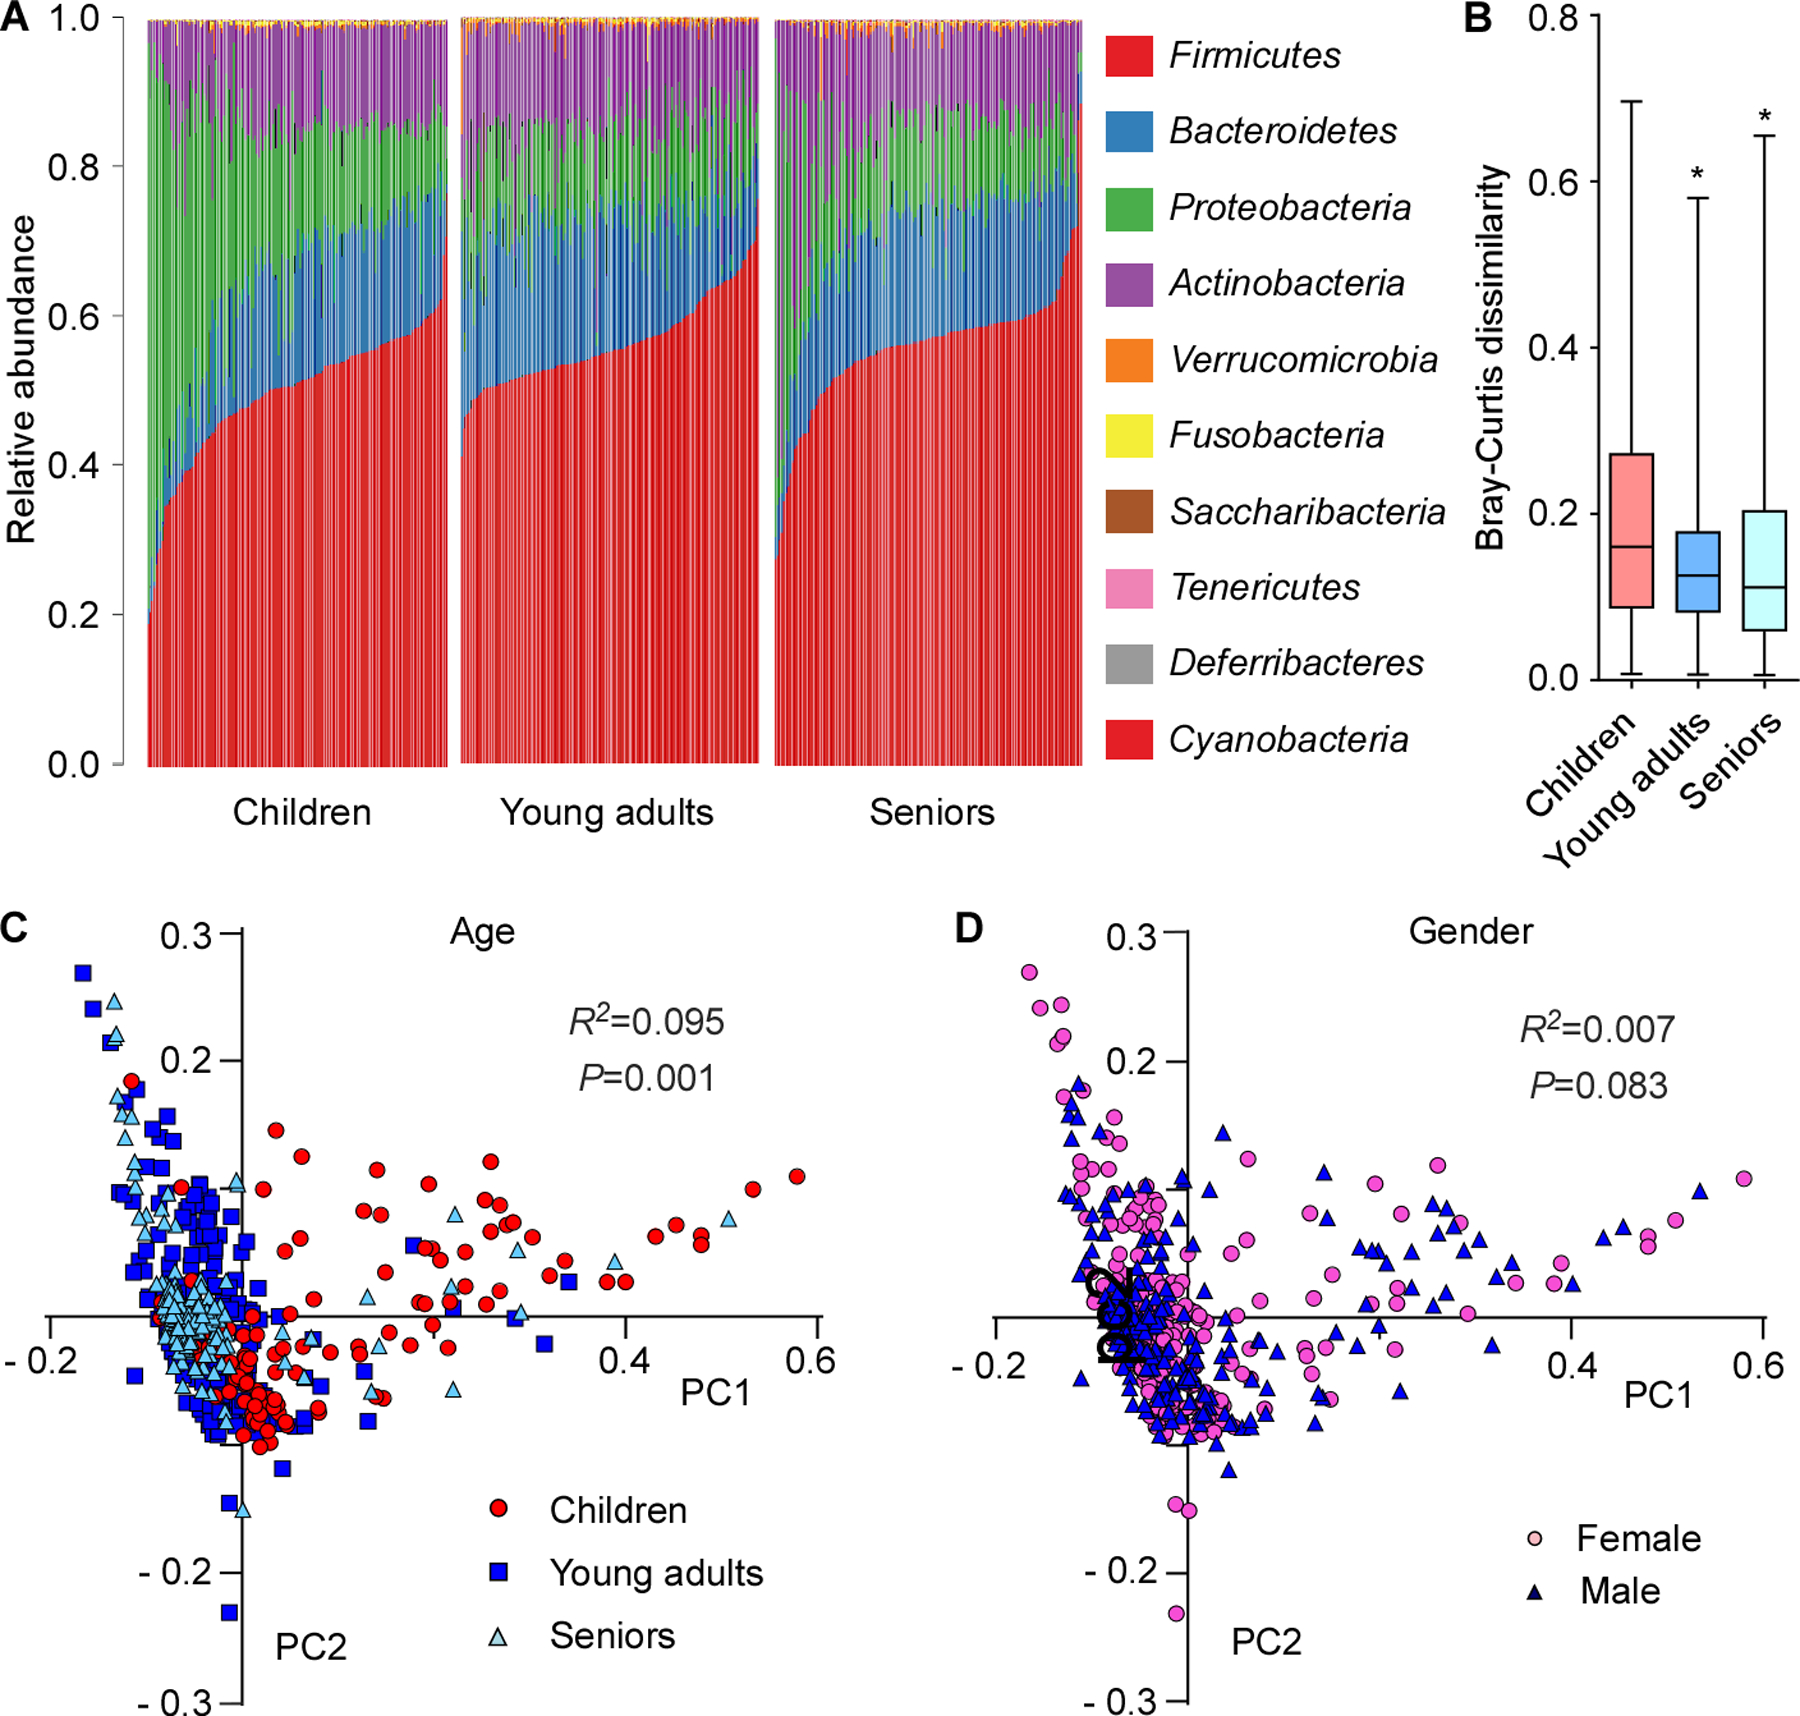
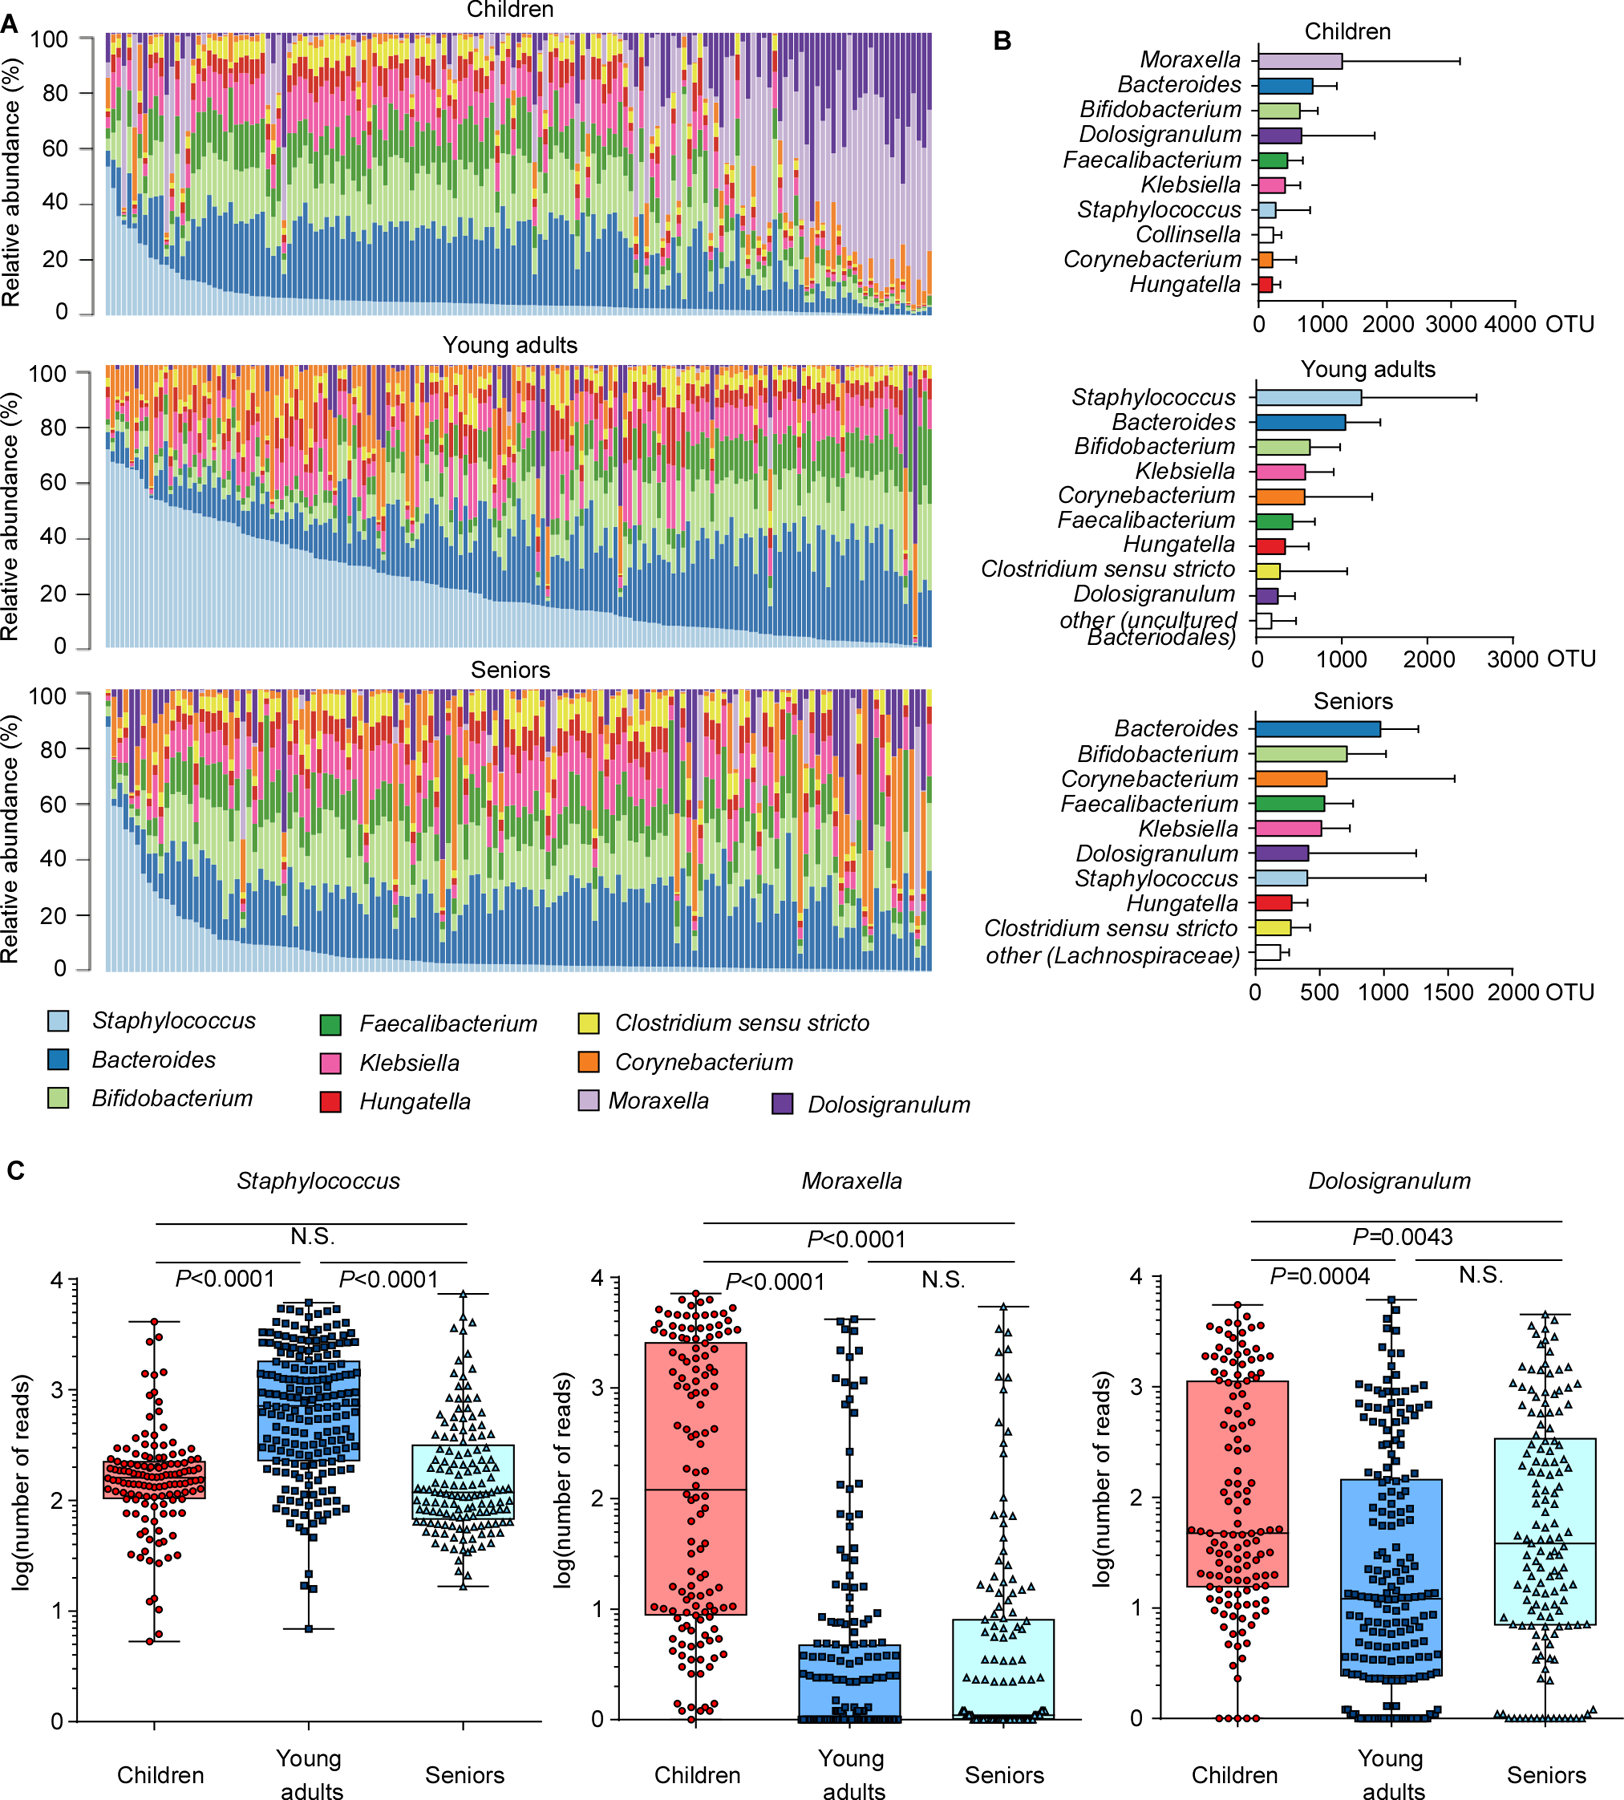
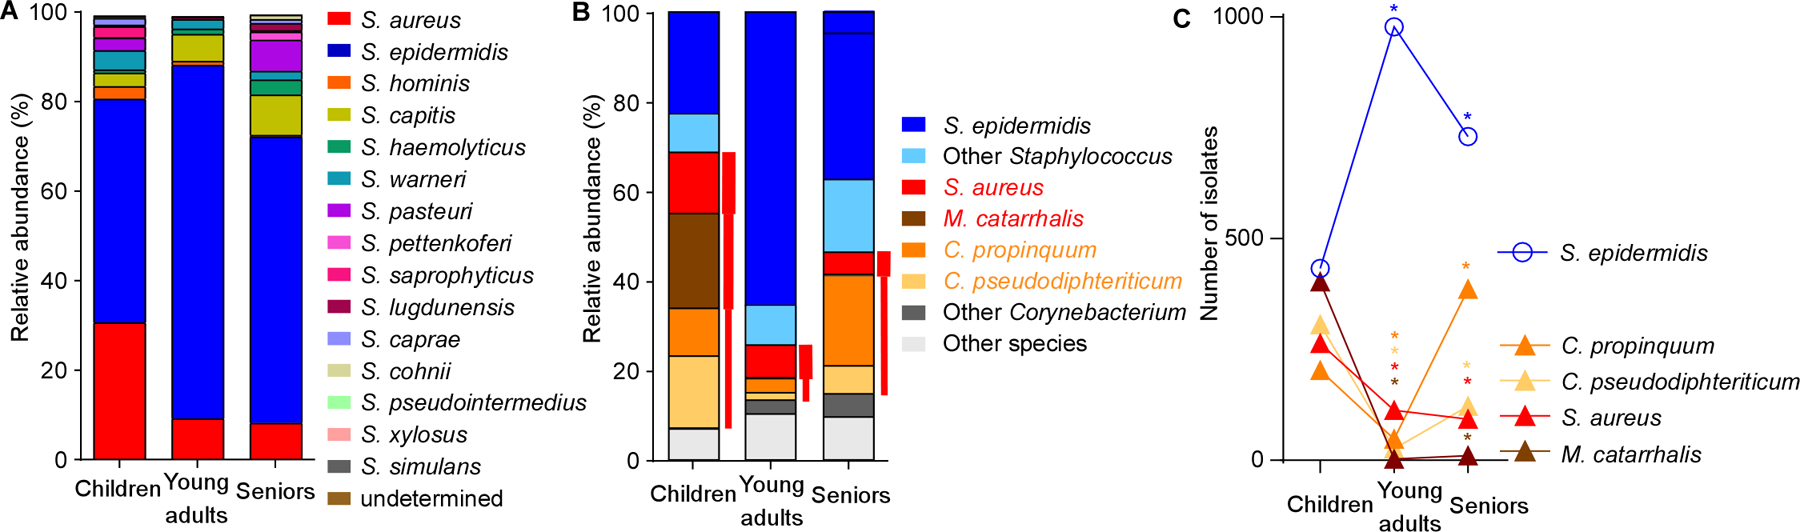
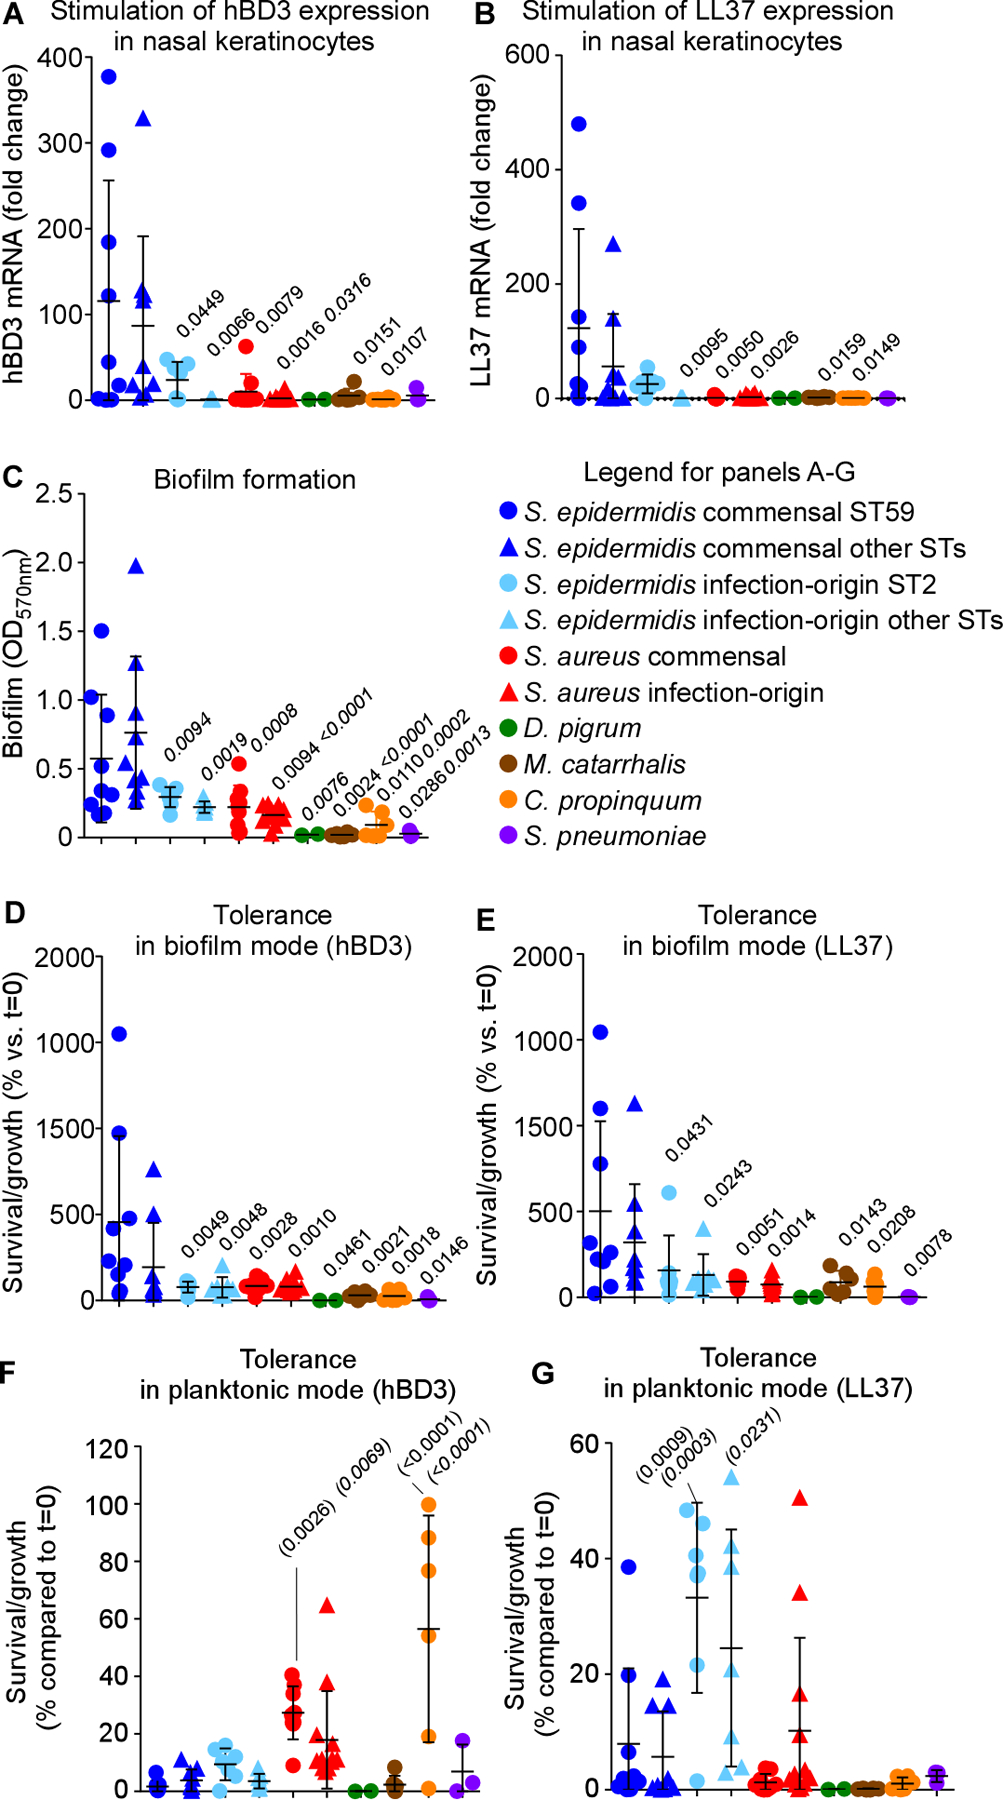
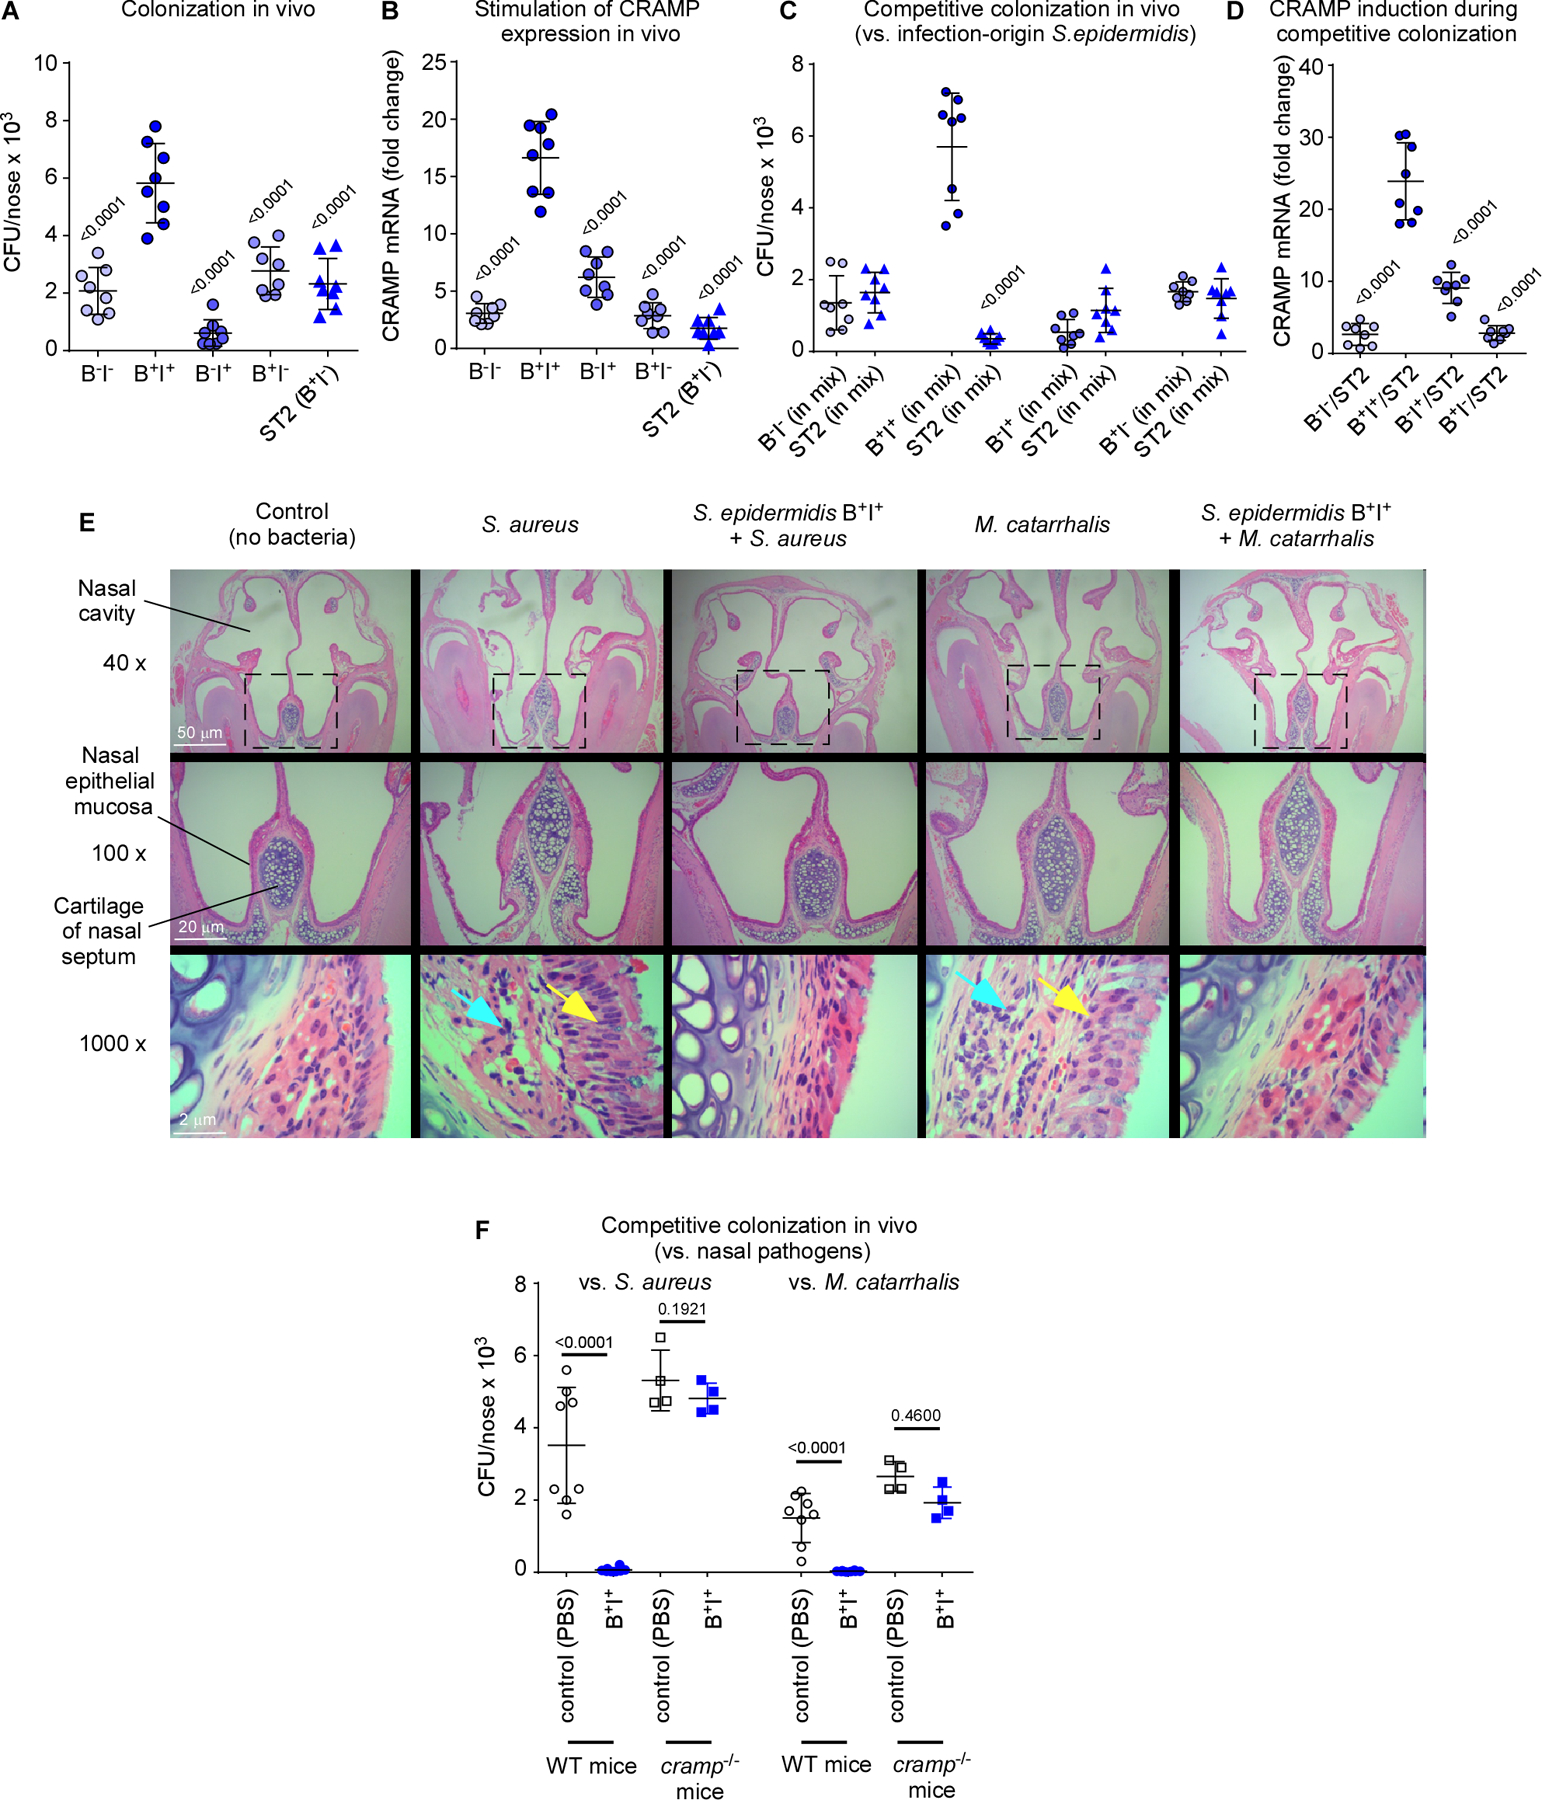
The composition of the human microbiome profoundly impacts human well-being. However, the mechanisms underlying microbiome maturation are poorly understood. The nasal microbiome is of particular importance as a source of many respiratory infections. Here, we performed a large sequencing and culture-based analysis of the human nasal microbiota from different age groups. We observed a significant decline of pathogenic bacteria before adulthood, with an increase of the commensal Staphylococcus epidermidis. In seniors, this effect was partially reversed. In vitro, many S. epidermidis isolates stimulated nasal epithelia to produce antimicrobial peptides, killing pathogenic competitors, while S. epidermidis itself proved highly resistant owing to its exceptional capacity to form biofilms. Furthermore, S. epidermidis isolates with high antimicrobial peptide-inducing and biofilm-forming capacities outcompeted pathogenic bacteria during nasal colonization in vivo. Our study identifies a pivotal role of S. epidermidis in healthy maturation of the nasal microbiome, which is achieved at least in part by symbiotic cooperation with innate host defense.

Keywords: Staphylococcus epidermidis; antimicrobial peptides; biofilm; immune evasion; innate immunity; microbiome; nose.


Conflict of interest statement

Declaration of interests

The authors declare no competing interests.

Figures

Figure 1.
Figure 1.. Development of the human nasal microbiome with age.
(A) Relative abundance of the ten major phyla in investigated individuals by age group. (B) Bray-Curtis dissimilarity of the age groups (phylum level). Statistical analysis is by 1-way ANOVA and Tukey’s post-test. *, P<0.0001. Whisker boxes are drawn from the first to third quartiles. Error bars show minima and maxima. (C) Principal coordinate analysis by age group. (D) Principal coordinate analysis by gender. (C,D) Statistical analysis is by Analysis of Similarities (ANOSIM) test.
Figure 2.
Figure 2.. Correlation of abundance of Staphylococcus and other genera in the nasal microbiome.
(A) Relative abundance of major genera in the nasal microbiome of single individuals in the three analyzed age groups. (B) Abundance of major genera in the three age groups. Bars depict means; error bars SD. (C) Abundance of Staphylococcus, Moraxella, and Dolosigranulum in the three age groups, in single individuals. See Fig. S1 for other main genera. Whisker boxes are drawn from the first to third quartiles. Error bars show minima and maxima. Statistical evaluation is by 1-way ANOVA with Tukey’s post-test. Data were also analyzed by ANCOM, by which all three genera showed significant differences between groups (no post tests are available with this analysis; see Supplemental Data Set 2 for ANCOM results). The difference in the abundance of each OTU across different samples or groups was compared based on the subset of 10,000 random reads for each sample.
Figure 3.
Figure 3.. Culture-based analysis of S. epidermidis abundance and inverse correlation with presence of pathogens in the nasal microbiota.
(A) Relative abundance of staphylococcal species (by culture-based quantification) in the nasal microbiota in the three age groups. (B) Relative abundance of all culturable bacteria in the three age groups. Red font and bars depict opportunistic respiratory pathogens, with bar thickness depicting relative pathogenic potential. (C) Inverse correlation of abundance of S. epidermidis and respiratory pathogens in the nasal microbiota in the three age groups. Statistical analysis is by Fisher’s exact test (comparing presence of a species in the young adult versus children and senior versus young adult groups). *, P<0.0001.
Figure 4.
Figure 4.. Evolutionary relationships within and differences between age groups of S. epidermidis nasal isolates.
S. epidermidis isolates were typed by MLST and evolutionary relationship was computed using eBURST. Abundant STs are noted in boldface. The important STs for which statistically significant differences in abundance between age groups were detected are colored: ST59, blue; ST89, turquoise; ST130, red. Dot sizes correspond to abundance. Comparisons between age groups for specific STs were performed by contingency analyses using Fisher’s exact test (number of isolates of analyzed ST versus number of remaining isolates in the two groups to be compared).
Figure 5.
Figure 5.. Symbiotic mechanism of S. epidermidis-mediated pathogen exclusion on the nasal epithelium – in vitro tests.
(A,B) Stimulation of expression of hBD3 (A) and LL37 (B) in nasal epithelial cells by S. epidermidis commensal and infection-origin isolates (with separate analysis of the major STs), commensal and infection-origin isolates of S. aureus, and other major opportunistic respiratory pathogens. See Table S1 for isolate selection. (C) Biofilm formation by the same isolates in TSB. (D,E) Tolerance to the AMPs hBD3 (D) and LL37 (E) by the same isolates in biofilm mode of growth (TSB). (F,G) AMP tolerance by the same isolates in planktonic mode of growth (TSB). See Fig. S3 for results in SNM3. (A-G) Three biological replicates were measured for every strain. The depicted data represent the average for each strain. Statistical analysis is by 1-way ANOVA with Dunnett’s post-tests versus data obtained with the S. epidermidis commensal ST59 (regular font P values) and S. epidermidis commensal other STs (italic font P values). Error bars show means ± SD. Experiments depicted in panels A-C were repeated four times, and those in panels D-G twice, with similar results.
Figure 6.
Figure 6.. Symbiotic mechanism of S. epidermidis-mediated pathogen exclusion on the nasal epithelium – in vivo tests.
(A) Nasal colonization in mice of selected S. epidermidis commensal strains (BI, weak biofilm former and low AMP induction capacity; B+I+, strong biofilm former and high AMP induction capacity; BI+, weak biofilm former and high AMP induction capacity; B+I, strong biofilm-former and low AMP induction capacity, see Table S2), and an infection-origin isolate with the B+I phenotype characteristic for that group. Inocula, 1 × 10⁷ CFU, once a day for 4 days, CFU determination 6 days after first instilment. (B) Induction of cramp gene in the same experiment as in panel A. (C) Competitive nasal colonization with the four selected commensal S. epidermidis strains and the infection-origin ST2 strain (1:1 inocula, 1 × 10⁷ CFU each, instilments and CFU determination as described for panel A). (D) Induction of cramp gene in the same experiment as in panel C. (E,F) Competitive nasal colonization with B+I+ S. epidermidis and S. aureus or M. catarrhalis (S. epidermidis, 1 × 10⁷ CFU every day over four days; S. aureus, 1 × 10⁸ CFU at day 6; M. catarrhalis, 4 × 10⁹ CFU at day 6). (E) Histological examination of noses. Yellow arrows, proliferation of cilia in nasal epithelial mucosa; blue arrows, destruction of epithelial submucosa. (F) CFU. (A-D, F) n=8. (B,D) Three measurements were taken for determination of CRAMP mRNA expression. The shown data represent the average for every mouse. (A,B,D) Statistical analysis is by 1-way ANOVA with Dunnett’s post-tests versus data obtained with with B+I+. (C,F) Statistical analysis is by unpaired t-tests. Error bars show means ± SD.

References

    1. Allaire JM, Crowley SM, Law HT, Chang SY, Ko HJ, and Vallance BA (2018). The Intestinal Epithelium: Central Coordinator of Mucosal Immunity. Trends Immunol. 39(9), 677–696. Published online 2018/05/03 DOI: 10.1016/j.it.2018.04.002. - DOI - PubMed
    1. Bjorksten B, Sepp E, Julge K, Voor T, and Mikelsaar M (2001). Allergy development and the intestinal microflora during the first year of life. J Allergy Clin Immunol. 108(4), 516–520. Published online 2001/10/09 DOI: 10.1067/mai.2001.118130. - DOI - PubMed
    1. Bomar L, Brugger SD, and Lemon KP (2018). Bacterial microbiota of the nasal passages across the span of human life. Curr Opin Microbiol. 41, 8–14. Published online 2017/11/21 DOI: 10.1016/j.mib.2017.10.023. - DOI - PMC - PubMed
    1. Bosch A, de Steenhuijsen Piters WAA, van Houten MA, Chu M, Biesbroek G, Kool J, Pernet P, de Groot PCM, Eijkemans MJC, Keijser BJF, et al. (2017). Maturation of the Infant Respiratory Microbiota, Environmental Drivers, and Health Consequences. A Prospective Cohort Study. Am J Respir Crit Care Med. 196(12), 1582–1590. Published online 2017/07/01 DOI: 10.1164/rccm.201703-0554OC. - DOI - PubMed
    1. Capone KA, Dowd SE, Stamatas GN, and Nikolovski J (2011). Diversity of the human skin microbiome early in life. J Invest Dermatol. 131(10), 2026–2032. Published online 2011/06/24 DOI: 10.1038/jid.2011.168. - DOI - PMC - PubMed

Publication types

MeSH terms

Substances

LinkOut - more resources