. 2020 Mar 2;145(5):1677-1686.
doi: 10.1039/c9an01802f.

Label-free counting of affinity-enriched circulating tumor cells (CTCs) using a thermoplastic micro-Coulter counter (μCC)

Affiliations

Label-free counting of affinity-enriched circulating tumor cells (CTCs) using a thermoplastic micro-Coulter counter (μCC)

Cong Kong et al. Analyst. .

Abstract

Coulter counters are used for counting particles and biological cells. Most Coulter counters are designed to analyze a sample without the ability to pre-process the sample prior to counting. For the analysis of rare cells, such as circulating tumor cells (CTCs), it is not uncommon to require enrichment before counting due to the modest throughput of μCCs and the high abundance of interfering cells, such as blood cells. We report a microfluidic-based Coulter Counter (μCC) fabricated using simple, low-cost techniques for counting rare cells that can be interfaced to sample pre- and/or post-processing units. In the current work, a microfluidic device for the affinity-based enrichment of CTCs from whole blood into a relatively small volume of ∼10 μL was interfaced to the μCC to allow for exhaustive counting of single CTCs following release of the CTCs from the enrichment chip. When integrated to the CTC affinity enrichment chip, the μCC could count the CTCs without loss and the cells could be collected for downstream molecular profiling or culturing if required. The μCC sensor counting efficiency was >93% and inter-chip variability was ∼1%.


Figures

Figure 1.
Figure 1.
(a) Schematic illustration of the assembly of μCC chips. (b) Overall image of μCC and zoom in of the aperture, with the microfluidic chamber filled with red dye. (c) 3D laser scanning microscopy of the aperture. (d) Optical microscopy images of a top-view and cross-section of the aperture in an unbonded PDMS substrate (~50 μm deep). (e) Screen printed Ag/AgCl electrodes and their thickness (~15 μm) measured by profilometry.
Figure 2.
Figure 2.
(a) Equivalent circuit diagram of the μCC. (b) Schematic representation of the signal change when a particle is passing through the μCC aperture. (c) Representative raw resistive pulse signals for 10, 15, and 20 μm beads as measured by the μCC operating at 20 μL/min volumetric flow rate. (d) Linear fit of the peak amplitude to the particle volume. Results are reported as an average of all peak amplitudes obtained for each bead size from measurements ±standard deviation, and distributions of particle volumes based on bead manufacturer information.
Figure 3.
Figure 3.
(a) Representative resistive pulse signals for SKBR3 cells measured by the μCC. (b) Histogram of the size distribution of SKBR3 cells obtained by the μCC versus optical microscopy (the diameter of cells was determined from the volume of the cell detected by the μCC). (c) Correlation of the cells counted by μCC with the cell counts obtained from optical microscopy. Different cell concentrations were tested by diluting cells in PBS buffer, pH 7.4. (d) Inter-chip reproducibility of the μCC was tested by connecting two μCCs in series and measuring the same SKBR3 cells.
Figure 4.
Figure 4.
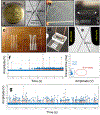
Fabrication steps for the PMMA-based μCC. (a) Brass mold fabricated via HPMM containing four μCC devices and a close up of the aperture in the milled brass. (b) μCC chips embossed in PMMA and a close up of one device showing the same architecture as in the PDMS devices. (c) Pictures of a PMMA cover plate (2 mm thick) in which the troughs were milled (100 μm deep) that were filled with Ag/AgCl paste. Silver paste was allowed to dry and excess paste was removed with a razor blade. (d) μCC was assembled by thermally bonding the cover plate containing electrodes with the embossed substrate and gluing inlet/outlet tubing. (e) Picture of the aperture between two inner electrodes following chip assembly. (f) Evaluation of the μCC response with a mixture of 10 and 20 μm beads. (g) Signal amplitudes for single SKBR3 cells flowing through the PMMA-based μCC.
Figure 5.
Figure 5.
(a) CTC isolation device connected with the μCC sensor. (b) μCC intra-chip reproducibility of the peak amplitude measured for the SKBR3 cell line before and after blood infusion through the μCC. (c) Comparison of CTC and leukocyte diameters obtained from commercial cell counter. (d) Comparison of the μCC signal amplitudes of CTCs and leukocytes. (e) Resistive pulse traces for the counting of CTCs using the μCC following enrichment from blood and release from the CTC chip. Insert: Calcein-AM stained released cells. Table summarizing results from 3 experiments for CTC concentrations of 50 – 250 CTC surrogates per 2 mL of blood.

References

    1. A. Pierzchalski, M. Hebeisen, A. Mittag, M. Berardino and A. Tarnok, 2010.
    1. Dittami GM, Sethi M, Rabbitt RD and Ayliffe HE, Journal of visualized experiments: JoVE, 2012. - PMC - PubMed
    1. Dharmasiri U, Witek MA, Adams AA and Soper SA, Annual review of analytical chemistry, 2010, 3, 409–431. - PubMed
    1. Witek MA, Aufforth RD, Wang H, Kamande JW, Jackson JM, Pullagurla SR, Hupert ML, Usary J, Wysham WZ, Hilliard D, Montgomery S, Bae-Jump V, Carey LA, Gehrig PA, Milowsky MI, Perou CM, Soper JT, Whang YE, Yeh JJ, Martin G. and Soper SA, Nature Precision Oncology, 2018, 1, 24. - PMC - PubMed
    1. Demori M, Ferrari V, Farisè S, Poesio P, Pedrazzani R, Steimberg N, Boniotti J. and Mazzoleni G, Procedia Engineering, 2012, 47, 1247–1250.

MeSH terms