. 2019 Dec 23:8:e52101.
doi: 10.7554/eLife.52101.

Acute cerebellar knockdown of Sgce reproduces salient features of myoclonus-dystonia (DYT11) in mice

Affiliations

Acute cerebellar knockdown of Sgce reproduces salient features of myoclonus-dystonia (DYT11) in mice

Samantha Washburn et al. Elife. .

Abstract

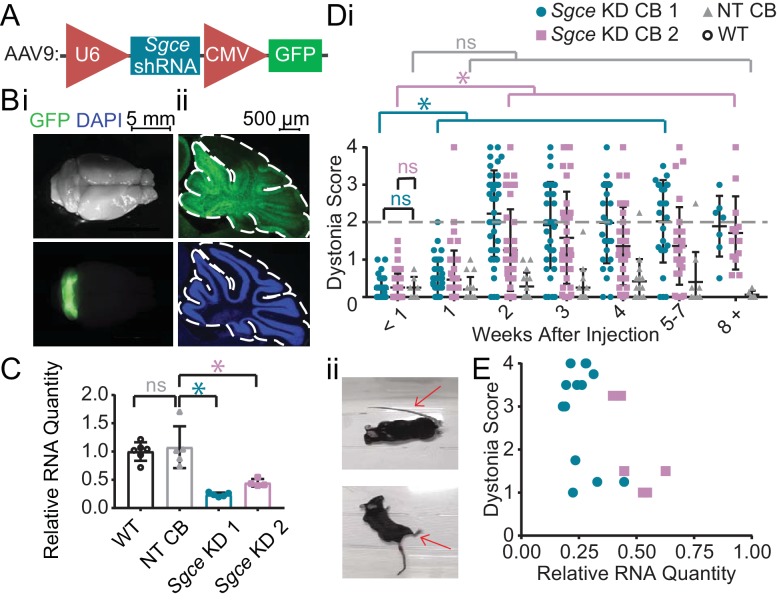
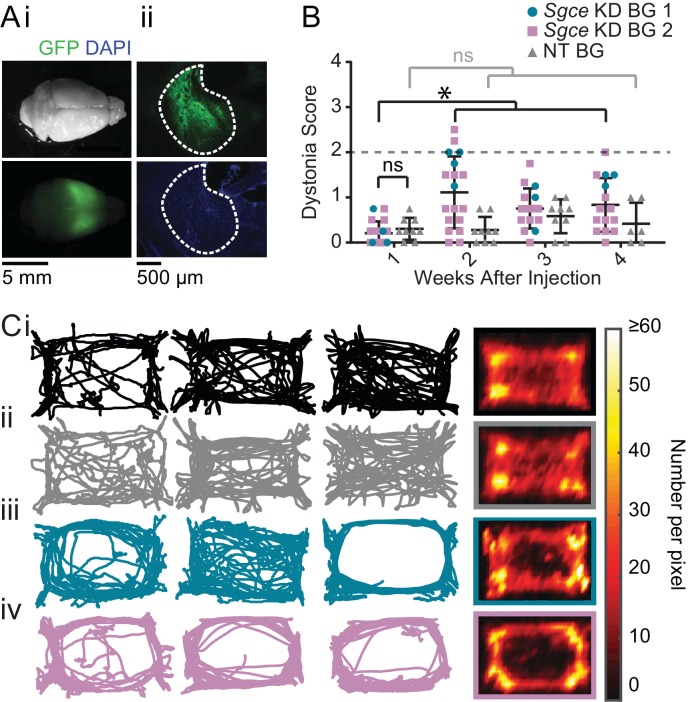
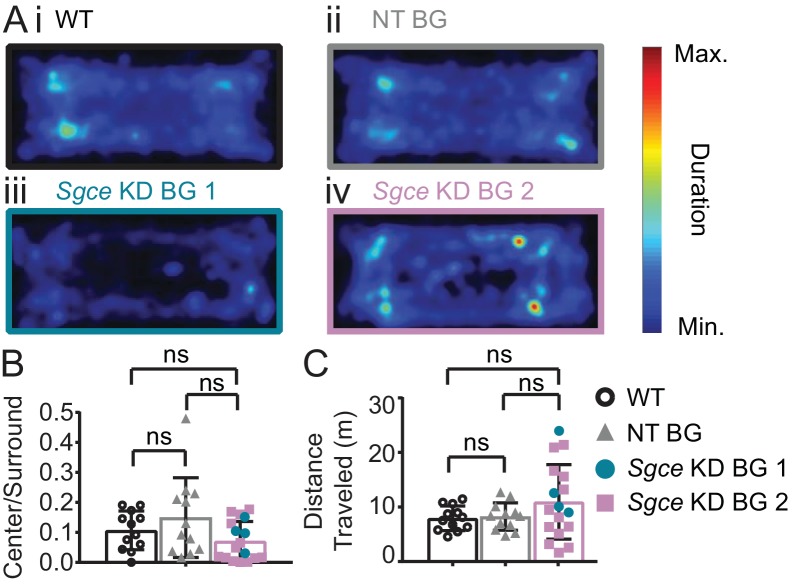
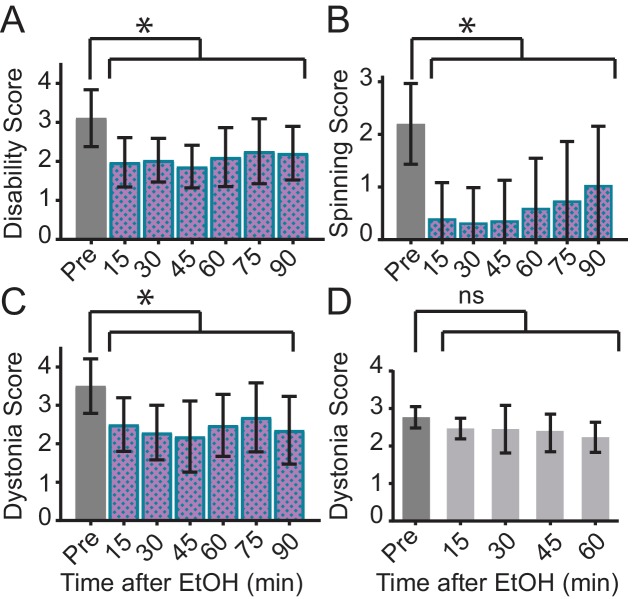
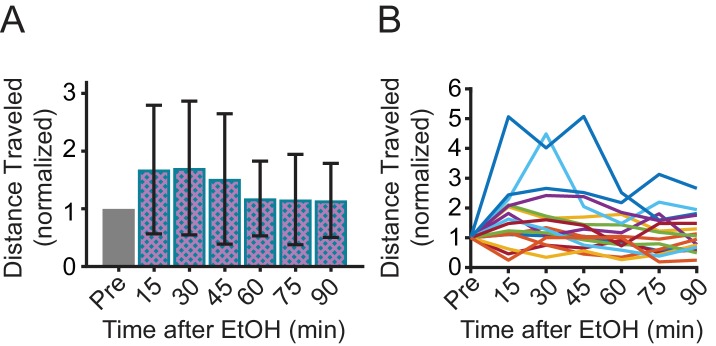
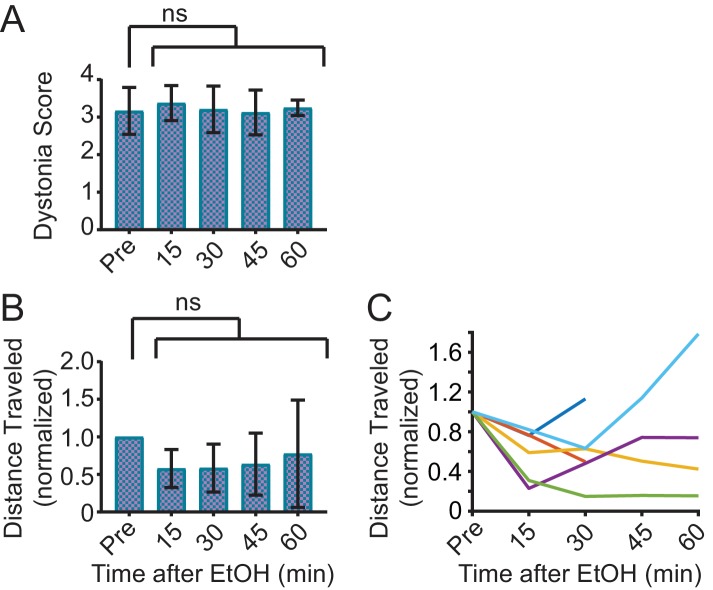
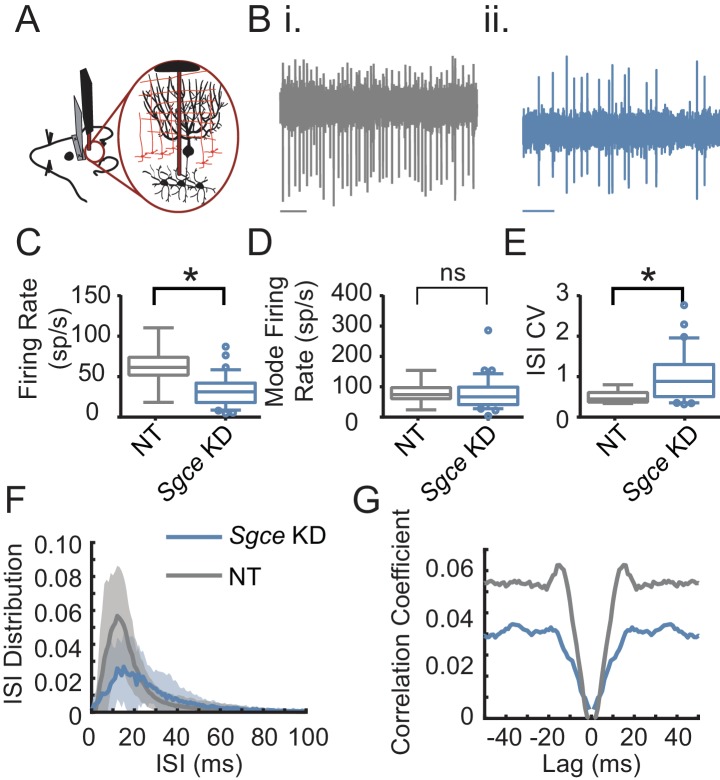
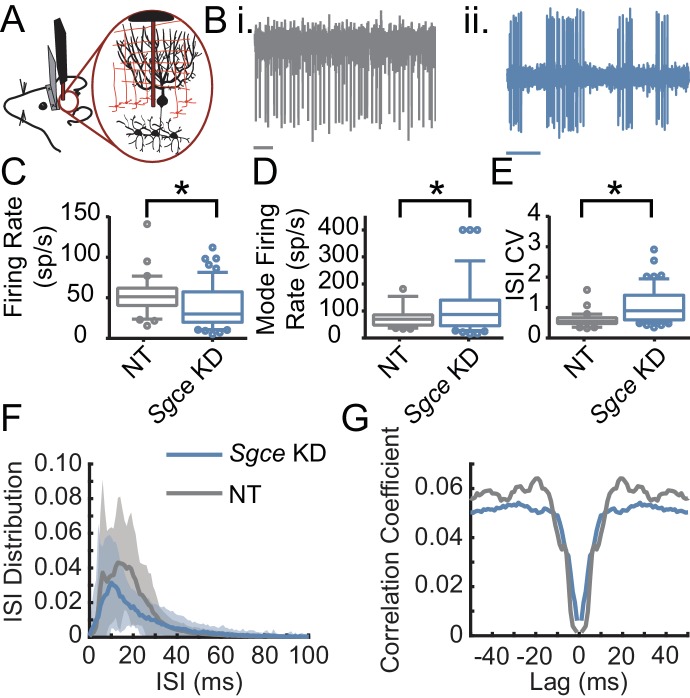
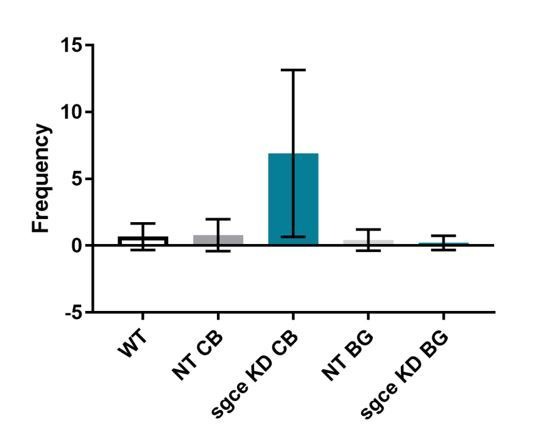
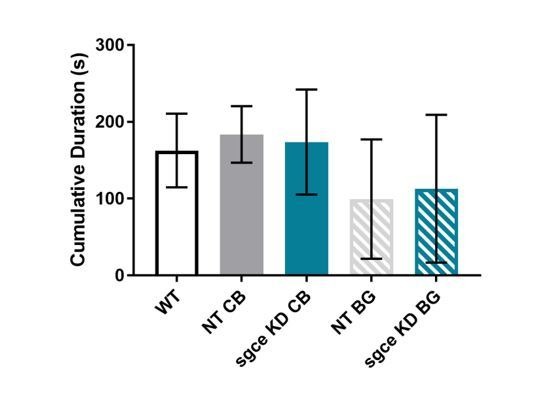
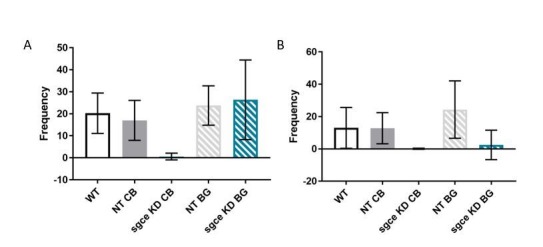
Myoclonus dystonia (DYT11) is a movement disorder caused by loss-of-function mutations in SGCE and characterized by involuntary jerking and dystonia that frequently improve after drinking alcohol. Existing transgenic mouse models of DYT11 exhibit only mild motor symptoms, possibly due to rodent-specific developmental compensation mechanisms, which have limited the study of neural mechanisms underlying DYT11. To circumvent potential compensation, we used short hairpin RNA (shRNA) to acutely knock down Sgce in the adult mouse and found that this approach produced dystonia and repetitive, myoclonic-like, jerking movements in mice that improved after administration of ethanol. Acute knockdown of Sgce in the cerebellum, but not the basal ganglia, produced motor symptoms, likely due to aberrant cerebellar activity. The acute knockdown model described here reproduces the salient features of DYT11 and provides a platform to study the mechanisms underlying symptoms of the disorder, and to explore potential therapeutic options.

Keywords: DYT11; alcohol responsive dystonia; mouse; myoclonus dystonia; neuroscience.


Conflict of interest statement

SW, RF, MM, CA, KK No competing interests declared

Figures

Figure 1.
Figure 1.. shRNA-mediated knockdown of Sgce in the cerebellum causes dystonia.
(A) Schematic of AAV-shSGCE-GFP construct. (B) Images of the whole brain (i) and sagittal cerebellar section (ii) from an Sgce KD CB mouse. (C) Quantification of qRT-PCR confirms that Sgce RNA is reduced in vivo. (Mann-Whitney Test, WT vs. NT CB: p=0.7922; NT CB vs. Sgce KD CB 1: p=0.0079; NT CB vs. Sgce KD CB 2: p=0.0159; NWT = 6, NNT CB = 5, NSgce KD CB 1 = 5, NSgce KD CB 2 = 4). (D,i) Injection of Sgce KD 1 and 2 into the cerebellum produced dystonia, while injection of NT did not. (Sgce KD CB 1: N = 39; Sgce KD CB 2: N = 40; NT CB: N = 16). Dystonia was measured on a previously published dystonia scale by four scorers blind to the condition of the animal. A score greater than or equal to two indicates dystonia. The dystonia scores for Sgce KD CB 1 and Sgce KD CB 2 mice for time points of 2 weeks or more after injection were significantly different from the dystonia scores of the same animals at <1 week (Wilcoxon matched-pairs signed rank test, p<0.01). The dystonia scores of Sgce KD CB 1 and Sgce KD CB 2 mice at <1 week after injection were not significantly different from NT CB mice at the same time point (t-test, Holm-Sidak method, p=0.81 and p=0.97, respectively). (ii) Example dystonic postures exhibited by Sgce KD CB mice. (E) Scatter plot of RNA levels normalized to the mean of WT, determined by qRT-PCR, plotted against the Dystonia Score observed in a subset of animals injected with varying concentrations of shRNA (WT: N = 5, NT: N = 5, Sgce KD CB 1: N = 13, Sgce KD CB 2: N = 7).
Figure 2.
Figure 2.. shRNA-mediated knockdown of Sgce in the basal ganglia causes motor abnormalities but does not cause overt dystonia.
(A) Images of the whole brain (i) and coronal section (ii) from an Sgce KD BG mouse. (B) Injection of Sgce KD- or NT-shRNA into the basal ganglia did not produce dystonia, as indicated by a score greater than two on the Dystonia scale. (Sgce KD BG 1: N = 4; Sgce KD BG 2: N = 14; NT BG: N = 9). The dystonia scores for Sgce KD BG mice for time points of 2 weeks or more after injection were significantly different from the dystonia scores of the same animals at 1 week (Wilcoxon matched-pairs signed rank test, p<0.001). The dystonia scores of Sgce KD BG mice at 1 week after injection were not significantly different from NT BG mice at the same time point (t-test, Holm-Sidak method, p=0.36). (C) Sgce KD BG 1 (iii) and Sgce KD BG 2 mice (iv) appeared to ambulate more in the periphery of the open field chamber than wild-type (i) and NT BG (ii) mice. The first three columns show example tracks from individual mice. The last column depicts the average, which reflects the number of times the center of mass was detected at a pixel in the arena, and excludes frames where the animal did not move. (WT: N = 12, NT BG: N = 12, Sgce KD BG 1: N = 4; Sgce KD BG 2: N = 13).
Figure 2—figure supplement 1.
Figure 2—figure supplement 1.. Sgce KD BG mice spend qualitatively less time in the center of the open field with no significant change in the ratio of distance traveled.
(A) Average duration spent per pixel in the open field chamber (WT: N = 12, NT BG: N = 12, Sgce KD BG 1: N = 4; Sgce KD BG 2: N = 13). (B) Ratio of duration of time spent in the center, to the duration of time spent in the surround in a 5 min video (Mean + S.D., WT: N = 12, NT BG: N = 12, Sgce KD BG 1: N = 4; Sgce KD BG 2: N = 13, 1way ANOVA, Holm-Sidak’s multiple comparisons test, p>0.05 for all comparisons). (C) Distance traveled (m) in a 5 min video (Mean + S.D., WT: N = 12, NT BG: N = 12, Sgce KD BG 1: N = 4; Sgce KD BG 2: N = 13, 1way ANOVA, Holm-Sidak’s multiple comparisons test, p>0.05 for all comparisons).
Figure 2—figure supplement 2.
Figure 2—figure supplement 2.. Sgce KD CB mice did not show a preference for the periphery and avoidance of the center.
(A) Sgce KD CB 1 (ii) and Sgce KD CB 2 mice (iii) showed no difference in ambulation in the open field chamber compared to NT CB (i) mice. Columns 1–3 are example tracks from individual mice, and column four is the average (NT CB: N = 14, Sgce KD CB 1: N = 11, Sgce KD CB 2: N = 9).
Figure 3.
Figure 3.. Ethanol relieves motor symptoms in Sgce KD CB, but not Tor1a KD CB, mice.
(A) Disability score of Sgce KD CB mice after ethanol injection. Ethanol reduces the disability score of mice injected with shRNA against Sgce. Alleviation of symptoms persisted for up to 90 min after ethanol (p<0.0001, 1way ANOVA, Mean + S.D., N = 16). (B) Spinning score of Sgce KD CB mice after ethanol injection. Ethanol reduces the spinning score of mice injected with shRNA against Sgce. (p<0.0001, 1way ANOVA, Mean + S.D., N = 19). (C) Dystonia score of Sgce KD CB mice after ethanol injection. Ethanol significantly reduced the dystonia score of Sgce KD CB mice (p<0.0001, 1way ANOVA, Mean + S.D., N = 16). (D) Dystonia score of Tor1a KD mice after ethanol injection. Ethanol had no effect of the dystonia score, which reflects the primary symptoms caused by Tor1a knockdown, in mice injected with shRNA against Tor1a (p=0.2391, 1way ANOVA, Mean + S.D., N = 5).
Figure 3—figure supplement 1.
Figure 3—figure supplement 1.. The effect of EtOH on distance travelled varies among individual mice.
(A) Total distance traveled in the open field after ethanol injection, normalized to distance traveled before ethanol (Pre) (1way ANOVA, p=0.0148, N = 16, Dunnett’s multiple comparisson’ test, p>0.05 at each time point). (B) Data in (A) presented for each mouse.
Figure 3—figure supplement 2.
Figure 3—figure supplement 2.. Saline does not improve symptoms in Sgce KD CB mice.
(A) Dystonia score of Sgce KD CB mice after saline injection. Saline had no effect on the dystonia score of Sgce KD CB mice (p=0.9516, 1wayANVOA, N = 6). (B) Total distance traveled in the open field after EtOH injection, normalized to distance traveled before ethanol (Pre) (p=0.2851, 1way ANOVA, N = 6). (C) Data in (B) presented for each mouse.
Figure 4.
Figure 4.. Cerebellar nuclei neurons fire aberrantly in Sgce KD CB mice.
(A) Experimental schematic. Extracellular electrophysiological recordings were made from neurons in the cerebellar nuclei in awake, head-restrained mice. (B) Example traces from a mouse injected with non-targeting shRNA (i) and shRNA against Sgce (ii). Scale bar represents 100 ms. (C) Average firing rates of DCN neurons in NT CB and Sgce KD CB animals (NT CB = 62.9 ± 24.8 spikes/s, n = 9, N = 4 and Sgce KD CB = 32.2 ± 19.5 spikes/s, n = 32, N = 8, Mean ± S.D.; Welch’s t-test, p=0.0057). (D) Mode firing rates of DCN neurons in NT CB and Sgce KD CB animals (NT CB = 80.4 ± 36.6 and Sgce KD CB = 74.8 ± 53.5 spikes/s, Mean ± S.D.; Welch’s t-test, p=0.73). (E) Interspike interval coefficients of variation of DCN neurons in NT CB and Sgce KD CB animals (NT CB = 0.50 ± 0.16 and Sgce KD CB = 1.00 ± 0.61, Mean ± S.D.; Welch’s t-test, p=0.0002). (F) Normalized ISI histogram of DCN neurons in NT CB and Sgce KD CB mice. (G) Autocorrelogram of DCN neurons in NT CB and Sgce KD CB mice.
Figure 5.
Figure 5.. Purkinje cells fire aberrantly in Sgce KD CB mice.
(A) Experimental schematic. Extracellular electrophysiological recordings were made from Purkinje cells in awake, head-restrained mice. (B) Example traces of Purkinje cells from an NT CB (i) or Sgce KD CB (ii) mouse. Scale bar represents 100 ms. (C) Average firing rates of Purkinje cells in NT CB and Sgce KD CB animals (NT CB = 53.3 ± 24.1 spikes/s, n = 30, N = 4 and Sgce KD CB = 39.2 ± 26.6 spikes/s, n = 57, N = 11, Mean ± S.D.; Welch’s t-test, p=0.0028). (D) Mode firing rates of Purkinje cells in NT CB and Sgce KD CB animals (NT CB = 77.5 ± 41.6 spikes/s and Sgce KD CB = 115.0 ± 99.4 spikes/s, Mean ± S.D.; Welch’s t-test, p=0.0158). (E) Interspike interval coefficients of variation of Purkinje cells in NT CB and Sgce KD CB animals (NT CB = 0.60 ± 0.25 and Sgce KD CB = 1.06 ± 0.57, Mean ± S.D.; Welch’s t-test, p<0.0001). (F) Normalized ISI histogram of Purkinje cells in NT CB and Sgce KD CB mice. (G) Autocorrelogram of Purkinje cells in NT CB and Sgce KD CB mice.
Author response image 1.
Author response image 1.. Increased frequency of walking backward observed in sgce KD CB mice.
Mice were recorded for 5 minutes in the open field. Walking backward was scored manually by 1 observer blind to the condition of the animal. Increased walking backward was observed in sgce KD CB, but not NT CB, sgce KD BG, or NT BG mice. 1-way ANOVA with Holm-Sidak’s correction for multiple comparisons: p < 0.0001 for WT vs. sgce KD CB, NT CB vs. sgce KD CB, sgce KD CB vs. NT BG, and sgce KD CB vs. sgce KD BG. N, WT = 12; N, NT CB = 14; N, sgce KD CB = 20; N, NT BG = 12; N, sgce KD BG = 19. All data in all figures are represented as mean together with the standard deviation.
Author response image 2.
Author response image 2.. Cumulative duration of time spent inactive in sgce KD CB and sgce BG mice did not differ from NT CB or NT BG mice, respectively, or WT mice.
1-way ANOVA with Holm-Sidak’s correction for multiple comparisons: p > 0.05 for WT vs. NT CB, WT vs. NT BG, WT vs. sgce KD CB, WT vs. sgce KD BG, NT CB vs. sgce KD CB, and NT BG vs. sgce KD BG; N, WT = 12; N, NT CB = 14; N, sgce KD CB = 20; N, NT BG = 12; N, sgce KD BG = 19.
Author response image 3.
Author response image 3.. Rearing is decreased in sgce KD animals.
(A) Supported rearing was reduced in sgce KD CB animals, compared to WT and NT CB mice. 1-way ANOVA with Holm-Sidak’s correction for multiple comparisons: p < 0.0001 for WT vs. sgce KD CB and NT CB vs. sgce KD CB; N, WT = 12; N, NT CB = 14; N, sgce KD CB = 20; N, NT BG = 12; N, sgce KD BG = 19. (B) Supported rearing was reduced in both sgce KD CB and sgce KD BG animals compared to WT and NT CB, and WT and NT BG mice, respectively. 1-way ANOVA with Holm-Sidak’s correction for multiple comparisons: p = 0.0086 for WT vs. sgce KD CB; p = 0.0071 for NT CB vs. sgce KD CB; p < 0.0391 for WT vs. sgce KD BG; p < 0.0001 for NT BG vs. agce KD BG; N, WT = 12; N, NT CB = 14; N, sgce KD CB = 20; N, NT BG = 12; N, sgce KD BG = 19.

References

    1. Albanese A, Bhatia K, Bressman SB, Delong MR, Fahn S, Fung VS, Hallett M, Jankovic J, Jinnah HA, Klein C, Lang AE, Mink JW, Teller JK. Phenomenology and classification of dystonia: a consensus update. Movement Disorders. 2013;28:863–873. doi: 10.1002/mds.25475. - DOI - PMC - PubMed
    1. Asmus F, Zimprich A, Tezenas Du Montcel S, Kabus C, Deuschl G, Kupsch A, Ziemann U, Castro M, Kühn AA, Strom TM, Vidailhet M, Bhatia KP, Dürr A, Wood NW, Brice A, Gasser T. Myoclonus-dystonia syndrome: epsilon-sarcoglycan mutations and phenotype. Annals of Neurology. 2002;52:489–492. doi: 10.1002/ana.10325. - DOI - PubMed
    1. Azoulay-Zyss J, Roze E, Welter ML, Navarro S, Yelnik J, Clot F, Bardinet E, Karachi C, Dormont D, Galanaud D, Pidoux B, Cornu P, Vidailhet M, Grabli D. Bilateral deep brain stimulation of the pallidum for myoclonus-dystonia due to ε-sarcoglycan mutations: a pilot study. Archives of Neurology. 2011;68:94–98. doi: 10.1001/archneurol.2010.338. - DOI - PubMed
    1. Belmeguenai A, Botta P, Weber JT, Carta M, De Ruiter M, De Zeeuw CI, Valenzuela CF, Hansel C. Alcohol impairs long-term depression at the cerebellar parallel fiber-Purkinje cell synapse. Journal of Neurophysiology. 2008;100:3167–3174. doi: 10.1152/jn.90384.2008. - DOI - PMC - PubMed
    1. Beukers RJ, Foncke EM, van der Meer JN, Nederveen AJ, de Ruiter MB, Bour LJ, Veltman DJ, Tijssen MA. Disorganized sensorimotor integration in mutation-positive myoclonus-dystonia: a functional magnetic resonance imaging study. Archives of Neurology. 2010;67:469–474. doi: 10.1001/archneurol.2010.54. - DOI - PubMed

Publication types

MeSH terms

Supplementary concepts