. 2019 Dec 23:8:e50161.
doi: 10.7554/eLife.50161.

Metabolic modulation regulates cardiac wall morphogenesis in zebrafish

Affiliations

Metabolic modulation regulates cardiac wall morphogenesis in zebrafish

Ryuichi Fukuda et al. Elife. .

Abstract

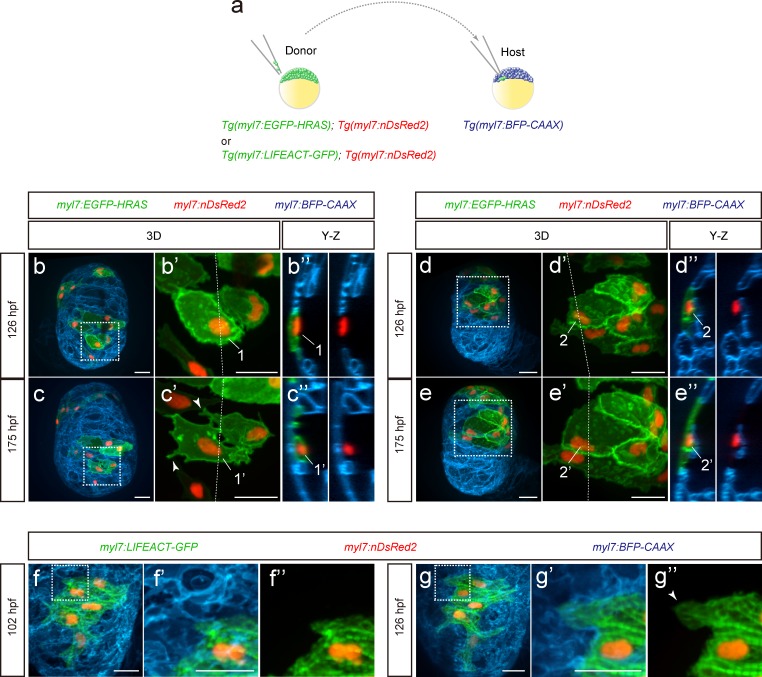
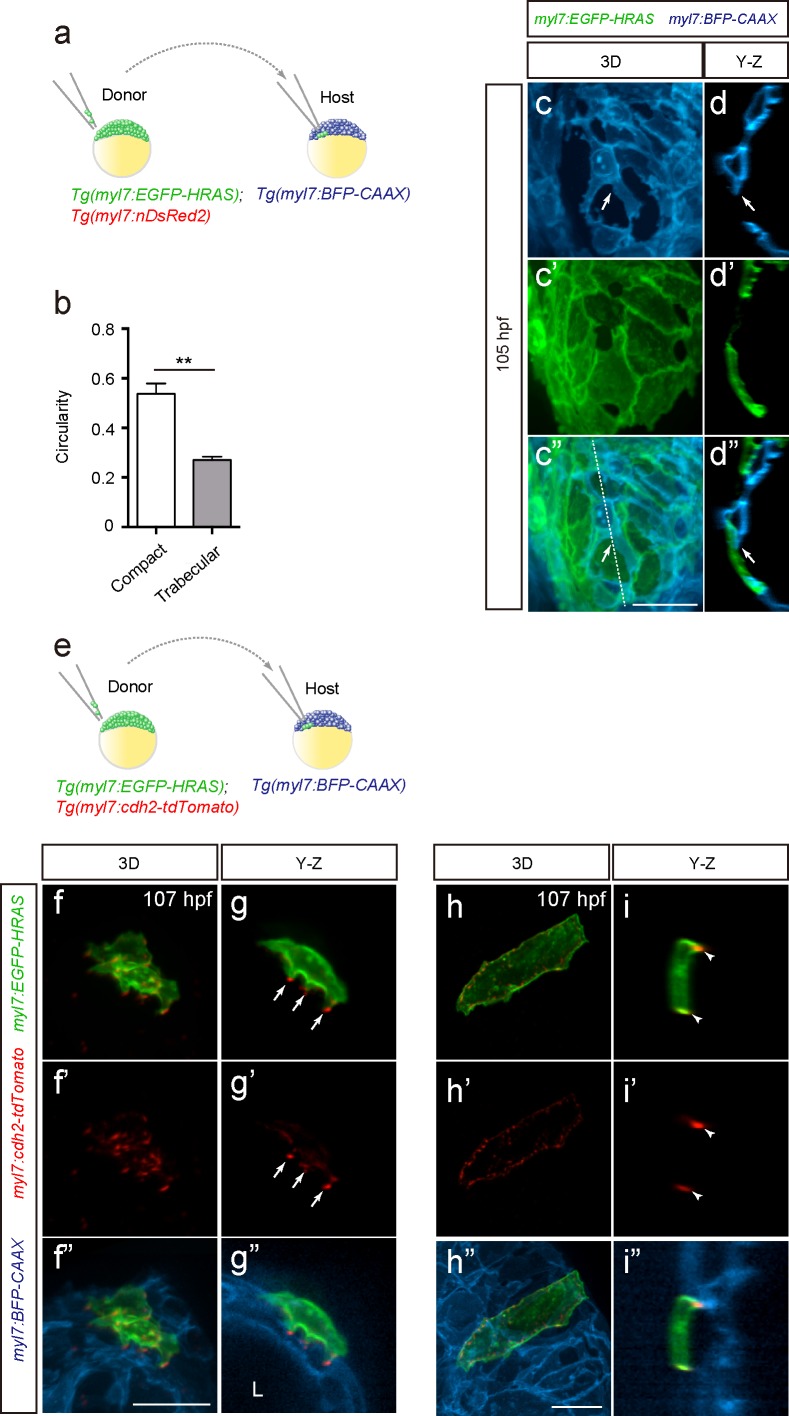
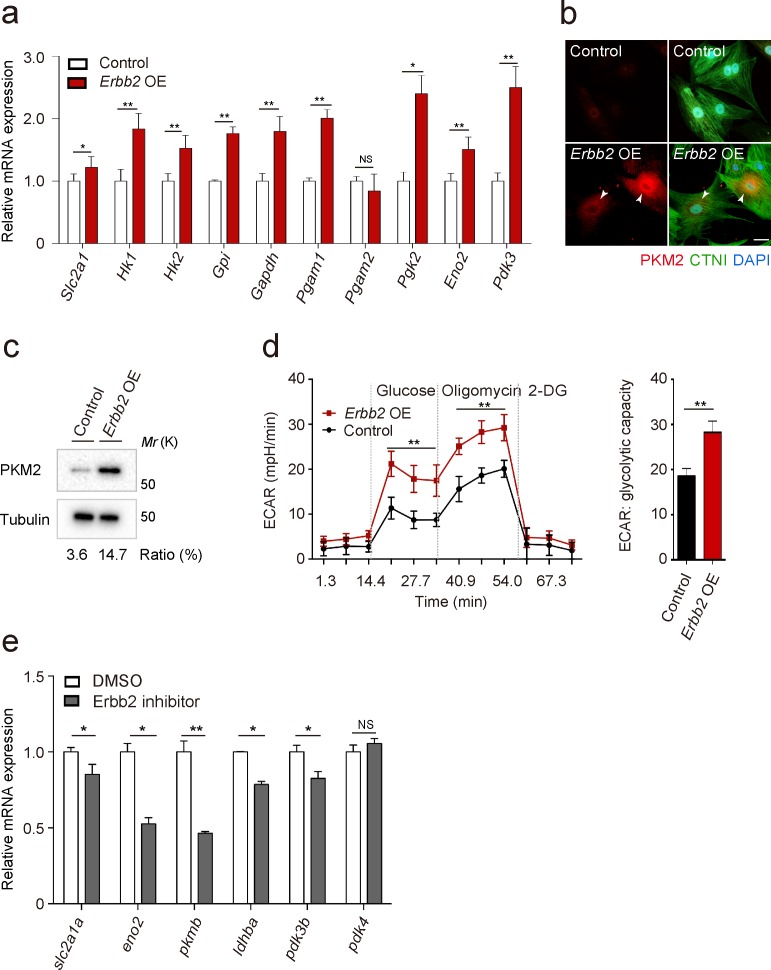
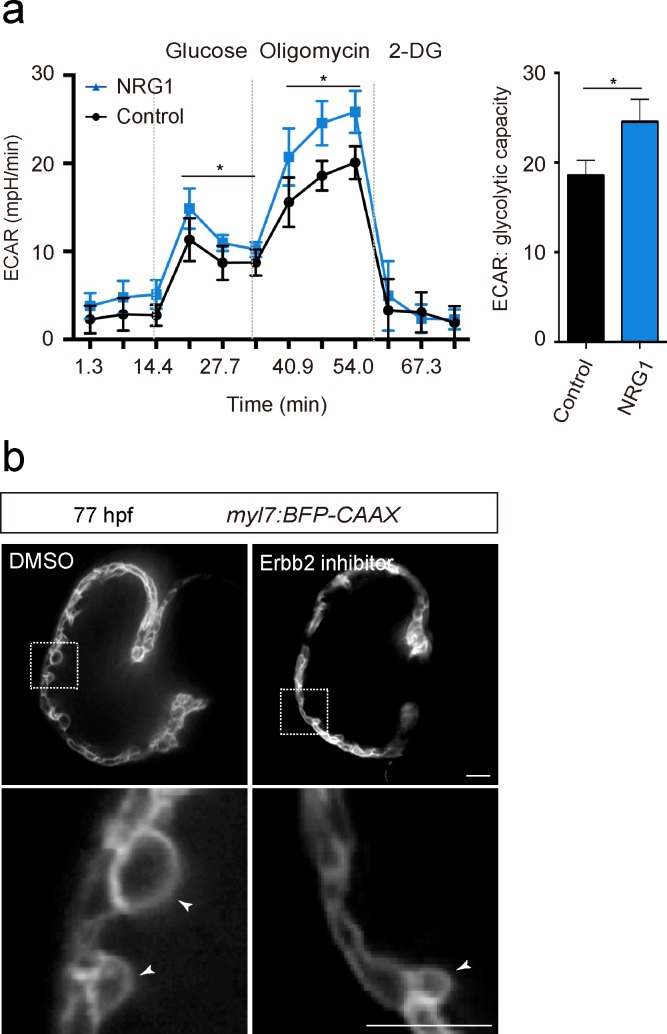
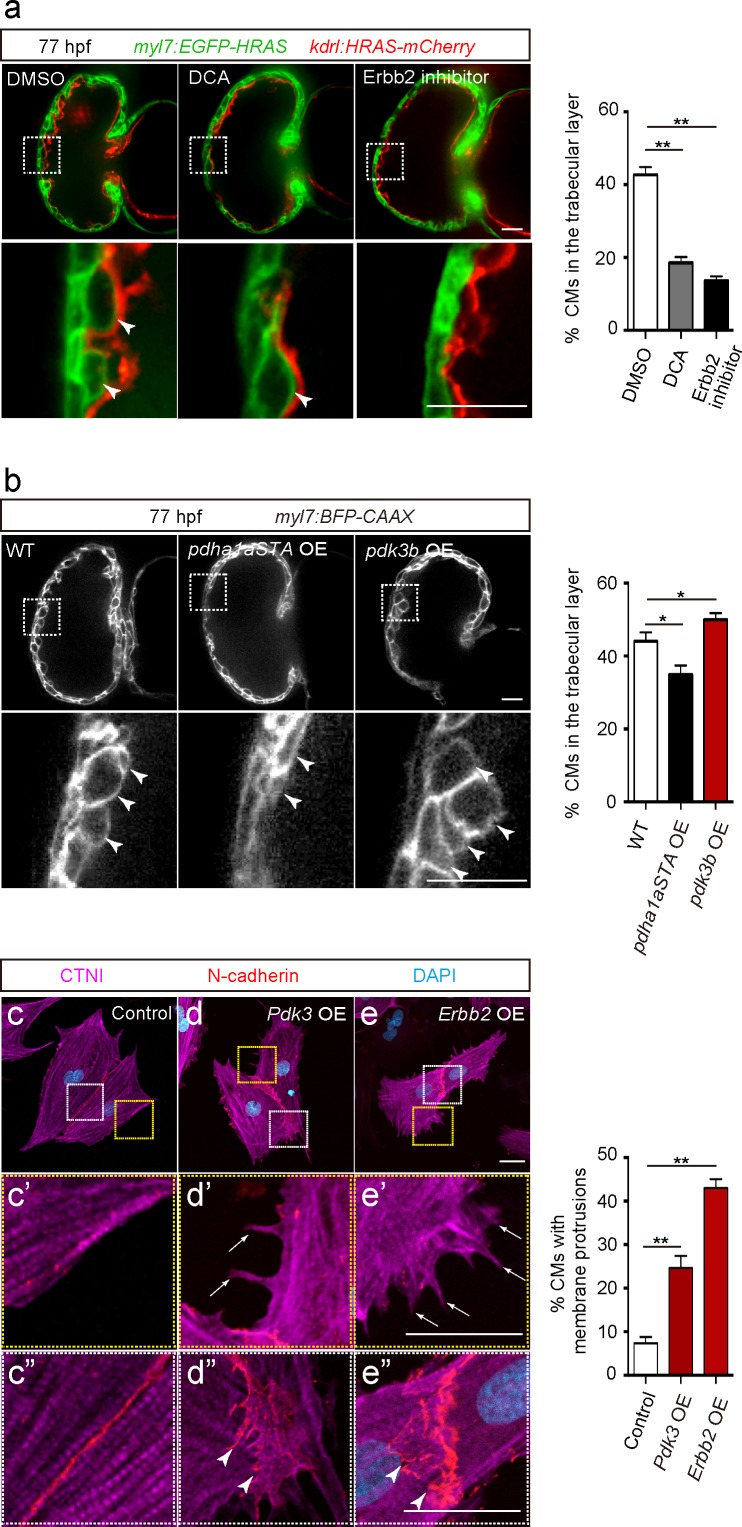
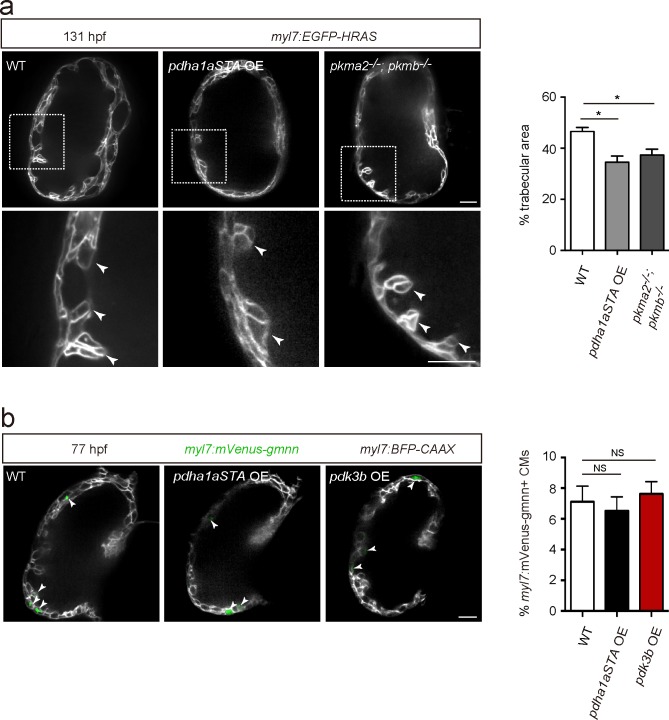
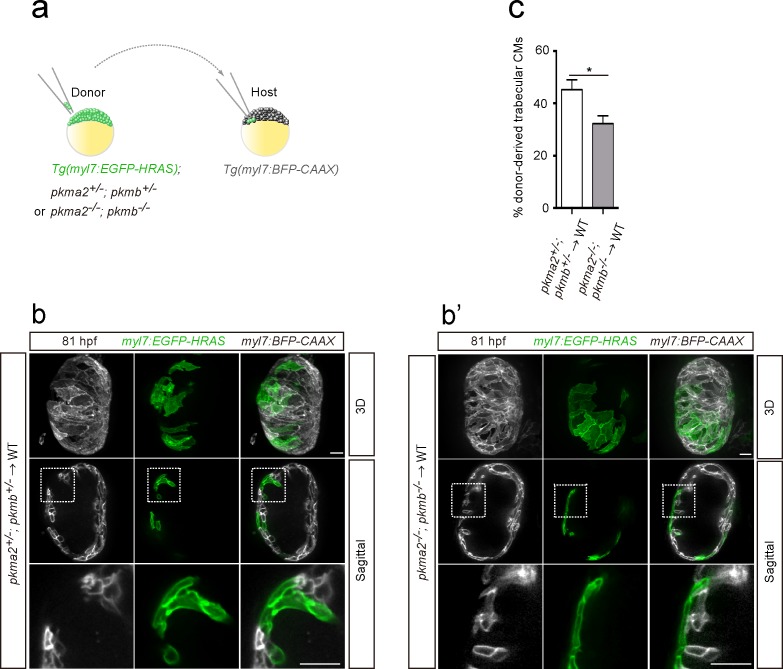
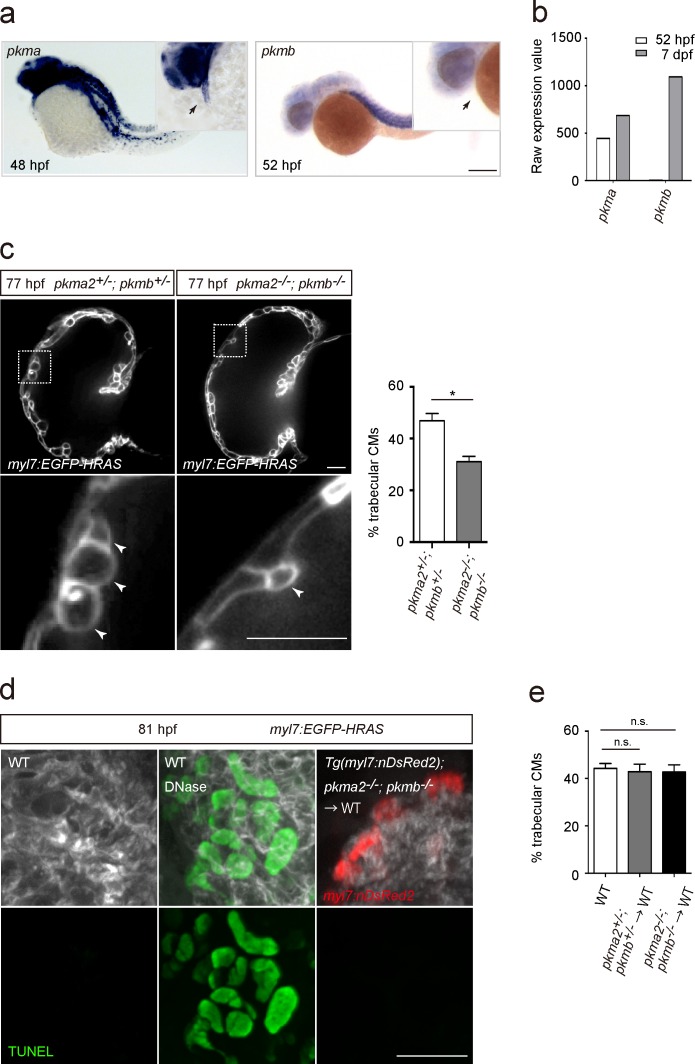
During cardiac development, cardiomyocytes form complex inner wall structures called trabeculae. Despite significant investigation into this process, the potential role of metabolism has not been addressed. Using single cell resolution imaging in zebrafish, we find that cardiomyocytes seeding the trabecular layer actively change their shape while compact layer cardiomyocytes remain static. We show that Erbb2 signaling, which is required for trabeculation, activates glycolysis to support changes in cardiomyocyte shape and behavior. Pharmacological inhibition of glycolysis impairs cardiac trabeculation, and cardiomyocyte-specific loss- and gain-of-function manipulations of glycolysis decrease and increase trabeculation, respectively. In addition, loss of the glycolytic enzyme pyruvate kinase M2 impairs trabeculation. Experiments with rat neonatal cardiomyocytes in culture further support these observations. Our findings reveal new roles for glycolysis in regulating cardiomyocyte behavior during cardiac wall morphogenesis.

Keywords: cardiomyocytes; cell biology; developmental biology; glycolysis; heart development; metabolism; trabeculation; zebrafish.


Conflict of interest statement

RF, AA, YO, OS, ME, HM, MP, ET No competing interests declared, DS Senior editor, eLife

Figures

Figure 1.
Figure 1.. Cardiomyocyte behavior during cardiac trabeculation.
(a) Schematic of the transplantation experiment. (b–e) 3D time-course images of chimeric hearts; magnified view (b’, c’, d’, e’) of area in white boxes and Y-Z plane images (b”, c”, d”, e”) along white dashed lines (b’, c’, d’, e’). CMs initially in the compact layer (b’, b”) enter the trabecular layer (c’, c”) exhibiting morphological changes and membrane protrusions (c’; arrowheads; n = 5 CMs); CMs remaining in the compact layer (d’, d”, e’, e”) do not exhibit obvious morphological changes (n = 5 CMs). The same CMs are shown at 126 and 175 hpf as indicated in the images. (f, g) 3D time-course images of chimeric heart; magnified view (f’, f”, g’, g”) of area in white boxes. CMs entering the trabecular layer exhibit partial disassembly of their sarcomeres (g’; arrowhead). Scale bars, 20 μm.
Figure 1—figure supplement 1.
Figure 1—figure supplement 1.. Cardiomyocytes change morphology and exhibit cell-cell junction rearrangements when entering the trabecular layer.
(a) Schematic of the transplantation experiment. (b) Circularity analysis of CMs in the compact and trabecular layers (n = 7–9 CMs from 3 to 5 ventricles). (c–c”) 3D images of chimeric hearts; Y-Z plane images (d–d”) along white dashed line (c”). A host-derived CM entering the trabecular layer exhibits membrane protrusions (c, d, c’, d’; arrows). (e) Schematic of the transplantation experiment. (f–f”, h–h”) 3D images of chimeric hearts; Y-Z plane images (g–g”, i–i”). A CM entering the trabecular layer exhibits N-cadherin localization in protruding membranes (g, g’; arrows), while a CM remaining in the compact layer exhibits lateral localization of N-cadherin (i, i’; arrowheads). L, cardiac lumen. Error bars, s.e.m.; **p<0.001 by two-tailed unpaired t-test. Scale bars, 20 μm.
Figure 2.
Figure 2.. ERBB2 signaling activates glycolysis in cardiomyocytes.
(a) qPCR analysis of mRNA levels of glycolytic enzyme genes in control and Erbb2 overexpressing (OE) rat neonatal CMs (n = 3). Error bars, s.e.m. (b) Staining for PKM2, CTNI and DNA (DAPI) in control and Erbb2 OE rat neonatal CMs; arrowheads point to PKM2+ CMs. (c) Western blot analysis of PKM2 levels in control and Erbb2 OE rat neonatal CMs. (d) Extracellular acidification rate (ECAR) analysis in control and Erbb2 OE rat neonatal CMs; glycolytic capacity shown on the right (n = 7). Error bars, s.d. (e) qPCR analysis of mRNA levels of glycolytic enzyme genes in DMSO and Erbb2 inhibitor treated zebrafish hearts (n = 3). Error bars, s.e.m.; *p<0.05 and **p<0.001 by two-tailed unpaired t-test. NS, not significant. Scale bar, 20 μm.
Figure 2—figure supplement 1.
Figure 2—figure supplement 1.. NRG1/ERBB2 signaling activates glycolysis in CMs.
(a) ECAR analysis in control and NRG1 treated rat neonatal CMs; glycolytic capacity shown on the right (n = 7). (b) Confocal images (mid-sagittal sections) of 77 hpf zebrafish hearts treated with DMSO or Erbb2 inhibitor; magnified view of area in white boxes shown below; arrowheads point to CMs in the trabecular layer. Error bars, s.d.; *p<0.05 by two-tailed unpaired t-test. Scale bars, 20 μm.
Figure 2—figure supplement 2.
Figure 2—figure supplement 2.. Uncropped images related to western blotting data.
Figure 3.
Figure 3.. Glycolysis regulates cardiac trabeculation.
(a) Confocal images (mid-sagittal sections) of 77 hpf hearts treated with DMSO, dichloroacetate (DCA) or Erbb2 inhibitor; magnified view of area in white boxes shown below; arrowheads point to CMs in the trabecular layer; percentage of CMs in the trabecular layer shown on the right (n = 5–7 ventricles). (b) Confocal images (mid-sagittal sections) of 77 hpf Tg(myl7:BFP-CAAX) alone or in combination with Tg(myl7:pdha1aSTA-P2A-tdTomato) or Tg(myl7:pdk3b-P2A-tdTomato) hearts; magnified view of area in white boxes shown below; arrowheads point to CMs in the trabecular layer; percentage of CMs in the trabecular layer shown on the right (n = 5–7 ventricles). (c–e”) Staining for CTNI, N-cadherin and DNA (DAPI) in control (c), Pdk3 (d) and Erbb2 (e) OE rat neonatal CMs; magnified view of area in yellow (c’, d’, e’) and white (c”, d”, e”) boxes; percentage of CMs exhibiting membrane protrusions shown on the right (n = 3 individual experiments; each value corresponds to an average of 30 CMs). Pdk3 and Erbb2 OE causes rat neonatal CMs to exhibit membrane protrusions (d’, e’; arrows) and cell-cell junction rearrangements (d’, e’; arrowheads). Error bars, s.e.m.; *p<0.05 and **p<0.001 by ANOVA followed by Tukey’s HSD test. Scale bars, 20 μm.
Figure 3—figure supplement 1.
Figure 3—figure supplement 1.. Cardiomyocyte proliferation does not appear to be affected by modulation of glycolysis.
(a) Confocal images (mid-sagittal sections) of 131 hpf Tg(myl7:EGFP-HRAS) alone or in combination with Tg(myl7:pdha1aSTA-P2A-tdTomato) and of 131 hpf Tg(myl7:EGFP-HRAS); pkma2-/-; pkmb-/- hearts; magnified view of area in white boxes shown below; arrowheads point to trabecular CMs; percentage of trabecular area shown on the right (n = 5 ventricles). (b) Confocal images (mid-sagittal sections) of 77 hpf Tg(myl7:mVenus-gmnn); Tg(myl7:BFP-CAAX) alone or in combination with Tg(myl7:pdha1aSTA-P2A-tdTomato) or Tg(myl7:pdk3b-P2A-tdTomato) hearts; arrowheads point to myl7:mVenus-Gmnn+ CMs; percentage of myl7:mVenus-Gmnn + CMs shown on the right (n = 5 ventricles). Error bars, s.e.m.; *p<0.05 and **p<0.001 by two-tailed unpaired t-test (a) or ANOVA followed by Tukey’s HSD test (b). NS, not significant. Scale bars, 20 μm.
Figure 4.
Figure 4.. Loss of pkm2 impairs cardiac trabeculation.
(a) Schematic of the transplantation experiment. (b, b’) 3D and mid-sagittal section images of chimeric hearts using pkma2+/-; pkmb+/-; Tg(myl7:EGFP-HRAS) (b) and pkma2-/-; pkmb-/-; Tg(myl7:EGFP-HRAS) (b’) cells as donors; magnified view of area in white boxes shown below. (c) Percentage of donor-derived trabecular CMs (n = 10 ventricles). Error bars, s.e.m.; *p<0.05 by two-tailed unpaired t-test. Scale bars, 20 μm.
Figure 4—figure supplement 1.
Figure 4—figure supplement 1.. Glycolytic enzymes regulate cardiac trabeculation.
(a) Analysis of pkma and pkmb mRNA expression by in situ hybridization; magnified view shown in the top right corner; arrows point to the heart. (b) Expression levels of pkma and pkmb in 52 hpf and seven dpf hearts as detected by microarray analysis. (c) Confocal images (mid-sagittal sections) of 77 hpf Tg(myl7:EGFP-HRAS); pkma2+/-; pkmb+/- and Tg(myl7:EGFP-HRAS); pkma2-/-; pkmb-/- hearts; magnified view of area in white boxes shown below; arrowheads point to CMs in the trabecular layer; percentage of CMs in the trabecular layer shown on the right (n = 5–7 ventricles). (d) TUNEL assay in WT and chimeric hearts using Tg(myl7:nDsRed2); pkma2-/-; pkmb-/- cells as donors. As a positive control for the TUNEL assay, WT embryos were treated with DNase. (e) Percentage of trabecular CMs in WT and chimeric hearts using pkma2+/-; pkmb+/- or pkma2-/-; pkmb-/- cells as donors (n = 5 ventricles). Error bars, s.e.m.; *p<0.05 by two-tailed unpaired t-test (c) or ANOVA followed by Tukey’s HSD test (e). Scale bars, 200 μm in a; 20 μm in c and d.
Author response image 1.
Author response image 1.. Redox analysis.
70 hpf Tg(myl7:mitochondrial-Rogofp2Orp1) hearts were examined and 405 nm/488 nm ratios determined for redox state analysis. Relative values of 405 nm/488 nm in compact and trabecular cardiomyocytes are shown.

Comment in

References

    1. Carpenter RL, Paw I, Dewhirst MW, Lo H-W. Akt phosphorylates and activates HSF-1 independent of heat shock, leading to Slug overexpression and epithelial–mesenchymal transition (EMT) of HER2-overexpressing breast cancer cells. Oncogene. 2015;34:546–557. doi: 10.1038/onc.2013.582. - DOI - PMC - PubMed
    1. Cherian AV, Fukuda R, Augustine SM, Maischein HM, Stainier DY. N-cadherin relocalization during cardiac trabeculation. PNAS. 2016;113:7569–7574. doi: 10.1073/pnas.1606385113. - DOI - PMC - PubMed
    1. Chi NC, Shaw RM, De Val S, Kang G, Jan LY, Black BL, Stainier DY. Foxn4 directly regulates tbx2b expression and atrioventricular canal formation. Genes & Development. 2008;22:734–739. doi: 10.1101/gad.1629408. - DOI - PMC - PubMed
    1. Christofk HR, Vander Heiden MG, Wu N, Asara JM, Cantley LC. Pyruvate kinase M2 is a phosphotyrosine-binding protein. Nature. 2008;452:181–186. doi: 10.1038/nature06667. - DOI - PubMed
    1. Corfas G, Rosen KM, Aratake H, Krauss R, Fischbach GD. Differential expression of ARIA isoforms in the rat brain. Neuron. 1995;14:103–115. doi: 10.1016/0896-6273(95)90244-9. - DOI - PubMed

Publication types

MeSH terms

Substances