

Methodological considerations for the high sensitivity detection of multiple myeloma measurable residual disease
- PMID: 31868315
- PMCID: PMC7741435
- DOI: 10.1002/cyto.b.21862
Methodological considerations for the high sensitivity detection of multiple myeloma measurable residual disease
Abstract
Background: Recent advances in therapeutic interventions have dramatically improved complete response rates in patients with multiple myeloma (MM). The ability to identify residual myeloma cells (e.g., measurable residual disease [MRD]) can provide valuable information pertaining to patient's depth of response to therapy and risk of relapse. Multiparametric flow cytometry is an excellent technique to monitor MRD and has been demonstrated to correlate with patient outcome post-treatment. To achieve the high sensitivity (one abnormal cell in 105 -106 cells) required for MRD evaluation, millions of cells have to be acquired and conventional immunophenotyping protocols are unable to attain these numbers, indicating the needs for alternative flow cytometric staining procedures. A bulk, "Pre-lysis" method is the consensus approach for staining large number of cells, requires two red blood cell lysis steps, and can adversely affect epitope density. In this study, we tested the "Pooled-tube" and "Dextran Sedimentation" staining procedures and correlated them with the "Pre-lysis" method as potential alternative approaches.
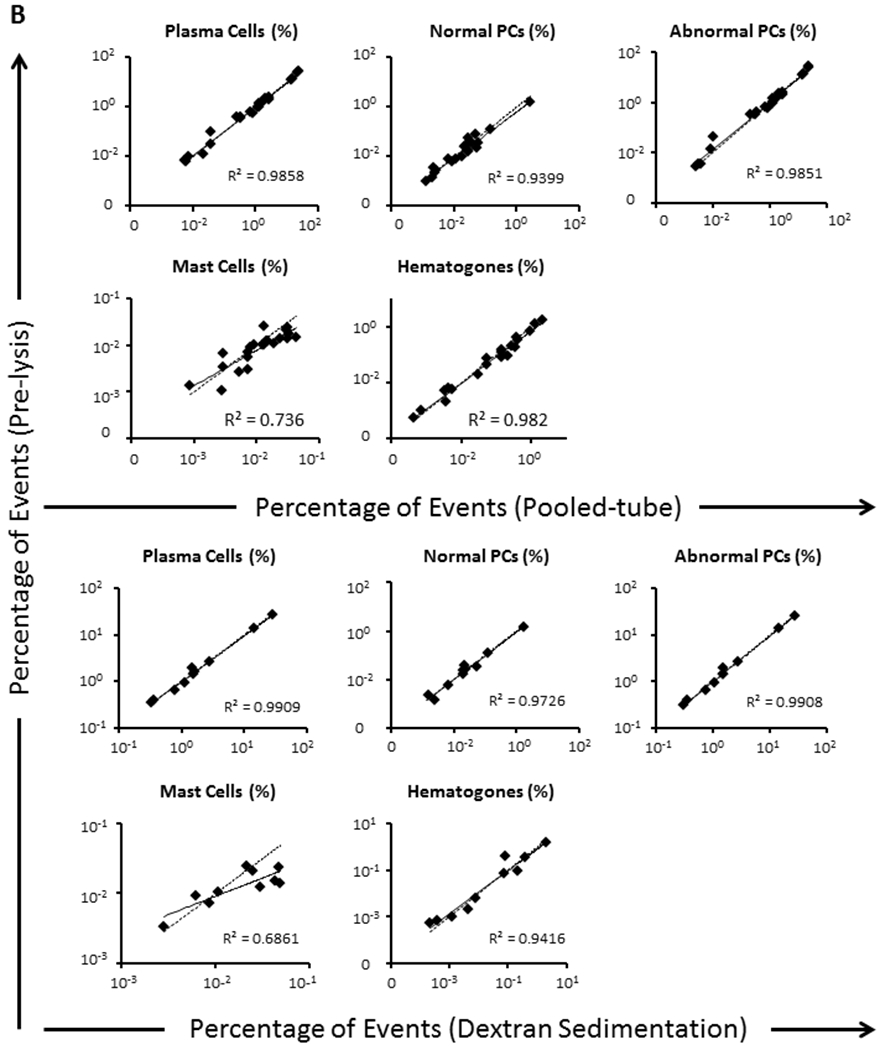
Methods: A total of 22 bone marrow aspirates from patients with plasma cell (PC) dyscrasia were processed in parallel using the "Pre-lysis," "Pooled-tube," and "Dextran Sedimentation" techniques. Stain indices were calculated and compared to assess their impacts on staining performance for each antibody used in the consensus panel. The recovery of normal and abnormal PCs, mast cells, and B cell precursors was enumerated and compared after their counts were normalized using fluorescent beads. The limit of blank, limit of detection, and lower limit of quantification were established using serial dilution experiments.
Results: The staining performances of CD19 PECy7, CD27 BV510, CD81 APCH7, and CD138 BV421 were improved using the "Pooled-tube" method when compared to "Pre-lysis." "Pre-lysis" was better at resolving CD56 using clone C5.9 but our results demonstrated similar improvement can also be achieved by "Pooled-tube" when alternative CD56 PE clones were used. "Dextran sedimentation" yielded similar staining results when compared to "Pre-lysis" for all the markers analyzed. The "Pooled-tube" method, when normalized to "Pre-lysis," recovered higher numbers of total PCs (1.2 ± 0.2 times higher; p = .049), normal PCs (1.4 ± 0.26; p = .007), mast cells (1.46 ± 0.27; p = .003), and B cell precursors (1.42 ± 0.3; p = .011), but not abnormal PCs (1.09 ± 0.2; p = .352). There was no evidence that the recovery of cells was different between "Pre-lysis" versus "Dextran Sedimentation." All three flow cytometric assays achieved a minimum sensitivity of 10-5 and approached that of 10-6 for detecting rare events.
Conclusion: Both "Pooled-tube" and "Dextran Sedimentation" staining procedures were comparable to the "Pre-lysis" method and are suitable high sensitivity flow cytometric approaches that can be used to process bone marrow samples for MM MRD testing.
Keywords: dextran sedimentation; flow cytometry; high sensitivity; measurable residual disease; multiple myeloma; pooled-tube; pre-lysis.
© 2019 International Clinical Cytometry Society.
Figures


Similar articles
-
Immunophenotype of normal vs. myeloma plasma cells: Toward antibody panel specifications for MRD detection in multiple myeloma.Cytometry B Clin Cytom. 2016 Jan;90(1):61-72. doi: 10.1002/cyto.b.21265. Epub 2015 Jul 31. Cytometry B Clin Cytom. 2016. PMID: 26100534 Review.
-
Utility and feasibility of a six-color multiparametric flow cytometry for measurable residual disease analysis in plasma cell myeloma in resource-limited settings with 5-year survival data.J Cancer Res Ther. 2021 Oct-Dec;17(6):1515-1520. doi: 10.4103/jcrt.JCRT_1027_19. J Cancer Res Ther. 2021. PMID: 34916387
-
Assessment of plasma cell myeloma minimal residual disease testing by flow cytometry in an international inter-laboratory study: Is it ready for primetime use?Cytometry B Clin Cytom. 2019 May;96(3):201-208. doi: 10.1002/cyto.b.21754. Epub 2018 Dec 19. Cytometry B Clin Cytom. 2019. PMID: 30565840
-
Monitoring of Measurable Residual Disease in Multiple Myeloma by Multiparametric Flow Cytometry.Curr Protoc Cytom. 2019 Sep;90(1):e63. doi: 10.1002/cpcy.63. Epub 2019 Jul 17. Curr Protoc Cytom. 2019. PMID: 31608132 Free PMC article.
-
Evaluation of measurable residual disease in multiple myeloma by multiparametric flow cytometry: Current paradigm, guidelines, and future applications.Int J Lab Hematol. 2021 Jul;43 Suppl 1:43-53. doi: 10.1111/ijlh.13562. Int J Lab Hematol. 2021. PMID: 34288449 Review.
Cited by
-
Spatiotemporal assessment of immunogenomic heterogeneity in multiple myeloma.Blood Adv. 2023 Mar 14;7(5):718-733. doi: 10.1182/bloodadvances.2022007457. Blood Adv. 2023. PMID: 35868022 Free PMC article.
-
The role of minimal residual disease and serum free light chain ratio in the management of multiple myeloma.Discov Oncol. 2024 Jun 15;15(1):229. doi: 10.1007/s12672-024-01090-1. Discov Oncol. 2024. PMID: 38877340 Free PMC article. Review.
-
Consensus for Flow Cytometry Clinical Report on Multiple Myeloma: A Multicenter Harmonization Process Merging Laboratory Experience and Clinical Needs.Cancers (Basel). 2023 Mar 30;15(7):2060. doi: 10.3390/cancers15072060. Cancers (Basel). 2023. PMID: 37046720 Free PMC article.
-
Harmonization of Flow Cytometric Minimal Residual Disease Assessment in Multiple Myeloma in Centers of Polish Myeloma Consortium.Diagnostics (Basel). 2021 Oct 11;11(10):1872. doi: 10.3390/diagnostics11101872. Diagnostics (Basel). 2021. PMID: 34679569 Free PMC article.
-
Current Status of Flow Cytometric Immunophenotyping of Hematolymphoid Neoplasms in Korea.Ann Lab Med. 2024 May 1;44(3):222-234. doi: 10.3343/alm.2023.0298. Epub 2023 Dec 26. Ann Lab Med. 2024. PMID: 38145891 Free PMC article.
References
-
- Siegel RL, Miller KD, Jemal A. Cancer statistics, 2018. CA Cancer J Clin 2018;68:7–30. - PubMed
-
- Moreau P, Attal M, Facon T. Frontline therapy of multiple myeloma. Blood 2015;125:3076. - PubMed
-
- Abramson HN. The Multiple Myeloma Drug Pipeline-2018: A Review of Small Molecules and Their Therapeutic Targets. Clinical Lymphoma Myeloma & Leukemia 2018;18:611–627. - PubMed
Publication types
MeSH terms
Grants and funding
LinkOut - more resources
Full Text Sources
Other Literature Sources
Medical
Research Materials
Miscellaneous
