. 2019 Dec 24:8:e48890.
doi: 10.7554/eLife.48890.

Development, calibration, and validation of a novel human ventricular myocyte model in health, disease, and drug block

Affiliations

Development, calibration, and validation of a novel human ventricular myocyte model in health, disease, and drug block

Jakub Tomek et al. Elife. .

Abstract

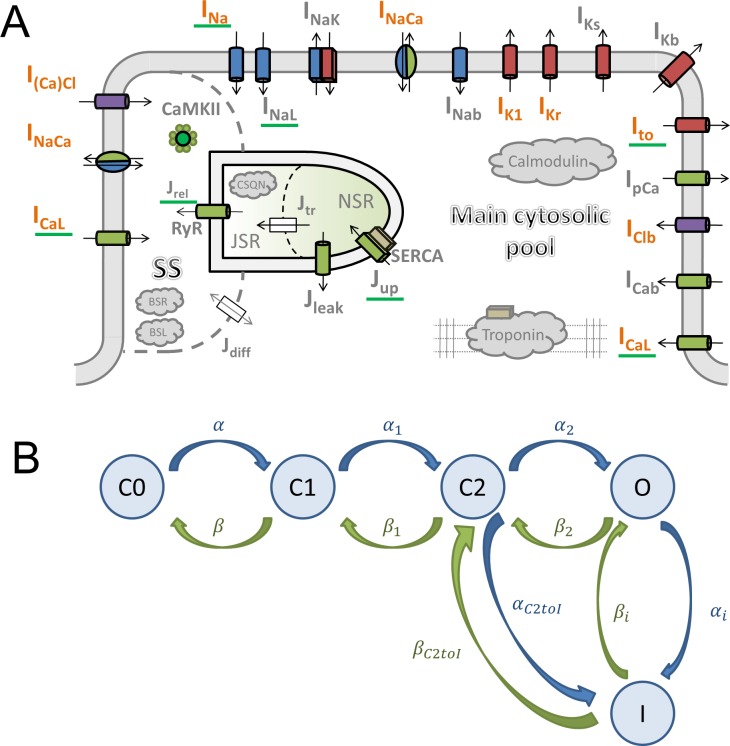
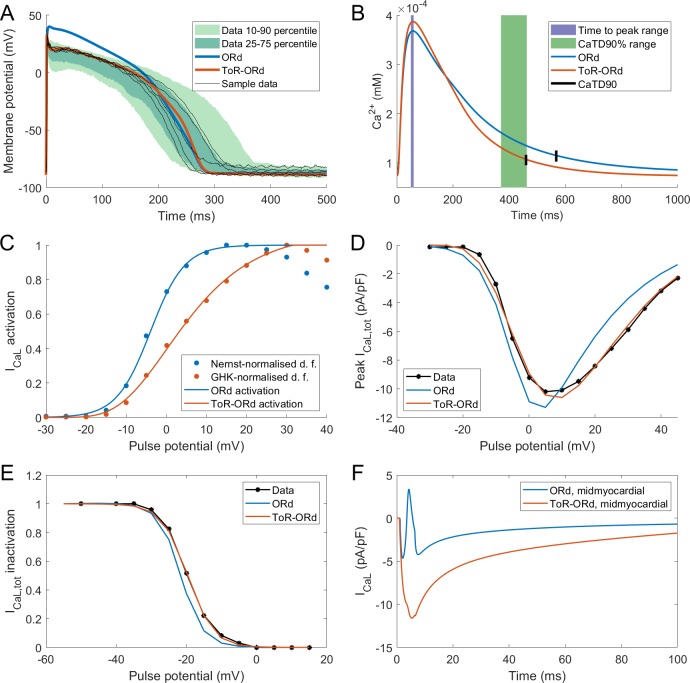
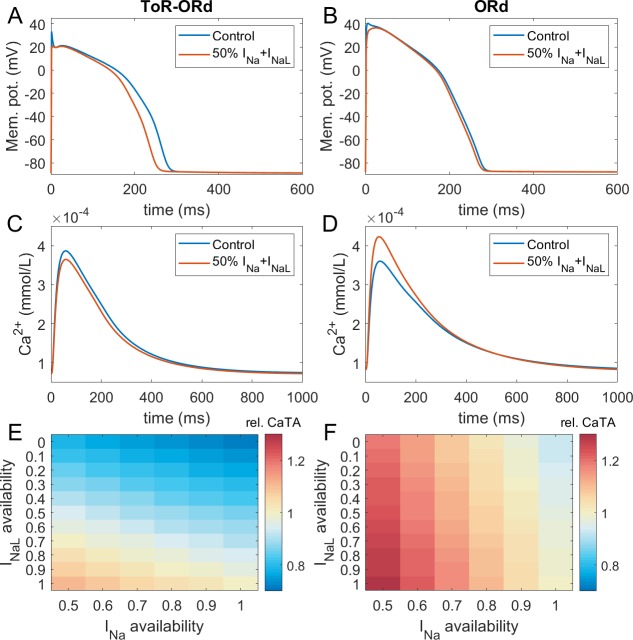
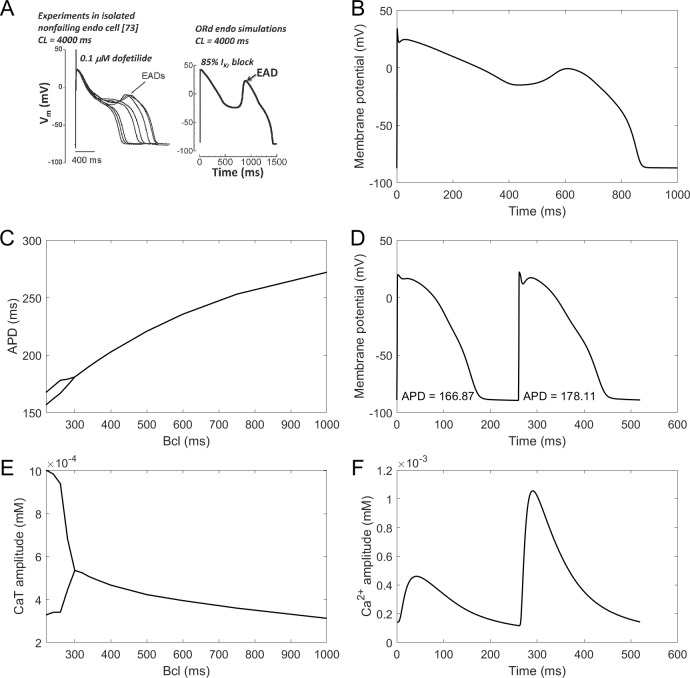
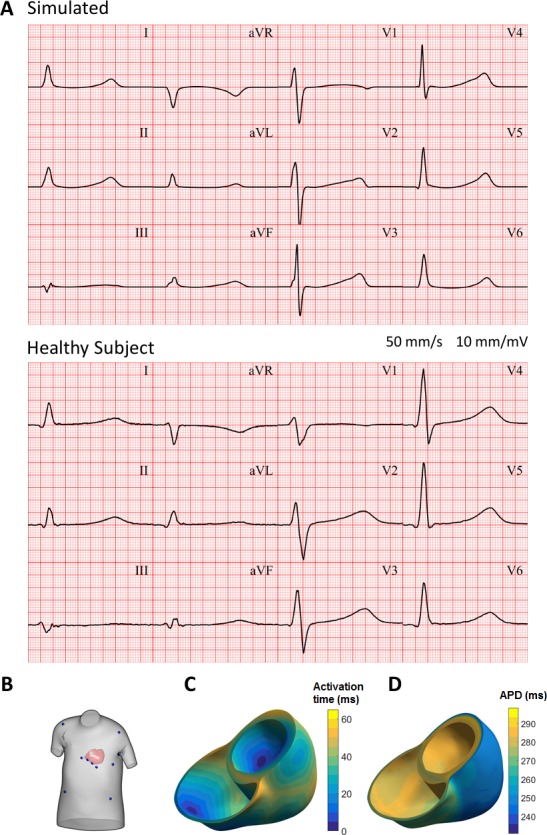
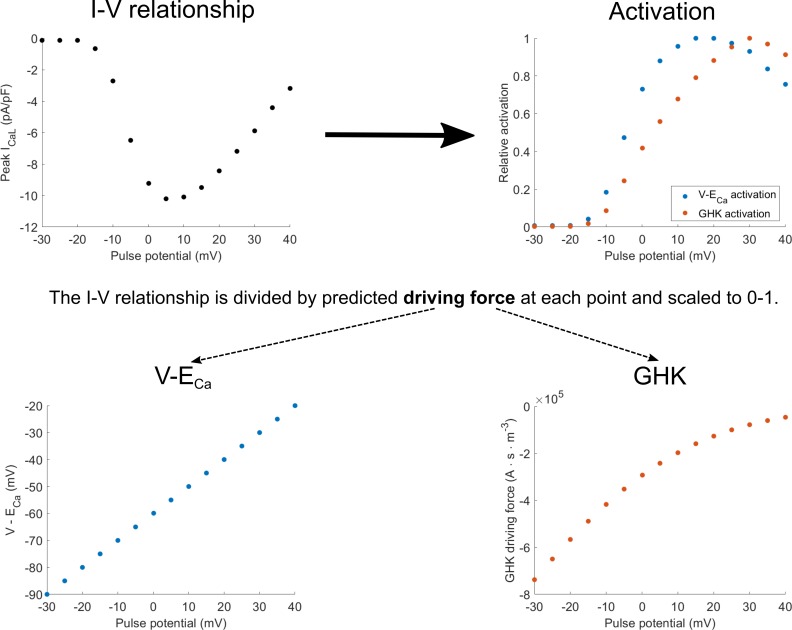
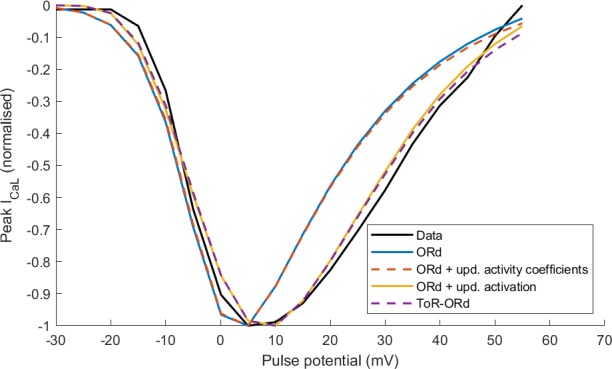
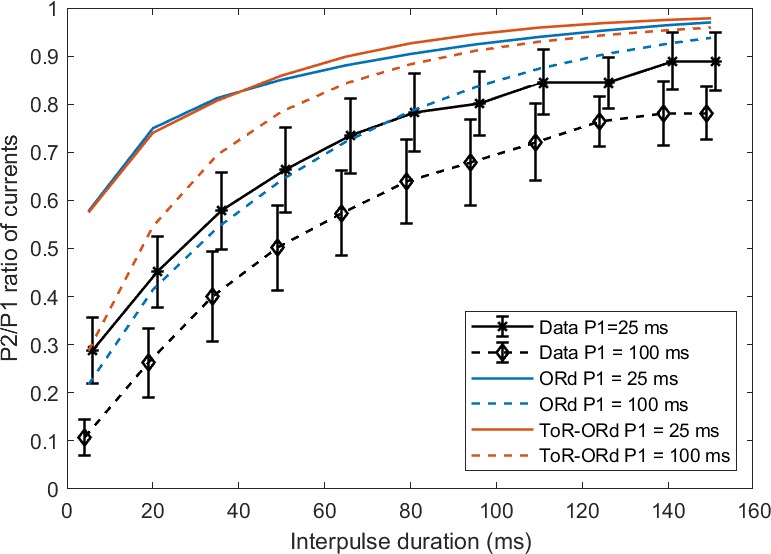
Human-based modelling and simulations are becoming ubiquitous in biomedical science due to their ability to augment experimental and clinical investigations. Cardiac electrophysiology is one of the most advanced areas, with cardiac modelling and simulation being considered for virtual testing of pharmacological therapies and medical devices. Current models present inconsistencies with experimental data, which limit further progress. In this study, we present the design, development, calibration and independent validation of a human-based ventricular model (ToR-ORd) for simulations of electrophysiology and excitation-contraction coupling, from ionic to whole-organ dynamics, including the electrocardiogram. Validation based on substantial multiscale simulations supports the credibility of the ToR-ORd model under healthy and key disease conditions, as well as drug blockade. In addition, the process uncovers new theoretical insights into the biophysical properties of the L-type calcium current, which are critical for sodium and calcium dynamics. These insights enable the reformulation of L-type calcium current, as well as replacement of the hERG current model.

Keywords: calibration validation; cell biology; computational biology; computer simulations; heart; human; systems biology; ventricular myocyte.

Plain language summary

Decades of intensive experimental and clinical research have revealed much about how the human heart works. Though incomplete, this knowledge has been used to construct computer models that represent the activity of this organ as a whole, and of its individual chambers (the atria and ventricles), tissues and cells. Such models have been used to better understand life-threatening irregular heartbeats; they are also beginning to be used to guide decisions about the treatment of patients and the development of new drugs by the pharmaceutical industry. Yet existing computer models of the electrical activity of the human heart are sometimes inconsistent with experimental data. This problem led Tomek et al. to try to create a new model that was consistent with established biophysical knowledge and experimental data for a wide range of conditions including disease and drug action. Tomek et al. designed a strategy that explicitly separated the construction and validation of a model that could recreate the electrical activity of the ventricles in a human heart. This model was able to integrate and explain a wide range of properties of both healthy and diseased hearts, including their response to different drugs. The development of the model also uncovered and resolved theoretical inconsistencies that have been present in almost all models of the heart from the last 25 years. Tomek et al. hope that their new human heart model will enable more basic, translational and clinical research into a range of heart diseases and accelerate the development of new therapies.


Conflict of interest statement

JT, AB, EP, XZ, AM, OB, CB, SS, AS, LV, AV, BR No competing interests declared

Figures

Figure 1.
Figure 1.. Model structure.
(A) A schematic of the novel human ventricular myocyte model for electrophysiology and calcium handling. Orange indicates components, substituted, or added, compared to the original ORd model. ‘SS’ indicates junctional subspace compartment, where calcium influx via L-type calcium current occurs and where calcium is released from the sarcoplasmic reticulum. ‘JSR’ and ‘NSR’ are junctional and network sarcoplasmic reticulum compartments, respectively. ‘Main cytosolic pool’ is the remaining intracellular space. Transmembrane currents are indicated with an ‘I’ in their name, with fluxes indicated as ‘J’. Components with a green underscore are modulated by CaMKII signalling. (B) The structure of the Lu-Vandenberg (Lu et al., 2001) Markov model used for the rapidly activating delayed rectifier repolarisation current (IKr). The transition rates are given in Appendix 1-15.3.5.
Figure 2.
Figure 2.. Action potential, calcium transient, and ICaL in ToR-ORd.
Action potential (A) and calcium transient (B) at 1 Hz obtained with the ToR-ORd model following calibration, compared to those obtained with the ORd model and experimental data from O'Hara et al. (2011) and Coppini et al. (2013), respectively. The purple and green zones in (B) stand for mean ± standard deviation. The duration of calcium transient at 90% recovery was extracted from figures in Coppini et al. (2013), adding the time to peak and time from peak to 90% recovery. (C) Activation curves used in the ToR-ORd and ORd models (blue and red lines, respectively). The points correspond to the IV relationship measured in Magyar et al. (2000) normalised by the Nernstian driving force (d.f.) assuming reversal potential of +60 mV (blue points) and the GHK driving force (red points). (D, E) I-V relationship and steady-state inactivation as measured in ToR-ORd (red line) versus ORd model (blue line) versus experimental data from Magyar et al. (2000) (black points with line). ICaL,tot is the sum of currents corresponding to all ions (Ca2+, Na+, and K+) passing through the L-type calcium current channels. (F) L-type calcium current of a midmyocardial cell, showing current reversal in ORd, but not in ToR-ORd. Only the calcium component of ICaL,tot is shown to demonstrate that the current reversal is not due to other ions. We note that the difference in total amplitude of ICaLin Figure 2F follows predominantly from different action potential shape in ToR-ORd vs ORd, consistent with the I-V relationship.
Figure 3.
Figure 3.. Sodium blockade in ToR-ORd and ORd.
Simulated effect of sodium current block on the action potential (A, B) and calcium transient (C,D) using the ToR-ORd (left) and ORd (right) models. Control simulations are shown as blue traces, whereas results for 50% block of INa and INaL are shown as red traces. Panels (E,F) show values of changes in calcium transient amplitude with respect to control (‘rel. CaTA’) for varying degrees of INa/INaL block for ToR-ORd and ORd respectively (one is no change, values > 1 correspond to an increase the calcium transient amplitude).
Figure 4.
Figure 4.. EADs and alternans.
(A) Experimentally observed EADs produced in nondiseased human myocytes exposed to 0.1 µM dofetilide (∼85% IKr block) paced at 0.25 Hz (Guo et al., 2011) and the corresponding simulation using the ORd model (O'Hara et al., 2011), figure reproduced as allowed by the CC-BY license). See Appendix 1-15.1.1 for ionic concentrations used. (B) An EAD produced by the ToR-ORd model at the same conditions. (C,E) APD and calcium transient amplitude versus pacing base cycle length (bcl); the bifurcation indicates alternans. (D,F) Example of APD and calcium transient alternans at the bcl of 260 ms.
Figure 5.
Figure 5.. Drug block and APD.
All four panels contain mean and standard deviation of experimental data (black) as measured in O'Hara et al. (2011) for three basic cycle lengths (bcl), predictions of the Dutta optimised dynamic-IKr ORd model (blue, Dutta et al., 2017a), and the predictions of the ToR-ORd model (red). (A) 1 µM E-4031 (70% IKr block). (B) 1 µM HMR-1556 (90% IKs block). (C) 10 µM mexiletine (54% INaL, 9% IKr, 20% ICaL block). (D) 1 µM nisoldipine (90% ICaL block). Drug concentrations and their effects on channel blocks are based on Dutta et al. (2017b).
Figure 6.
Figure 6.. APD accommodation and S1-S2 protocol.
(A) APD accommodation measured experimentally (Franz et al., 1988) and in simulation of the ORd model (reproduced as allowed by the CC-BY licence from O'Hara et al., 2011). (B) APD accommodation in ToR-ORd. (C) S1-S2 restitution curve (S1 = 1000 ms) in ToR-ORd fibre, ORd fibre (including INa modification to facilitate propagation Passini et al., 2016) and human tissue samples data (O'Hara et al., 2011).
Figure 7.
Figure 7.. Populations of models and drug safety prediction.
(A) Percentile-based summary of AP and calcium transient traces for the two populations of human ToR-ORd models (left side) and distribution of ionic current conductances among models in the population (right side), in the ranges [50-150]% (top row) and [0–200]% (bottom row) of the baseline values. (B) A comparison of 0–200% populations based on ToR-ORd (left) and ORd (right, based on Passini et al., 2017) in response to high-dose mexiletine (100-fold effective therapeutic dose). Traces classified as EADs are plotted in red (manifesting only in the ORd population). (C) TdP score obtained for simulations of the 62 reference compounds, based on the occurrence of drug-induced repolarisation abnormalities at all tested concentrations in the [0–200]% population of ToR-ORd models. The colours associated with drugs signify their established torsadogenicity as specified in Appendix 1-15.1.4. The logarithmic scale was considered to maximise the visual separation between safe and risky drugs. The classification based on the TdP score is summarised as a confusion matrix on the right, and also compared with the corresponding results obtained in a population of models based on the original ORd model (Passini et al., 2017).
Figure 8.
Figure 8.. Simulation of hypertrophic cardiomyopathy (HCM) and hyperkalemia.
(A) The effect of hyperkalemia on AP morphology; measured in the centre of a simulated fibre. (B) APD90 and effective refractory period (ERP) at varying extracellular potassium concentration. For extracellular potassium higher than 9 mM, full AP did not develop, but low-amplitude activation propagated through the fibre (Appendix 1-14). Membrane potential (C) and calcium transient (D) at 1 Hz pacing compared between a single healthy and HCM cell. (E) 50% IKr block induces EADs in HCM cell, but not in a healthy one.
Figure 9.
Figure 9.. Simulated and clinical 12-lead electrocardiogram.
(A) 12-lead ECGs at 1 Hz: simulation using the ToR-ORd model in an MRI-based human torso-ventricular model (top) and a healthy patient ECG record (bottom, https://physionet.org, PTB database, subject 122; Bousseljot et al., 1995; Goldberger et al., 2000). (B) Electrode positions on the simulated torso. (C) Activation time map. (D) APD map.
Appendix 1—figure 1.
Appendix 1—figure 1.. Diagram of how activation curves are extracted from the I-V relationship.
The activation curves (top right) are obtained by dividing values in the I-V curve (top left) at each pulse potential by the driving force considering either V-ECa-based driving force (bottom right) or the Goldman-Hodgkin-Katz (GHK) flux equation (bottom left).
Appendix 1—figure 2.
Appendix 1—figure 2.. Effect of the proposed changes in the activation curve and activation coefficient on the I-V relationship of ICaL in ORd versus ToR-ORd.
Appendix 1—figure 3.
Appendix 1—figure 3.. Goldman-Hodgkin-Katz equation with colour coding of components.
Appendix 1—figure 4.
Appendix 1—figure 4.. P2/P1 protocol for two pulse durations.
Appendix 1—figure 5.
Appendix 1—figure 5.. Effect of AP morphology on ICaL variables under sodium blockade.
(A) ICaL activation. (B) ICaL driving force. In (C) are shown ratios of curves from (B) red pointwise-divided by blue (shown in light blue) and purple pointwise-divided by yellow (shown in green).
Appendix 1—figure 6.
Appendix 1—figure 6.. Effect of sodium blockers on ToR-ORd and ORd in fibre.
Membrane potential in fibre at four simulated conditions (control, half block of fast sodium, half block of late sodium, and half block of both fast and late sodium currents) in ToR-ORd (A) and ORd (B). In (C, D) is given the corresponding calcium transient. The measurements were taken in the node at the half of the fibre; consequently, action potentials in the conditions including INa block are delayed to the other traces, given corresponding conduction delay.
Appendix 1—figure 7.
Appendix 1—figure 7.. AP clamps and resulting IKr.
(A,B) Endocardial and Purkinje AP used as an AP clamp (5th beat of the simulation shown). (C) IKr produced by the endocardial AP. (D) IKr produced by the Purkinje AP. Shown are data manually extracted from Lu et al. (2001), as well as simulations using ORd and ToR-ORd (L-V, coding for Lu-Vandenberg hERG model). A normalisation was performed in (C), (D) to facilitate the relative loss of IKr using the low-plateau AP shape. In (C), the three traces were normalised to 0–1 range via division by maxima of the traces: maxData, maxORd, maxLV. Subsequently, in (D), the data trace was divided by maxData, ORd simulation by maxORd, and the ToR-ORd model simulation by maxLV. Thus, both traces produced by a given model (or measured experimentally) are divided by the same number, allowing the assessment of relative reduction of IKr at the low-plateau AP.
Appendix 1—figure 8.
Appendix 1—figure 8.. Subthreshold fibre activation under extreme hyperkalemia.
This trace was measured at the centre of the simulated fibre.
Appendix 1—figure 9.
Appendix 1—figure 9.. Action potential morphology for three cell subtypes at 1 Hz pacing.
Appendix 1—figure 10.
Appendix 1—figure 10.. Evaluation pipeline.
The left menu shows a list of evaluation criteria with the adjacent icon indicating whether they are fulfilled by the model. The right pane contains figures visualising the model performance in the criteria. The figures can be either viewed by scrolling or by clicking the corresponding entry in the left menu. The report header contains a timestamp of the report generation and a slider which controls the size of figures in the right pane. The whole report is written in HTML, as automatically generated from Matlab code, and can be viewed in any internet browser.

References

    1. Beattie KA, Hill AP, Bardenet R, Cui Y, Vandenberg JI, Gavaghan DJ, de Boer TP, Mirams GR. Sinusoidal voltage protocols for rapid characterisation of ion channel kinetics. The Journal of Physiology. 2018;596:1813–1828. doi: 10.1113/JP275733. - DOI - PMC - PubMed
    1. Bhattacharyya ML, Vassalle M. Effects of tetrodotoxin on electrical and mechanical activity of cardiac purkinje fibers. Journal of Electrocardiology. 1982;15:351–360. doi: 10.1016/S0022-0736(82)81008-X. - DOI - PubMed
    1. Boukens BJ, Sulkin MS, Gloschat CR, Ng FS, Vigmond EJ, Efimov IR. Transmural APD gradient synchronizes repolarization in the human left ventricular wall. Cardiovascular Research. 2015;108:188–196. doi: 10.1093/cvr/cvv202. - DOI - PMC - PubMed
    1. Bousseljot R, Kreiseler D, Schnabel A. Nutzung der EKG-Signaldatenbank CARDIODAT der PTB über das internet. Biomedizinische Technik. 1995;40:317–318. doi: 10.1515/bmte.1995.40.s1.317. - DOI
    1. Bradley E, Webb TI, Hollywood MA, Sergeant GP, McHale NG, Thornbury KD. The cardiac sodium current na(v)1.5 is functionally expressed in rabbit bronchial smooth muscle cells. American Journal of Physiology. Cell Physiology. 2013;305:C427–C435. doi: 10.1152/ajpcell.00034.2013. - DOI - PubMed

Publication types

MeSH terms