. 2020 Mar 1;52(3):121-132.
doi: 10.1152/physiolgenomics.00087.2019. Epub 2019 Dec 23.

Transcriptomic signature of gut microbiome-contacting cells in colon of spontaneously hypertensive rats

Affiliations

Transcriptomic signature of gut microbiome-contacting cells in colon of spontaneously hypertensive rats

Tao Yang et al. Physiol Genomics. .

Abstract

Fecal matter transfer from hypertensive patients and animals into normotensive animals increases blood pressure, strengthening the evidence for gut-microbiota interactions in the control of blood pressure. However, cellular and molecular events involved in gut dysbiosis-associated hypertension remain poorly understood. Therefore, our objective in this study was to use gene expression profiling to characterize the gut epithelium layer in the colon in hypertension. We observed significant suppression of components of T cell receptor (TCR) signaling in the colonic epithelium of spontaneously hypertensive rats (SHR) when compared with Wistar Kyoto (WKY) normotensive rats. Western blot analysis confirmed lower expression of key proteins including T cell surface glycoprotein CD3 gamma chain (Cd3g) and lymphocyte cytosolic protein 2 (Lcp2). Furthermore, lower expression of cytokines and receptors responsible for lymphocyte proliferation, differentiation, and activation (e.g., Il12r, Il15ra, Il7, Il16, Tgfb1) was observed in the colonic epithelium of the SHR. Finally, Alpi and its product, intestinal alkaline phosphatase, primarily localized in the epithelial cells, were profoundly lower in the SHR. These observations demonstrate that the colonic epithelium undergoes functional changes linked to altered immune, barrier function, and dysbiosis in hypertension.

Keywords: TCR signaling pathway; colonic epithelium; gene expression profile; hypertension.


Conflict of interest statement

No conflicts of interest, financial or otherwise, are declared by the authors.

Figures

Fig. 1.
Fig. 1.
Colonic changes in prehypertensive spontaneously hypertensive rats (SHR). A: comparison of gut microbial diversity and Firmicutes-Bacteroidetes (F/B) ratio between 3 wk old SHR and age-matched Wistar Kyoto (WKY). B: evaluation of inflammation-related markers in the proximal colon of 3 wk old SHR and age-matched WKY. C: evaluation of tight junction protein expression in the proximal colon of 3 wk old SHR and age-matched WKY. Statistical analysis was performed by unpaired t test *P < 0.05. n = 6/group.
Fig. 2.
Fig. 2.
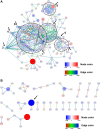
Altered, primarily suppressed, gene expression in the colonic epithelium of SHR. A: major subnetworks and hub genes, identified by their complex interaction with multiple genes, are indicated by dashed circles and numbered arrows, respectively. Node size represents the fold change of SHR over WKY, while the color blue indicates reduced expression, and red indicates higher expression in the SHR. The edge color expresses how tight the interaction was between the linked nodes, with red indicating loose interaction, blue indicating close interaction. B: minor subnetworks of genes with a significant difference between WKY and SHR. Genes interacting with a limited number of other genes were shown. Node size represents the fold change of SHR over WKY, while the color blue indicates reduced expression, and red indicates higher expression in the SHR. The edge color expresses how tight the interaction was between the linked nodes, with red indicating loose interaction, blue indicating close interaction.
Fig. 3.
Fig. 3.
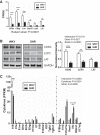
Suppressed expression of genes in the T cell receptor (TCR) signaling pathway in the colonic epithelium of SHR. A: reduced expression of genes in the TCR signaling pathway. FPKM, fragments per kilobase million (n = 4/group). B: suppression of proteins in the TCR signaling pathway (n = 3/group). Quantification data were obtained by measuring the intensity of the Western blot band for indicated proteins. C: differential expression of cytokines between WKY and SHR (n = 4/group). Higher or lower expression of cytokines in the SHR was separated by a dashed line. In all three panels, statistical analysis was performed by two-way ANOVA analysis followed by Sidak’s multiple comparison test *P < 0.05, **P < 0.01, ****P < 0.0001.
Fig. 4.
Fig. 4.
Abundance of αβ+ T cells in the colonic epithelium and mesenteric lymph nodes (MLN) of SHR. A: abundance of colonic αβ+ T cells in the SHR epithelium. Isolated cells from epithelium were stained and analyzed by flow cytometry. B: more TCRαβ+ cells in the SHR MLN. Single cell suspension from MLN was prepared and stained before flow cytometry analysis. TCRαβ+ cells were gated using a total live cell population. Data are presented as percentages of indicated cell populations of total live cells. Statistical analysis was performed by unpaired t test * P < 0.05. n = 4/group.
Fig. 5.
Fig. 5.
Lower Alpi gene expression and intestinal alkaline phosphatase in the colonic epithelium of SHR. A: Alpi transcripts presented as FPKM from RNA-Seq data. B: immunohistochemical staining of in intestinal alkaline phosphatase (IAP) in WKY and SHR colonic epithelium. Statistical analysis was performed by unpaired t test **P < 0.01. n = 4/group.

References

    1. Allen J, Sears CL. Impact of the gut microbiome on the genome and epigenome of colon epithelial cells: contributions to colorectal cancer development. Genome Med 11: 11, 2019. doi:10.1186/s13073-019-0621-2. - DOI - PMC - PubMed
    1. Bolger AM, Lohse M, Usadel B. Trimmomatic: a flexible trimmer for Illumina sequence data. Bioinformatics 30: 2114–2120, 2014. doi:10.1093/bioinformatics/btu170. - DOI - PMC - PubMed
    1. Caillon A, Mian MOR, Fraulob-Aquino JC, Huo KG, Barhoumi T, Ouerd S, Sinnaeve PR, Paradis P, Schiffrin EL. γδ T Cells Mediate Angiotensin II-Induced Hypertension and Vascular Injury. Circulation 135: 2155–2162, 2017. doi:10.1161/CIRCULATIONAHA.116.027058. - DOI - PubMed
    1. Ceponis PJ, Botelho F, Richards CD, McKay DM. Interleukins 4 and 13 increase intestinal epithelial permeability by a phosphatidylinositol 3-kinase pathway. Lack of evidence for STAT 6 involvement. J Biol Chem 275: 29132–29137, 2000. doi:10.1074/jbc.M003516200. - DOI - PubMed
    1. Chakraborty S, Galla S, Cheng X, Yeo JY, Mell B, Singh V, Yeoh B, Saha P, Mathew AV, Vijay-Kumar M, Joe B. Salt-Responsive Metabolite, β-Hydroxybutyrate, Attenuates Hypertension. Cell Reports 25: 677–689.e4, 2018. doi:10.1016/j.celrep.2018.09.058. - DOI - PMC - PubMed

Publication types

MeSH terms