. 2019 Dec 23;20(1):293.
doi: 10.1186/s13059-019-1871-4.

tmap: an integrative framework based on topological data analysis for population-scale microbiome stratification and association studies

Affiliations

tmap: an integrative framework based on topological data analysis for population-scale microbiome stratification and association studies

Tianhua Liao et al. Genome Biol. .

Abstract

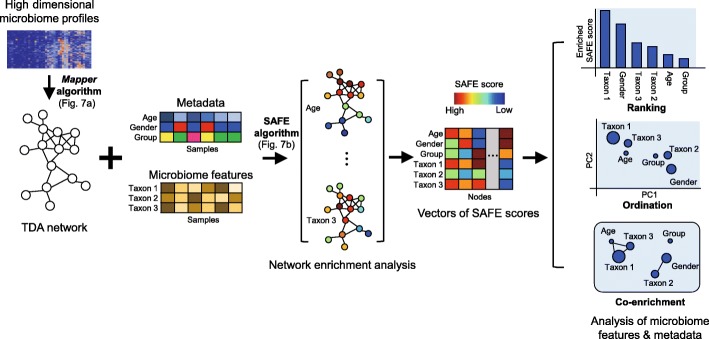
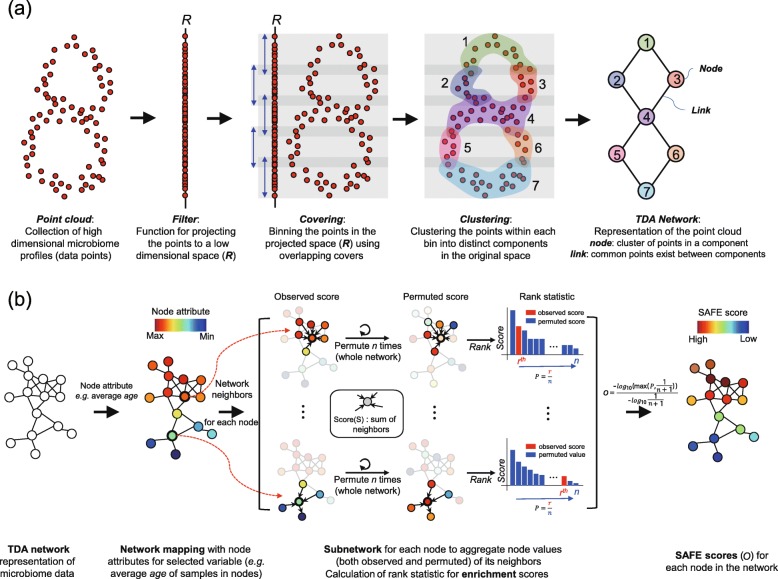
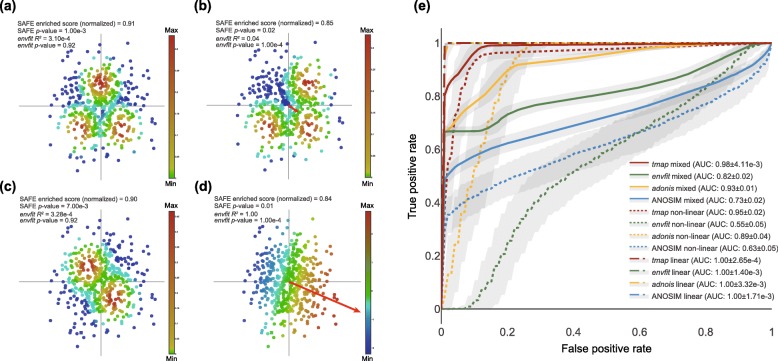
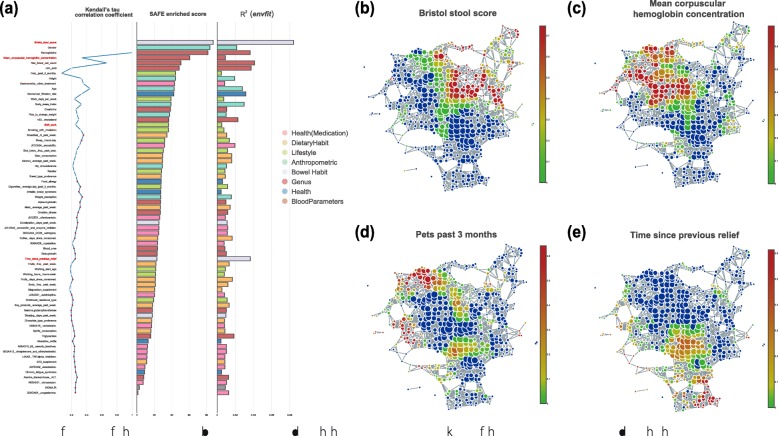
Untangling the complex variations of microbiome associated with large-scale host phenotypes or environment types challenges the currently available analytic methods. Here, we present tmap, an integrative framework based on topological data analysis for population-scale microbiome stratification and association studies. The performance of tmap in detecting nonlinear patterns is validated by different scenarios of simulation, which clearly demonstrate its superiority over the most commonly used methods. Application of tmap to several population-scale microbiomes extensively demonstrates its strength in revealing microbiome-associated host or environmental features and in understanding the systematic interrelations among their association patterns. tmap is available at https://github.com/GPZ-Bioinfo/tmap.

Keywords: Enterotype analysis; Microbiome stratification; Microbiome-wide association analysis; Nonlinear association; Population-scale microbiome; Topological data analysis.


Conflict of interest statement

The authors declare that they have no competing interests.

Figures

Fig. 1
Fig. 1
Overview of tmap workflow for integrative microbiome data analysis. The workflow transforms high-dimensional microbiome profiles into a compressive topological network representation for microbiome stratification and association analysis. The first step uses the Mapper algorithm (Fig. 2a, see the “Methods” section for details) to construct a TDA network from high-dimensional microbiome profiles. The second step uses the SAFE algorithm (Fig. 2b, see the “Methods” section for details) to map the values of metadata or microbiome features to the network to generate their vectors of SAFE scores. The last step performs ranking, ordination, and co-enrichment analysis to characterize interrelations among metadata or microbiome features based on their SAFE scores
Fig. 2
Fig. 2
Schematic illustration of the Mapper and SAFE algorithms used by tmap. a The Mapper algorithm comprises five steps. First, data points of high-dimensional microbiome profiles (such as OTU table) are taken as input. Then, projection of the high-dimensional data points to a low-dimensional space (R as shown in the figure) is performed by using a filter function (such as PC1 of PCoA). The covering step partitions the low-dimensional space into overlapping covers to bin a subset of data points within them. After that, clustering is conducted to cluster data points within each cover into different clusters based on their distances in the original high-dimensional space. The last step constructs a TDA network from the result of clustering analysis, in which node represents a cluster of data points and link between nodes indicates common data points between clusters. b The SAFE algorithm comprises three steps. Starting with a TDA network, it maps the values of metadata or microbiome features into the network as node attributes (e.g., average age). Second, subnetwork enrichment analysis is performed for each node to analyze its significance of the observed enrichment pattern via network permutations. This analysis is performed for each target variable (metadata or microbiome features) respectively. The last step is the calculation of SAFE score (O) via log transformation and normalization of the significance level of the observed enrichment. More details of these two algorithms are provided in the “Methods” section
Fig. 3
Fig. 3
Performance of tmap in detecting linear and nonlinear patterns of simulated microbiome associations. Four scenarios of associations between metadata and synthetic microbiome (generated with SparseDOSSA [37]) are simulated. a–d Gaussian mixture with three symmetric centers; Gaussian mixture with three asymmetric centers; Gaussian mixture with two symmetric centers; linear association. Simulation of nonlinear associations is based on mapping the Gaussian mixtures to the first two PCs of the PCoA (principal coordinates analysis) of synthetic microbiome. Linear associations between metadata and synthetic microbiome are simulated based on linear function of the first two PCs. Arrow indicates a linear projection of the values of simulated metadata (scaled by R-squared using envfit). Significance levels and effect sizes of envfit (p value and R2) and tmap (p value and SAFE enriched score) are depicted. SAFE enriched scores are normalized (divided by the sum of SAFE scores). Color legend (from blue to red) indicates values of metadata (from small to large). e Receiver operating characteristic (ROC) curves of the performance of tmap (red) and envfit (green), adonis (yellow), and ANOSIM (blue) in detecting microbiome-associated metadata. Three scenarios of association are examined, including linear-only (dash-dot line), nonlinear-only (dotted line), and a mix (solid line) of both. The shaded areas indicate 95% confidence intervals (100 repeats). Performance is measured by ROC AUC (mean ± sd) for each method and simulation
Fig. 4
Fig. 4
Stratification of the FGFP microbiomes associated with host covariates. a Ranking of host covariates associated with the FGFP microbiomes. The ranking is compared between tmap (middle panel, according to SAFE enriched score) and envfit (right panel, according to squared correlation coefficient). In the left panel, covariates that are statistically consistent between the two rankings are colored blue (Kendall’s tau, cutoff p value = 0.05). In the middle panel, covariates are colored based on metadata category. be TDA network enrichment patterns (SAFE scores) of the covariates of Bristol stool score, mean corpuscular hemoglobin concentration, pets past 3 months, and time since previous relief, respectively. Node color is based on SAFE scores of corresponding covariates, from red (large values) to blue (small values). The scale of enrichment of mean corpuscular hemoglobin concentration appears to be comparable to that of Bristol stool score, and both are ranked among the top five covariates. Nonlinear patterns of multiple local enrichments are observed for pets past 3 months and time since previous relief, which are ranked differently between tmap and envfit
Fig. 5
Fig. 5
Systematic analysis of interrelations between taxa and host covariates of the FGFP microbiomes. a PCA (principal component analysis) of the SAFE scores of taxa and host covariates shows the overall pattern of their associations with microbiome. The top 10 covariates and taxa identified by SAFE enriched scores are highlighted (markers with edge color of gray) and annotated with their names. Host covariates are colored based on metadata category, and taxa are in red. Marker size is scaled according to the SAFE enriched score of metadata or taxa. b, c Co-enrichment networks of gender and other co-enriched host covariates and taxa, for female and male respectively. The networks reveal the interrelations between gender and other covariates or taxa when considering their associations with the FGFP microbiomes. Edge width of the network is scaled according to the negative log-transformed p value of Fisher’s exact test of co-enrichment. Color and size of the nodes are the same as that of PCA plot. d Co-enrichments between disease and medication. For instance, ulcerative colitis is co-enriched with six different drugs. On the other hand, amoxicillin and enzyme inhibitor (J01CR02) is co-enriched with three different diseases. Colors are based on their co-enrichment subnetworks. e Subnetworks of disease-medication co-enrichments. The identified co-enrichments are highlighted in the TDA network of the FGFP microbiomes with different colors. Co-enrichment relations of a same color indicates that they are co-enriched in a same subnetwork
Fig. 6
Fig. 6
In-depth analysis of enterotype-like stratification of the AGP microbiomes and association with lifestyles. a Stratification of the AGP microbiomes based on enriched taxa. For each node in the TDA network, the most enriched taxon among all taxa is identified according to SAFE enriched score. Each node is colored according to its most enriched taxon. Only taxa enriched in more than 100 nodes are highlighted. Remaining unstratified nodes (with no enriched taxa) are colored in gray. b Stratification based on traditional enterotype analysis. Nodes are colored according to enterotype driver taxa. c Stratification based on countries (USA or UK). Not enriched (or unstratified) nodes are colored in gray. The number in the color legend indicates the number of nodes in the corresponding stratification. d–f Co-enrichment networks of lifestyle factors and taxa. Co-enrichments with countries (USA or UK) are highlighted and extracted. The extracted co-enrichment subnetworks reveal that different lifestyle factors are interrelated to the two countries when accounting for the AGP microbiomes. Node colors are based on metadata category. Node size and edge width are the same as that of Fig. 5
Fig. 7
Fig. 7
Systematic characterization of the multiscale pattern of environment types associated with the Earth’s microbiomes. a Ranking of EMPO, ENVO, and other metadata based on SAFE enriched score. Metadata is colored based on their categories. The relative order of EMPO classes among the ranking is highlighted by surrounded rectangles in gray. b PCA of SAFE scores of EMP metadata and taxa. The top 10 metadata identified by tmap are highlighted (markers with edge color of gray) and annotated with their names. Marker size is scaled according to SAFE enriched score. Colors of metadata are the same as that in the ranking, and taxa are in red. c Co-enrichment network of EMPO classes. Node colors are based on EMPO classes. Edge width of the network is the same as that of Fig. 5. Interconnections among the nodes in the network reflect the hierarchy of EMPO levels. Child classes of higher levels are connected to their parent classes of lower levels and are interconnected to each other. d Co-enrichment network of host metadata (host scientific name). Classification of the hosts are curated manually and colored accordingly. The co-enrichment network indicates that hosts of the same class appear to be more co-enriched when accounting for their association with the Earth’s microbiomes

References

    1. Gilbert JA, Quinn RA, Debelius J, Xu ZZ, Morton J, Garg N, Jansson JK, Dorrestein PC, Knight R. Microbiome-wide association studies link dynamic microbial consortia to disease. Nature. 2016;535:94–103. doi: 10.1038/nature18850. - DOI - PubMed
    1. Wang J, Jia H. Metagenome-wide association studies: fine-mining the microbiome. Nat Rev Microbiol. 2016;14:508–522. doi: 10.1038/nrmicro.2016.83. - DOI - PubMed
    1. Gilbert JA, Blaser MJ, Caporaso JG, Jansson JK, Lynch SV, Knight R. Current understanding of the human microbiome. Nat Med. 2018;24:392–400. doi: 10.1038/nm.4517. - DOI - PMC - PubMed
    1. Gilbert JA, Jansson JK, Knight R. Earth Microbiome Project and Global Systems Biology. mSystems. 2018;3:e00217–17. - PMC - PubMed
    1. Thompson LR, Sanders JG, McDonald D, Amir A, Ladau J, Locey KJ, Prill RJ, Tripathi A, Gibbons SM, Ackermann G, et al. A communal catalogue reveals Earth’s multiscale microbial diversity. Nature. 2017;551:457–463. doi: 10.1038/nature24621. - DOI - PMC - PubMed

Publication types

LinkOut - more resources