

Development and validation of a machine learning, smartphone-based tonometer
- PMID: 31871048
- PMCID: PMC7397723
- DOI: 10.1136/bjophthalmol-2019-315446
Development and validation of a machine learning, smartphone-based tonometer
Abstract
Background/aims: To compare intraocular pressure (IOP) measurements using a prototype smartphone tonometer with other tonometers used in clinical practice.
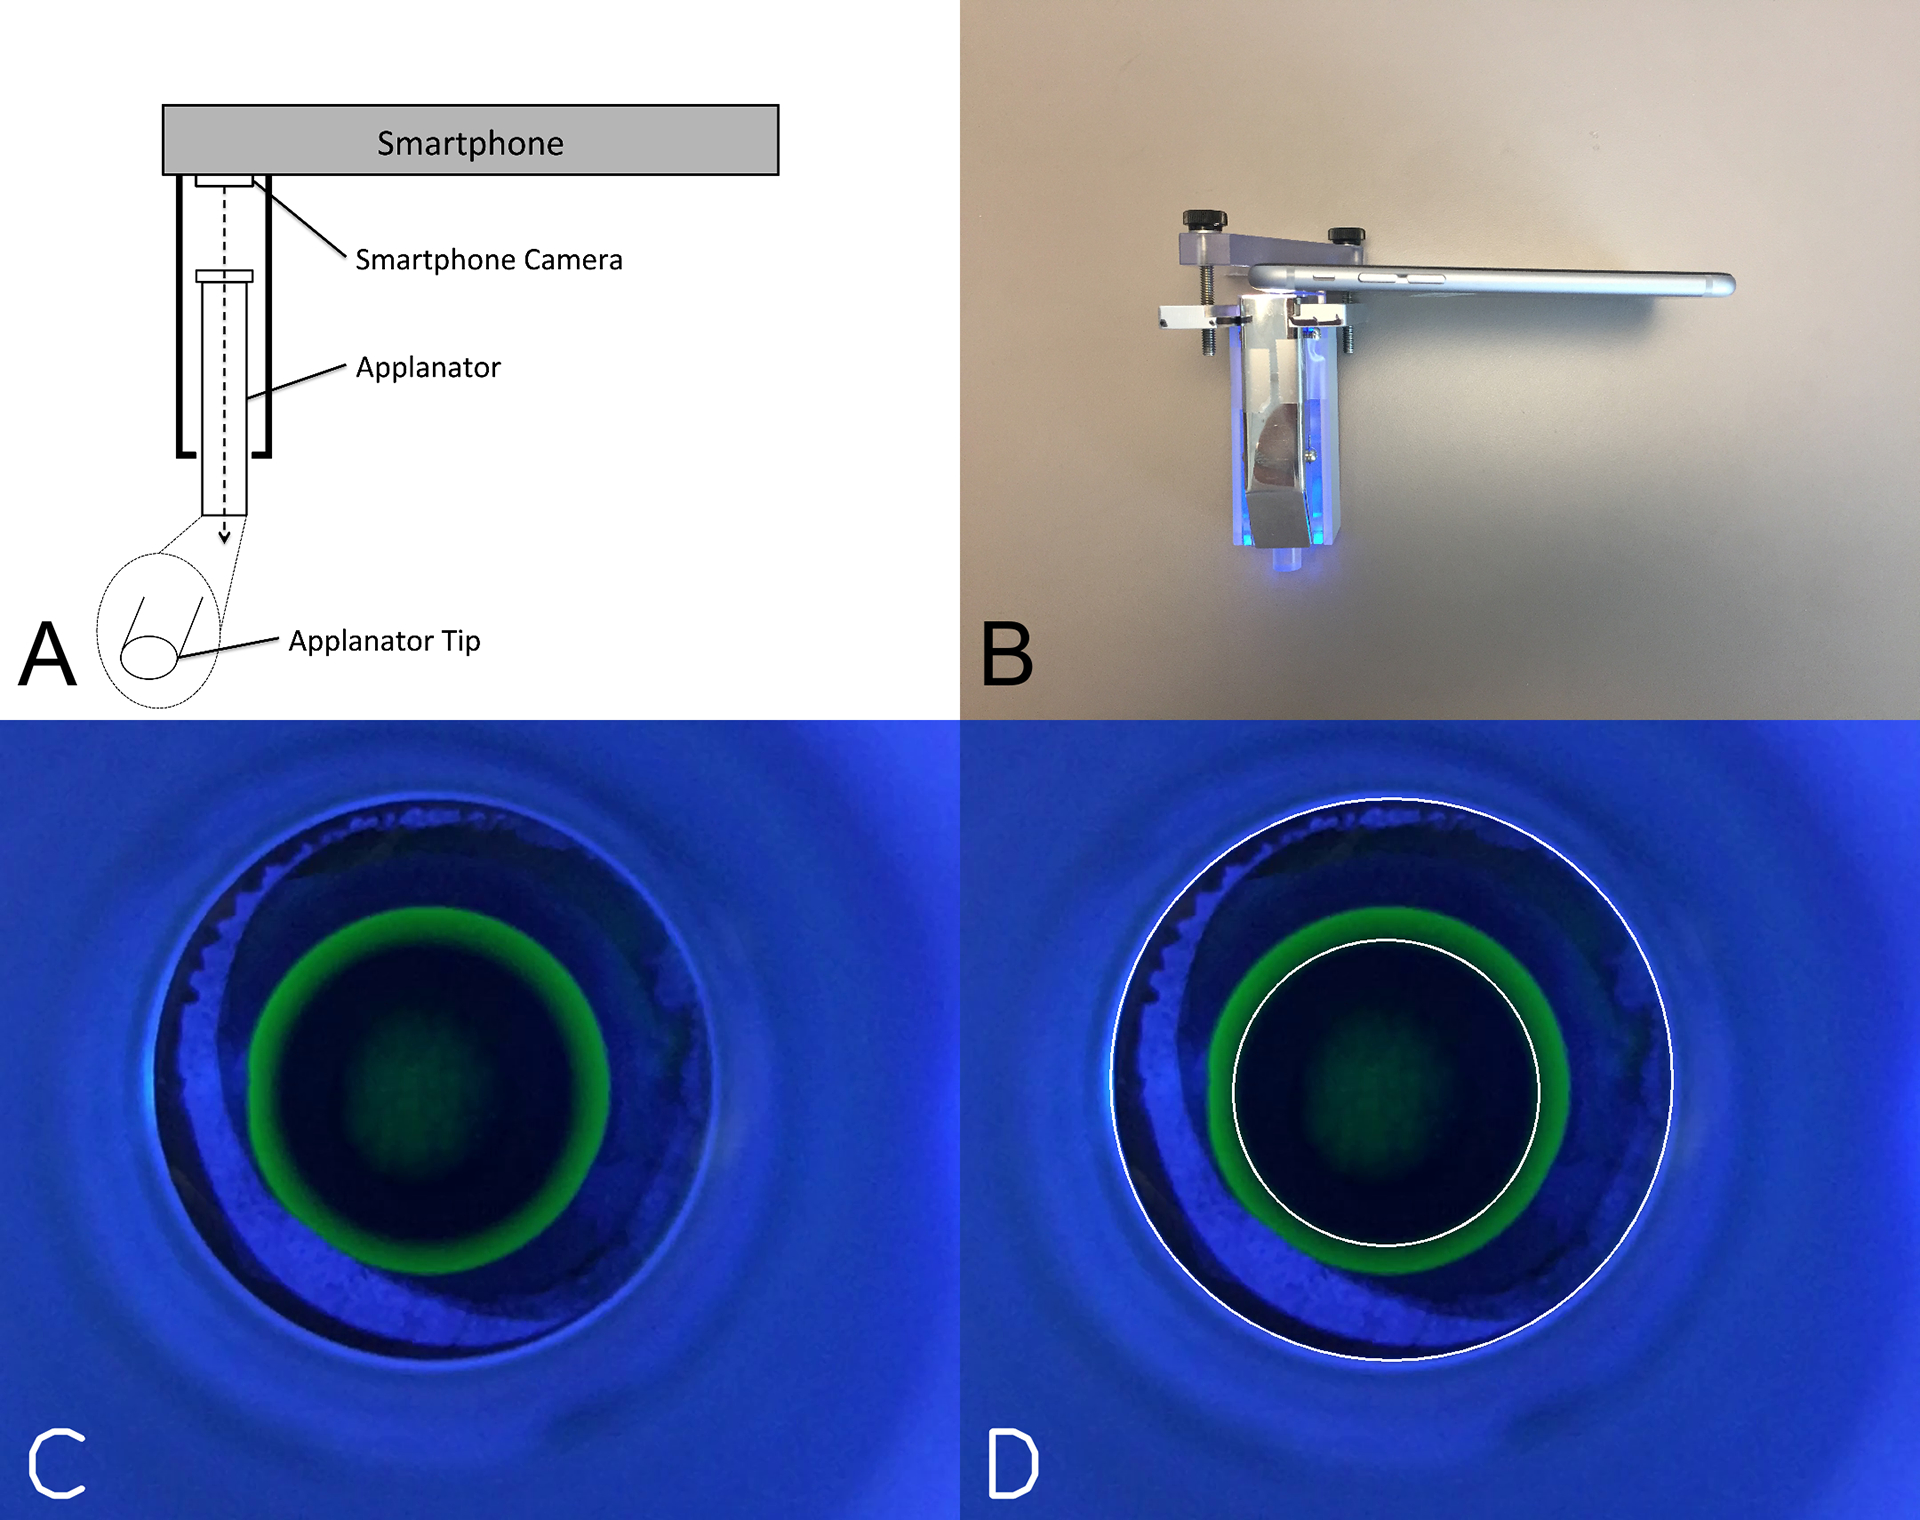
Methods: Patients from an academic glaucoma practice were recruited. The smartphone tonometer uses fixed force applanation and in conjunction with a machine-learning computer algorithm is able to calculate the IOP. IOP was also measured using Goldmann applanation tonometry (GAT) in all subjects. A subset of patients were also measured using ICare, pneumotonometry (upright and supine positions) and Tono-Pen (upright and supine positions) and the results were compared.
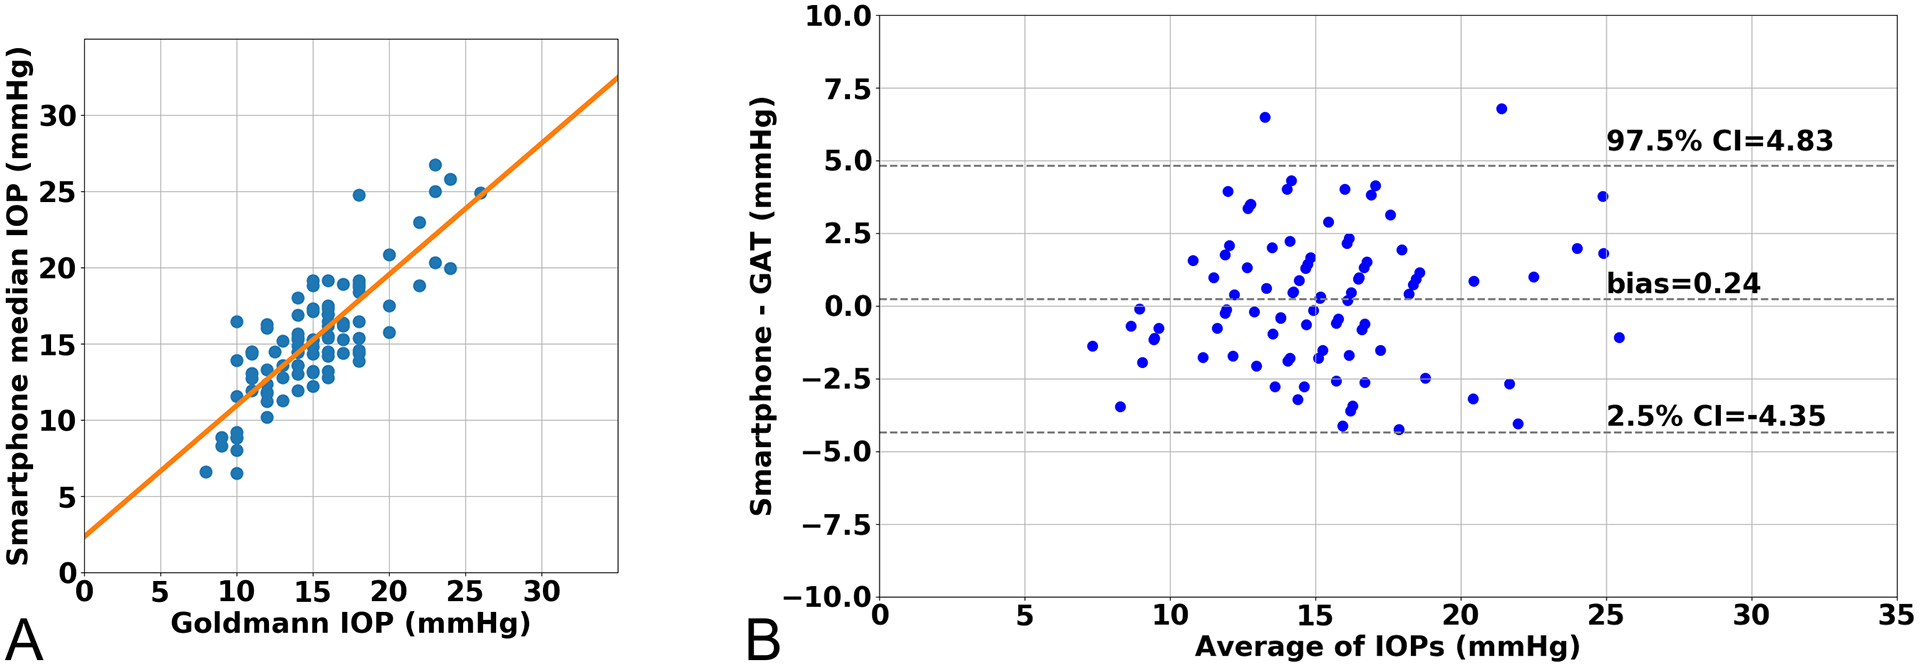
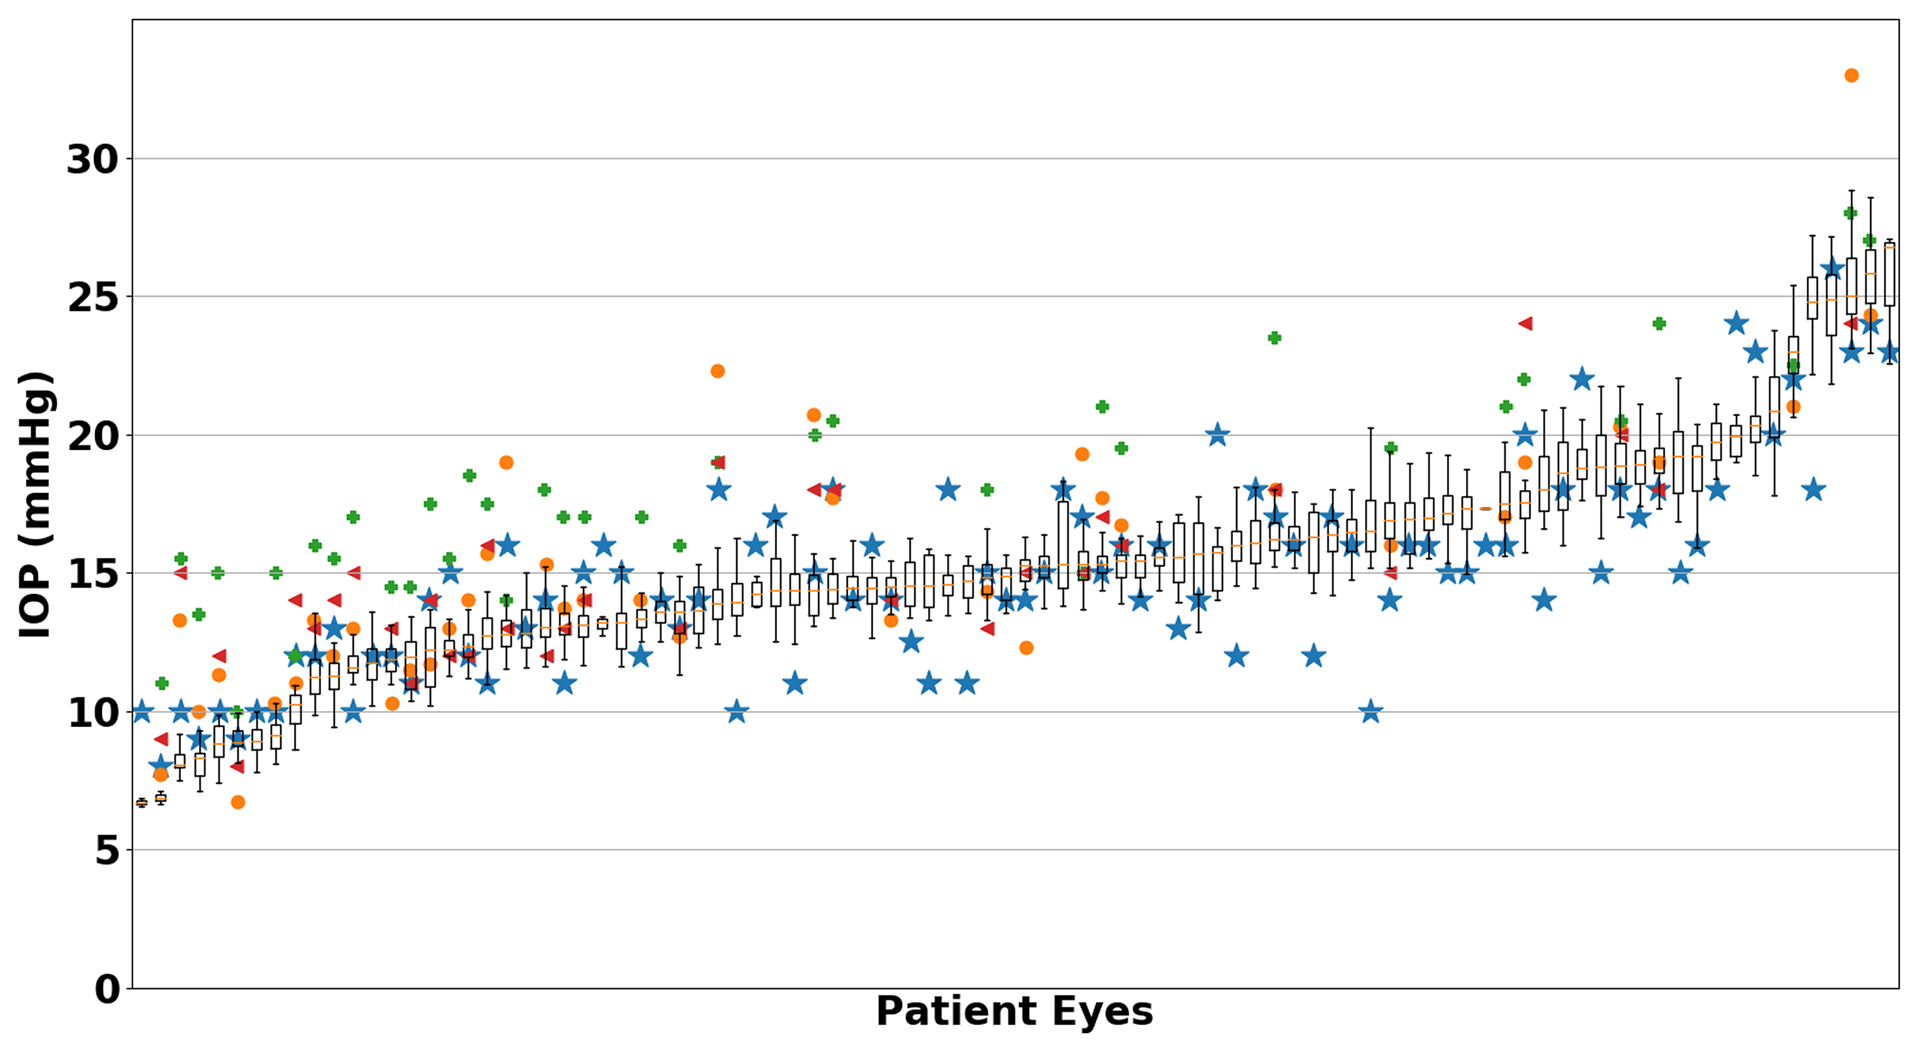
Results: 92 eyes of 81 subjects were successfully measured. The mean difference (in mm Hg) for IOP measurements of the smartphone tonometer versus other devices was +0.24 mm Hg for GAT, -1.39 mm Hg for ICare, -3.71 mm Hg for pneumotonometry and -1.30 mm Hg for Tono-Pen. The 95% limits of agreement for the smartphone tonometer versus other devices was -4.35 to 4.83 mm Hg for GAT, -6.48 to 3.70 mm Hg for ICare, -7.66 to -0.15 mm Hg for pneumotonometry and -5.72 to 3.12 mm Hg for Tono-Pen. Overall, the smartphone tonometer results correlated best with GAT (R2=0.67, p<0.001). Of the 92 videos, 90 (97.8%) were within ±5 mm Hg of GAT and 58 (63.0%) were within ±2 mm Hg of GAT.
Conclusions: Preliminary IOP measurements using a prototype smartphone-based tonometer was grossly equivalent to the reference standard.
Keywords: intraocular pressure.
© Author(s) (or their employer(s)) 2019. No commercial re-use. See rights and permissions. Published by BMJ.
Conflict of interest statement
Competing interests: AYL has received grant support from Novartis and Carl Zeiss Meditec. AYL has received honoraria from Topcon and Verana Health. JCW has a patent pending US20170215728A1. None of the other authors have any competing interests related to this study.
Figures
References
-
- Resnikoff S, Felch W, Gauthier T-M, Spivey B. The number of ophthalmologists in practice and training worldwide: a growing gap despite more than 200,000 practitioners. Br J Ophthalmol 2012;96:783–787. - PubMed
-
- Pathipati AS, Wood EH, Lam CK, et al. Visual acuity measured with a smartphone app is more accurate than Snellen testing by emergency department providers. Graefes Arch Clin Exp Ophthalmol 2016;254:1175–1180. - PubMed
Publication types
MeSH terms
Grants and funding
LinkOut - more resources
Full Text Sources
Other Literature Sources