. 2020 Feb 21;64(3):e02103-19.
doi: 10.1128/AAC.02103-19. Print 2020 Feb 21.

Clinical Mutations That Partially Activate the Stringent Response Confer Multidrug Tolerance in Staphylococcus aureus

Affiliations

Clinical Mutations That Partially Activate the Stringent Response Confer Multidrug Tolerance in Staphylococcus aureus

Duncan Bryson et al. Antimicrob Agents Chemother. .

Abstract

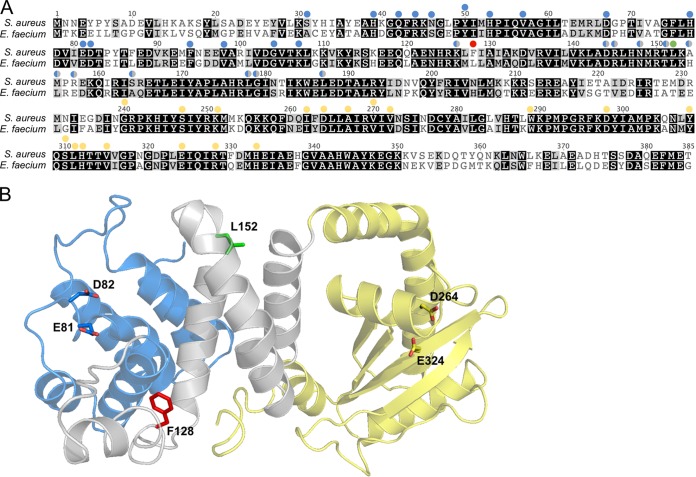
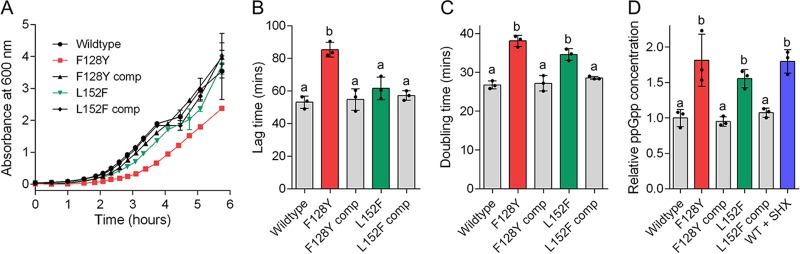
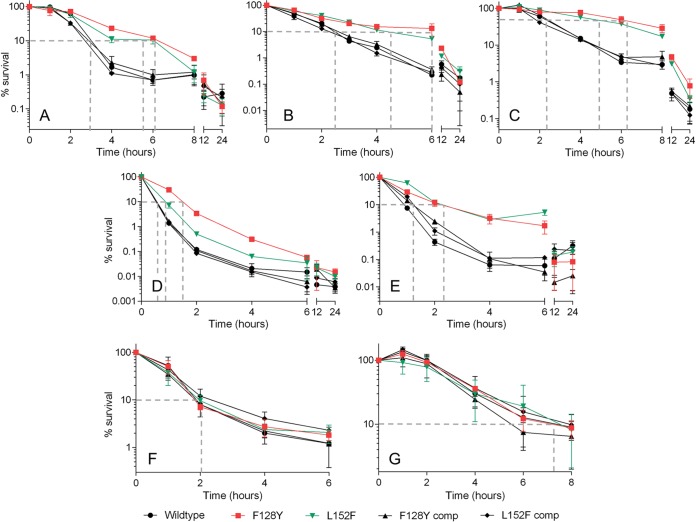
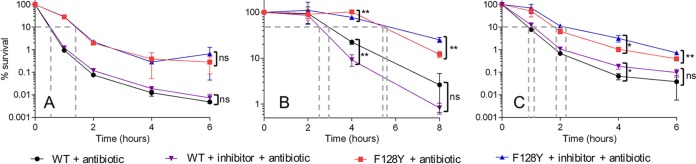
Antibiotic tolerance is an underappreciated antibiotic escape strategy that is associated with recurrent and relapsing infections, as well as acting as a precursor to resistance. Tolerance describes the ability of a bacterial population to survive transient exposure to an otherwise lethal concentration of antibiotic without exhibiting an elevated MIC. It is detected in time-kill assays as a lower rate of killing than a susceptible strain and can be quantified by the metric minimum duration for killing (MDK). The molecular mechanisms behind tolerance are varied, but activation of the stringent response (SR) via gene knockouts and/or chemical induction has long been associated with tolerance. More recently, two Gram-positive clinical isolates from persistent bacteremias were found to bear mutations in the SR controller, Rel, that caused elevated levels of the alarmone (p)ppGpp. Here, we show that introduction of either of these mutations into Staphylococcus aureus confers tolerance to five different classes of antibiotic as a result of (p)ppGpp-mediated growth defects (longer lag time and/or lower growth rate). The degree of tolerance is related to the severity of the growth defect and ranges from a 1.5- to 3.1-fold increase in MDK. Two classes of proposed SR inhibitor were unable to reverse or reduce this tolerance. Our findings reveal the significance of SR-activating mutations in terms of tolerance and clinical treatment failures. The panel of strains reported here provide a clinically relevant model of tolerance for further investigation of its link to resistance development, as well as potential validation of high-throughput tolerance screens.

Keywords: Staphylococcus aureus; antibiotic tolerance; minimum duration for killing; stringent response; time-kill curves.


Figures

FIG 1
FIG 1
Location of clinical Rel mutations. (A) Alignment of the N-terminal catalytic region of Rel from S. aureus Newman and E. faecium VRE001. Shading indicates the degree of amino acid conservation (black = conserved, gray = conservative substitution, white = not conserved). Colored circles above residues indicate sites that have been experimentally mutated in Rel from Streptococcus dysgalactiae and found to affect either hydrolase (blue) or synthetase (yellow) function. Sites indicated by blue/gray circles are located outside the core hydrolase domain, but their mutation still impacts hydrolase function. The red and green circles indicate the sites of the two clinical Rel mutations, F128 and L152, respectively. (B) Cartoon representation of the Rel catalytic region from S. dysgalactiae (PDB code 1VJ7) with the S. aureus Rel sequence threaded onto it (using Phyre2). The different domains are colored blue (hydrolase), yellow (synthetase), and gray (central three-helix bundle and linker regions). The sites of the clinical Rel mutations and catalytic residues (36) are shown as sticks and colored as in panel A.
FIG 2
FIG 2
Confirmation of partial stringent response activation in S. aureus by clinical Rel mutations. (A) Growth curves of wild-type Newman, mutant, and complemented strains in TSB. (B and C) Lag times (B) and doubling times (C) derived from the growth curves in panel A. (D) Intracellular ppGpp concentrations shown relative to the wild type. A sample of wild-type cells were exposed to serine hydroxamate (SHX) as a positive control of stringent response induction. In all panels, data shown are the means of three replicates; in panels B to D, bars represent the means of the individual data points shown. In all panels, error bars, where visible, represent the standard deviations (SD). Letters above bars indicate statistically significant differences between means, as determined by one-way analysis of variance (ANOVA) with Tukey’s multiple-comparison test. comp, complemented.
FIG 3
FIG 3
Clinical Rel mutations confer tolerance to antibiotics with diverse modes of action. Wild-type Newman, mutant, and complemented strains were exposed to flucloxacillin (A), vancomycin (B), cefazolin (C), ciprofloxacin (D), daptomycin (E), rifampin (F), and trimethoprim-sulfamethoxazole (G) at 4× the MIC (8× the MIC for trimethoprim-sulfamethoxazole), and viable counts were determined at intervals. Data shown are the means of three replicates; error bars, where visible, represent the SD. Dashed gray lines indicate the approximate minimum duration for killing (MDK) 90% of the population (50% in panel C) for each strain. MDK values interpolated from the data shown are given in Table 2. Raw data in log10 CFU/ml are shown in Fig. S1 in the supplemental material.
FIG 4
FIG 4
Existing stringent response inhibitors are unable to reverse the tolerance exhibited by a stringent response-activated strain. Wild-type Newman and the F128Y mutant were exposed to either 4× the MIC ciprofloxacin or cefazolin in the presence of different stringent response inhibitors: relacin (1 mM) and ciprofloxacin (A), relacin (2 mM) and cefazolin (B), and DJK-5 (5 μg/ml) and ciprofloxacin (C). Data shown are the means of three replicates; error bars, where visible, represent the SD. Asterisks indicate statistically significant differences between means as determined by an unpaired t test (* and **, P ≤ 0.05 and P ≤ 0.01, respectively; ns, not significant [P > 0.05]). In panel A, no statistically significant differences between with/without inhibitor were detected for either strain at any time point. Dashed gray lines indicate the approximate minimum duration for killing (MDK) 90% of the population (50% in panel B) for each strain. MDK values interpolated from the data shown are given in Table S1 in the supplemental material. Raw data in log10 CFU/ml are shown in Fig. S3.

References

    1. Centers for Disease Control and Prevention. 2013. Antibiotic resistance threats in the United States. Centers for Disease Control and Prevention, Atlanta, GA: https://www.cdc.gov/drugresistance/pdf/ar-threats-2013-508.pdf.
    1. World Health Organization. 2015. Global action plan on antimicrobial resistance. World Health Organization, Geneva, Switzerland: https://www.who.int/antimicrobial-resistance/publications/global-action-....
    1. Brauner A, Fridman O, Gefen O, Balaban NQ. 2016. Distinguishing between resistance, tolerance and persistence to antibiotic treatment. Nat Rev Microbiol 14:320–330. doi:10.1038/nrmicro.2016.34. - DOI - PubMed
    1. Windels EM, Michiels JE, Van den Bergh B, Fauvart M, Michiels J, Windels EM, Michiels JE, Van den Bergh B, Fauvart M, Michiels J. 2019. Antibiotics: combatting tolerance to stop resistance. mBio 10:e02095-19. doi:10.1128/mBio.02095-19. - DOI - PMC - PubMed
    1. Levin BR, Rozen DE. 2006. Non-inherited antibiotic resistance. Nat Rev Microbiol 4:556–562. doi:10.1038/nrmicro1445. - DOI - PubMed

Publication types

MeSH terms

Substances

Grants and funding