

The Impact of Stroma Admixture on Molecular Subtypes and Prognostic Gene Signatures in Serous Ovarian Cancer
- PMID: 31871106
- PMCID: PMC7448721
- DOI: 10.1158/1055-9965.EPI-18-1359
The Impact of Stroma Admixture on Molecular Subtypes and Prognostic Gene Signatures in Serous Ovarian Cancer
Abstract
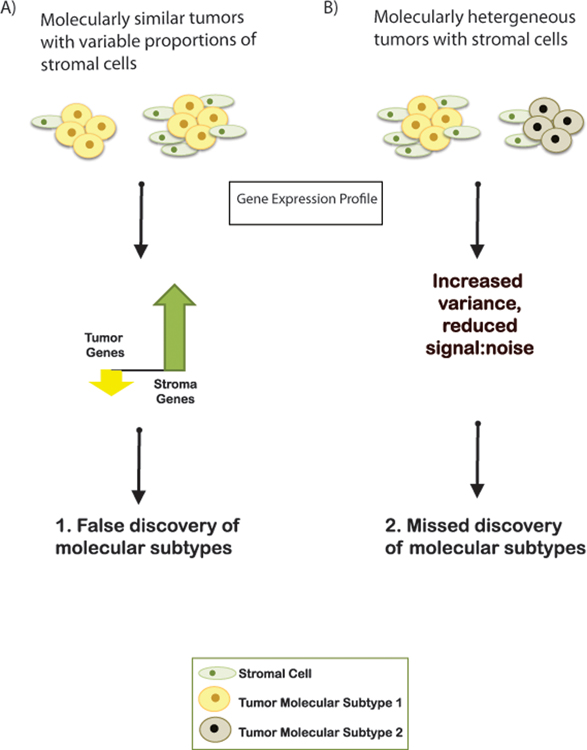
Background: Recent efforts to improve outcomes for high-grade serous ovarian cancer, a leading cause of cancer death in women, have focused on identifying molecular subtypes and prognostic gene signatures, but existing subtypes have poor cross-study robustness. We tested the contribution of cell admixture in published ovarian cancer molecular subtypes and prognostic gene signatures.
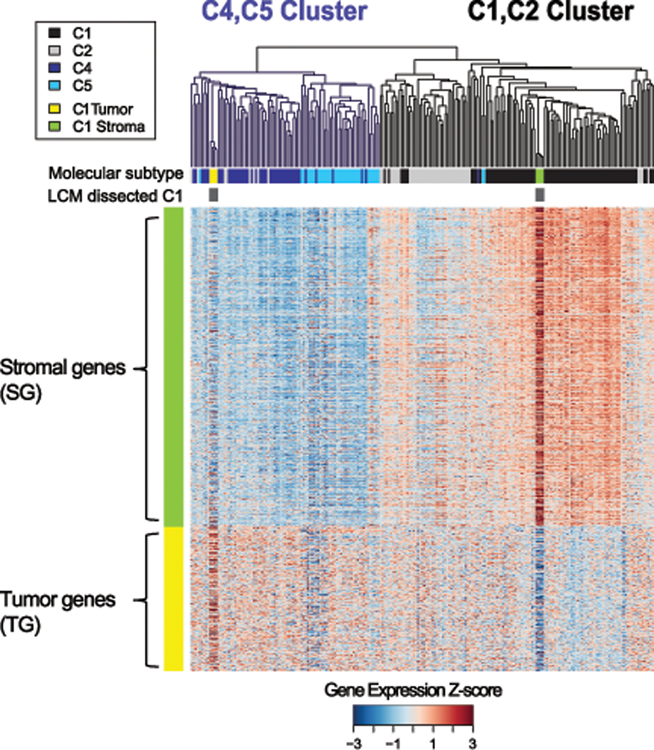
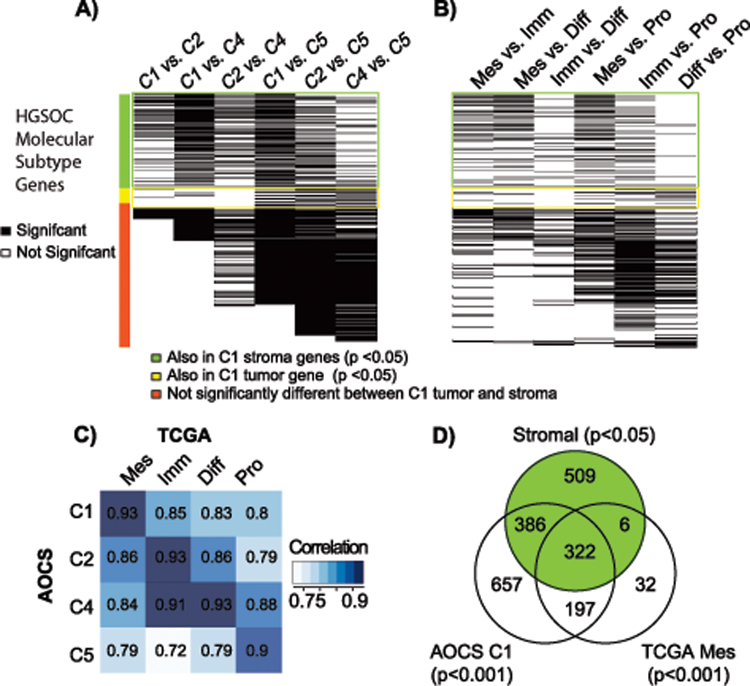
Methods: Gene signatures of tumor and stroma were developed using paired microdissected tissue from two independent studies. Stromal genes were investigated in two molecular subtype classifications and 61 published gene signatures. Prognostic performance of gene signatures of stromal admixture was evaluated in 2,527 ovarian tumors (16 studies). Computational simulations of increasing stromal cell proportion were performed by mixing gene-expression profiles of paired microdissected ovarian tumor and stroma.
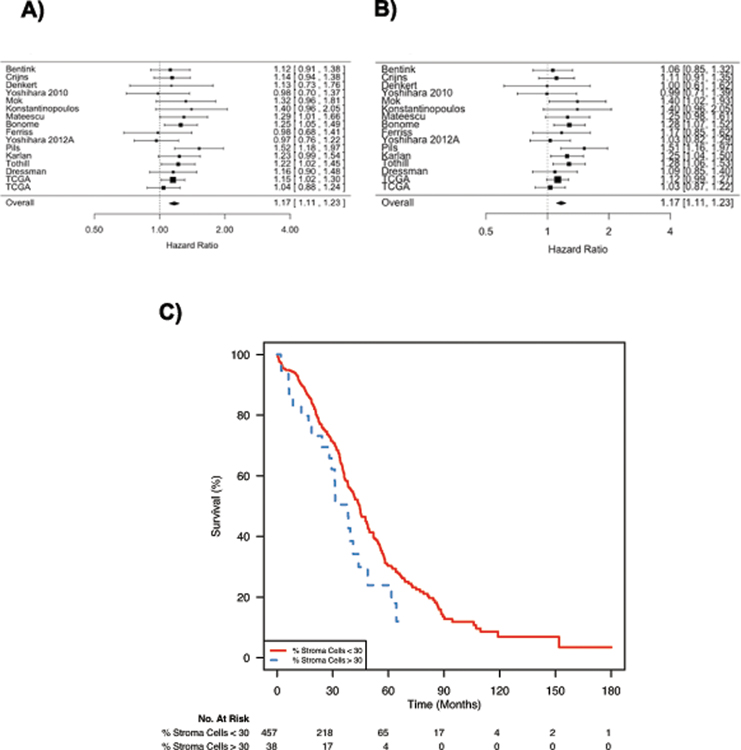
Results: Recently described ovarian cancer molecular subtypes are strongly associated with the cell admixture. Tumors were classified as different molecular subtypes in simulations where the percentage of stromal cells increased. Stromal gene expression in bulk tumors was associated with overall survival (hazard ratio, 1.17; 95% confidence interval, 1.11-1.23), and in one data set, increased stroma was associated with anatomic sampling location. Five published prognostic gene signatures were no longer prognostic in a multivariate model that adjusted for stromal content.
Conclusions: Cell admixture affects the interpretation and reproduction of ovarian cancer molecular subtypes and gene signatures derived from bulk tissue. Elucidating the role of stroma in the tumor microenvironment and in prognosis is important.
Impact: Single-cell analyses may be required to refine the molecular subtypes of high-grade serous ovarian cancer.
©2019 American Association for Cancer Research.
Conflict of interest statement
The authors disclose no potential conflicts of interest.
Figures
Similar articles
-
High-grade serous tubo-ovarian cancer refined with single-cell RNA sequencing: specific cell subtypes influence survival and determine molecular subtype classification.Genome Med. 2021 Jul 9;13(1):111. doi: 10.1186/s13073-021-00922-x. Genome Med. 2021. PMID: 34238352 Free PMC article.
-
Immune profiling reveals prognostic genes in high-grade serous ovarian cancer.Aging (Albany NY). 2020 Jun 16;12(12):11398-11415. doi: 10.18632/aging.103199. Epub 2020 Jun 16. Aging (Albany NY). 2020. PMID: 32544083 Free PMC article.
-
Subtype-specific analysis of gene co-expression networks and immune cell profiling reveals high grade serous ovarian cancer subtype linkage to variable immune microenvironment.J Ovarian Res. 2024 Dec 3;17(1):240. doi: 10.1186/s13048-024-01556-4. J Ovarian Res. 2024. PMID: 39627836 Free PMC article.
-
Multi-omics in high-grade serous ovarian cancer: Biomarkers from genome to the immunome.Am J Reprod Immunol. 2018 Aug;80(2):e12975. doi: 10.1111/aji.12975. Epub 2018 May 21. Am J Reprod Immunol. 2018. PMID: 29781548 Review.
-
Who are the long-term survivors of high grade serous ovarian cancer?Gynecol Oncol. 2018 Jan;148(1):204-212. doi: 10.1016/j.ygyno.2017.10.032. Epub 2017 Nov 8. Gynecol Oncol. 2018. PMID: 29128106 Review.
Cited by
-
Metabolomic Analysis of Histological Composition Variability of High-Grade Serous Ovarian Cancer Using 1H HR MAS NMR Spectroscopy.Int J Mol Sci. 2024 Oct 10;25(20):10903. doi: 10.3390/ijms252010903. Int J Mol Sci. 2024. PMID: 39456684 Free PMC article.
-
The Progression and Prospects of the Gene Expression Profiling in Ovarian Epithelial Cancer.Gynecol Minim Invasive Ther. 2024 Jul 18;13(3):141-145. doi: 10.4103/gmit.gmit_13_23. eCollection 2024 Jul-Sep. Gynecol Minim Invasive Ther. 2024. PMID: 39184260 Free PMC article. Review.
-
Spatial transcriptomics reveals discrete tumour microenvironments and autocrine loops within ovarian cancer subclones.Nat Commun. 2024 Apr 3;15(1):2860. doi: 10.1038/s41467-024-47271-y. Nat Commun. 2024. PMID: 38570491 Free PMC article.
-
Gene expression profile association with poor prognosis in epithelial ovarian cancer patients.Sci Rep. 2021 Mar 8;11(1):5438. doi: 10.1038/s41598-021-84953-9. Sci Rep. 2021. PMID: 33686173 Free PMC article. Clinical Trial.
-
Targeting receptor tyrosine kinases in ovarian cancer: Genomic dysregulation, clinical evaluation of inhibitors, and potential for combinatorial therapies.Mol Ther Oncolytics. 2023 Feb 19;28:293-306. doi: 10.1016/j.omto.2023.02.006. eCollection 2023 Mar 16. Mol Ther Oncolytics. 2023. PMID: 36911068 Free PMC article. Review.
References
-
- Tothill RW, Tinker AV, George J, Brown R, Fox SB, Lade S, et al. Novel molecular subtypes of serous and endometrioid ovarian cancer linked to clinical outcome. Clin Cancer Res Off J Am Assoc Cancer Res. 2008;14:5198–208. - PubMed
-
- Waldron L, Riester M, Birrer M. Molecular subtypes of high-grade serous ovarian cancer: the holy grail? J Natl Cancer Inst. 2014;106. - PubMed
Publication types
MeSH terms
Substances
Grants and funding
LinkOut - more resources
Full Text Sources
Medical
