. 2020 Jan 6;7(1):ENEURO.0391-19.2019.
doi: 10.1523/ENEURO.0391-19.2019. Print 2020 Jan/Feb.

High-Fat Diet-Induced Obesity Causes Sex-Specific Deficits in Adult Hippocampal Neurogenesis in Mice

Affiliations

High-Fat Diet-Induced Obesity Causes Sex-Specific Deficits in Adult Hippocampal Neurogenesis in Mice

Lisa S Robison et al. eNeuro. .

Abstract

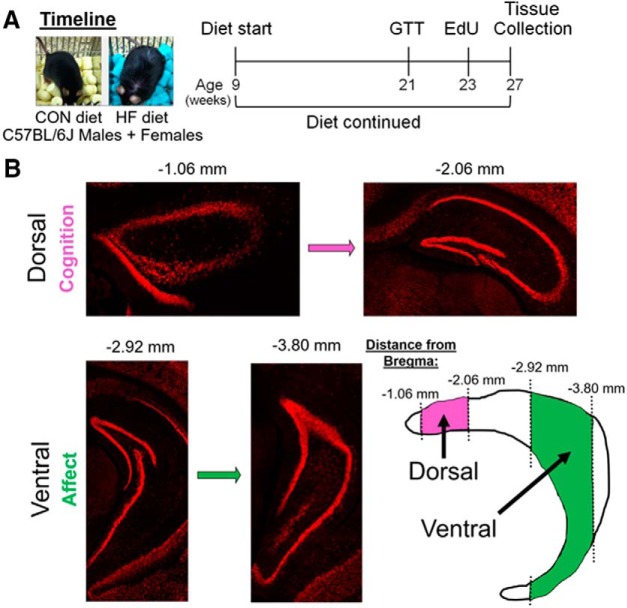
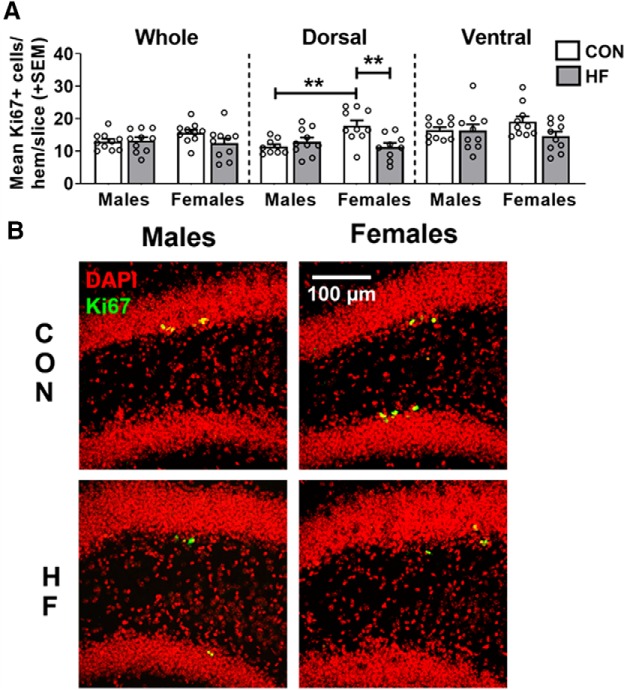
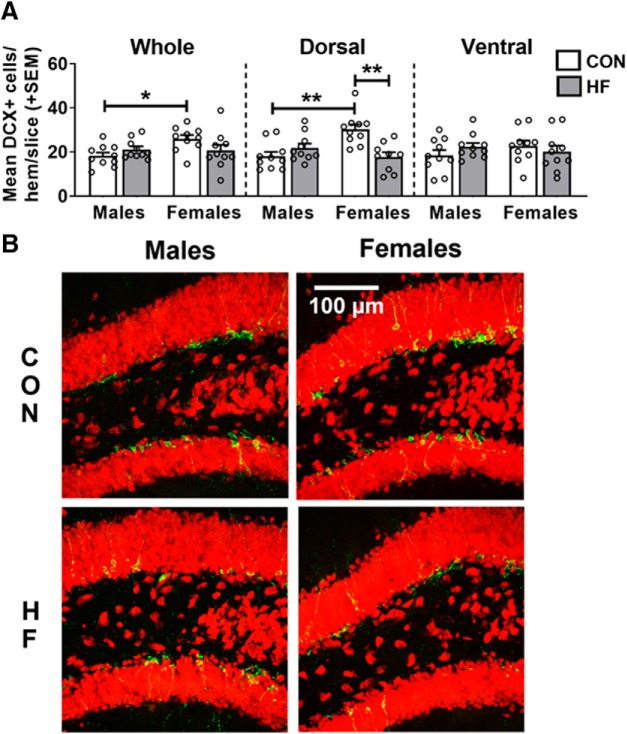
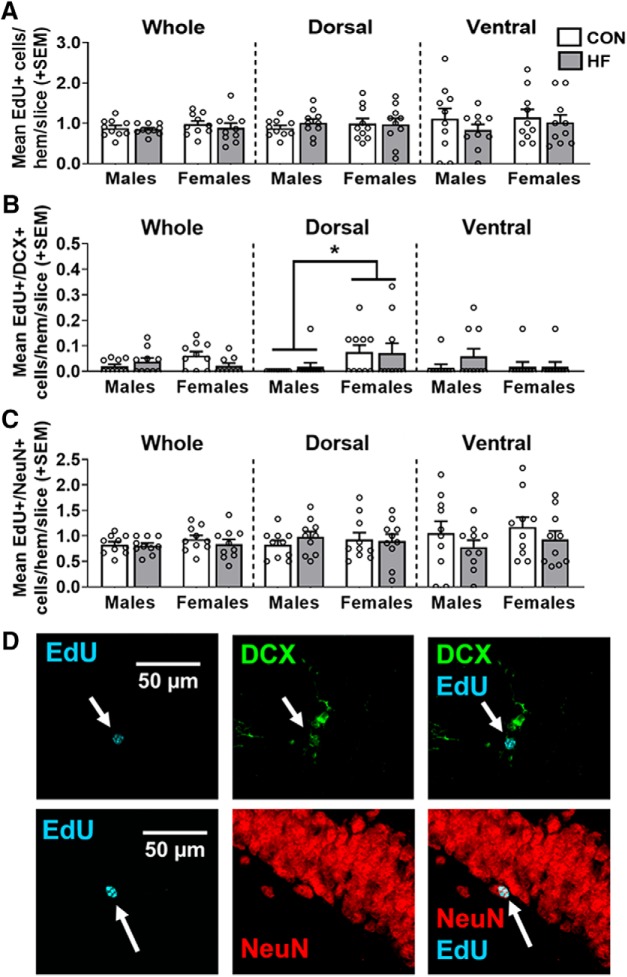
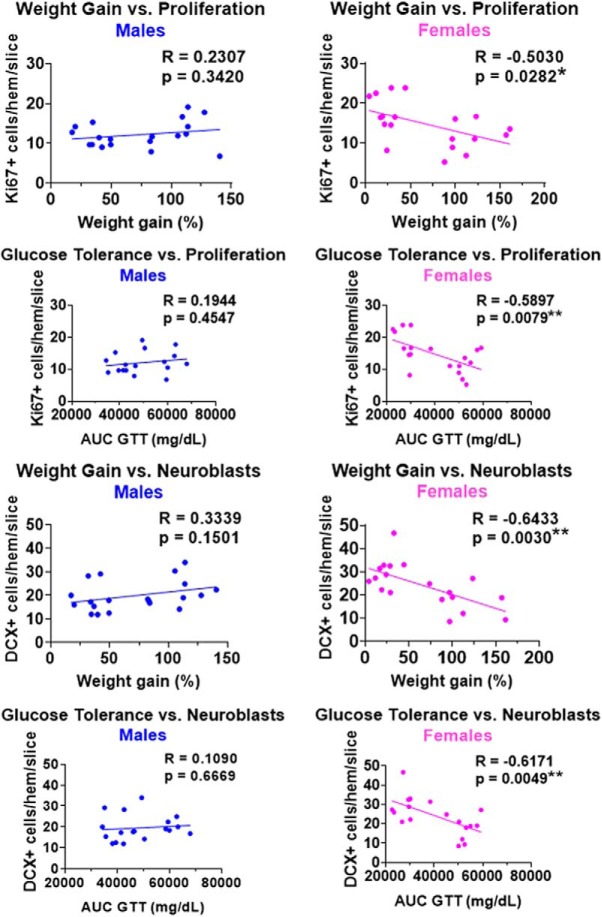
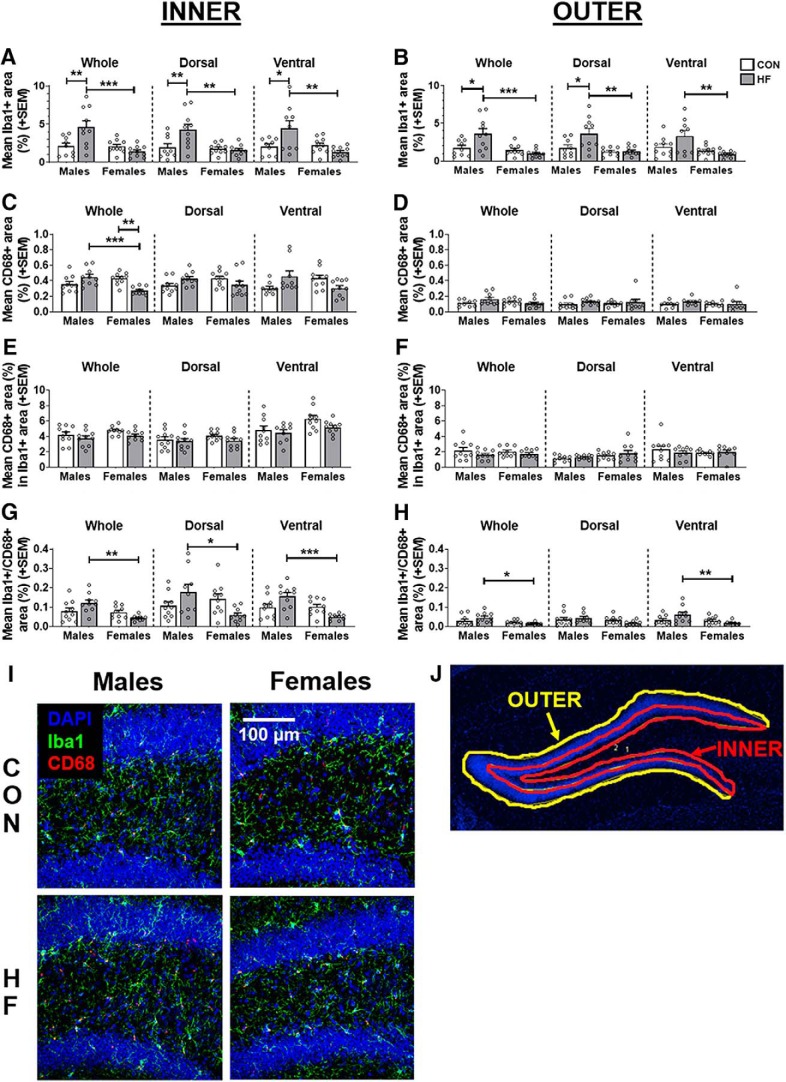
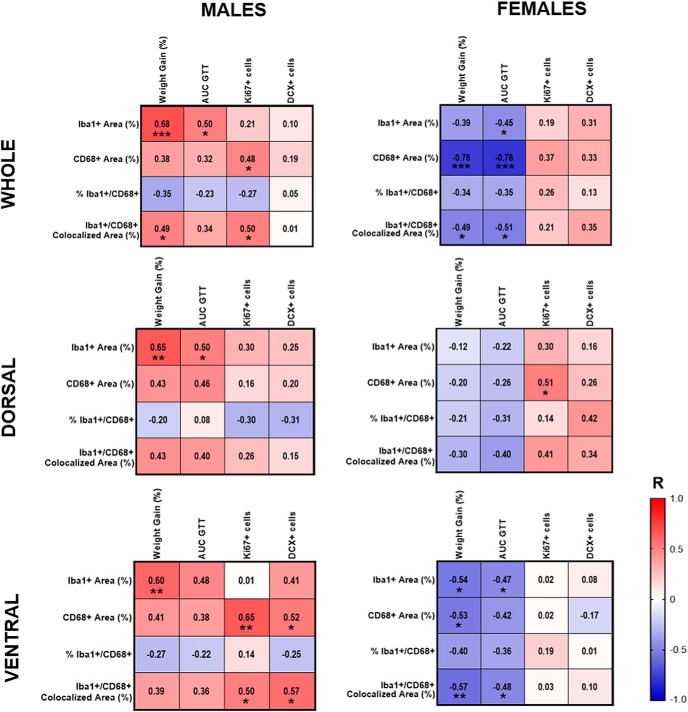
Adult hippocampal neurogenesis (AHN) is suppressed by high-fat (HF) diet and metabolic disease, including obesity and type 2 diabetes. Deficits in AHN may contribute to cognitive decline and increased risk of dementia and mood disorders, which have higher prevalence in women. However, sex differences in the effects of HF diet/metabolic disease on AHN have yet to be thoroughly investigated. Herein, male and female C57BL/6J mice were fed an HF or control (CON) diet from ∼2 to 6 months of age. After 3 months on the diet, mice were injected with 5-ethynyl-2'-deoxyuridine (EdU) then killed 4 weeks later. Cell proliferation, differentiation/maturation, and survival of new neurons in the dentate gyrus were assessed with immunofluorescence for EdU, Ki67, doublecortin (DCX), and NeuN. CON females had more proliferating cells (Ki67+) and neuroblasts/immature neurons (DCX+) compared with CON males; however, HF diet reduced these cells in females to the levels of males. Diet did not affect neurogenesis in males. Further, the numbers of proliferating cells and immature neurons were inversely correlated with both weight gain and glucose intolerance in females only. These effects were robust in the dorsal hippocampus, which supports cognitive processes. Assessment of microglia in the dentate gyrus using immunofluorescence for Iba1 and CD68 uncovered sex-specific effects of diet, which may contribute to observed differences in neurogenesis. These findings demonstrate sex-specific effects of HF diet/metabolic disease on AHN, and highlight the potential for targeting neurogenic deficits to treat cognitive decline and reduce the risk of dementia associated with these conditions, particularly in females.

Keywords: hippocampus; metabolic disorders; microglia; neurogenesis; prediabetes; sex differences.


Figures

Figure 1.
Figure 1.
A, Timeline of the experiment. Male and female C57BL/6J mice were placed on a CON diet (10% fat) or an HF diet (60% fat) at 9 weeks of age, which was continued for the duration of the experiment. After ∼3 months on the diet, mice were subjected to GTT, then injected with EdU (3×) 2 weeks later. Four weeks after EdU injections, tissue collection was performed. B, Breakdown of the hippocampus into dorsal (approximately −1.06 to approximately −2.06 mm from bregma) and ventral (approximately −2.92 to approximately −3.80 mm from bregma) subregions, which regulate cognitive and affective processes, respectively. Adapted from Tanti and Belzung (2013).
Figure 2.
Figure 2.
A, Cell proliferation in the dentate gyrus, as measured by the mean (±SEM) number of Ki67+ cells per hemisphere per 40 μm slice throughout the whole hippocampus, and in the dorsal and ventral subregions. On a control diet, females had a greater number of Ki67+ cells in the dorsal hippocampus compared with males, while HF diet reduced the number of Ki67+ cells in the dorsal hippocampus of females only. N = 10/group. **p < 0.01. B, Representative images of Ki67 (green) and DAPI (red) immunostaining in the dorsal hippocampus. Estimation statistics for all neurogenesis-related measures can be seen in Extended Data Figure 2-1.
Figure 3.
Figure 3.
A, Number of neuroblasts/immature neurons in the dentate gyrus, as measured by the mean (±SEM) number of DCX+ cells per hemisphere per 40 μm slice throughout the whole hippocampus, and in the dorsal and ventral subregions. B, On a CON diet, females had a greater number of DCX+ cells in the dorsal hippocampus compared with males, while an HF diet reduced the number of DCX+ cells in the dorsal hippocampus of females only. N = 10/group. *p < 0.05, **p < 0.01. B, Representative images of DCX (green) and NeuN (red) immunostaining in the dorsal hippocampus.
Figure 4.
Figure 4.
A, Survival of newly born cells in the dentate gyrus, as measured by the mean (±SEM) number of EdU+ cells 28 d post-EdU injection throughout the whole hippocampus and in the dorsal and ventral subregions. There were no group differences in any area measured. B, Newly born cells in the dentate gyrus that differentiated into neuroblasts/immature neurons and survived 28 d post-EdU injection, were measured by the mean (±SEM) number of EdU+/DCX+ cells throughout the whole hippocampus and in the dorsal and ventral subregions. In the dorsal hippocampus, females had a greater number of EdU+/DCX+ cells compared with males, regardless of diet. C, Newly born cells in the dentate gyrus that differentiated into mature neurons and survived 28 d post-EdU injection, were measured by the mean (±SEM) number of EdU+/NeuN+ cells throughout the whole hippocampus and in dorsal and ventral subregions. There were no group differences in any area measured. N = 10/group. *p < 0.05 main effect of sex. D, Representative images of EdU (cyan) alone and colocalized with DCX (green) and NeuN (red).
Figure 5.
Figure 5.
Correlations between metabolic outcomes [weight gain and glucose tolerance (AUC during GTT)] and neurogenesis measures [Ki67+ cells (proliferating cells) and DCX+ cells (neuroblasts/immature neurons)] in the dorsal hippocampus of males (left) and females (right). Mice on both control and high-fat diet are included in these plots. Note the significant inverse associations between metabolic outcomes and neurogenesis in females, but not males. N = 20/sex. *p < 0.05, **p < 0.01.
Figure 6.
Figure 6.
A, B, Microglia density in the inner (A) and outer (B) dentate, as measured by the mean (±SEM) percentage area covered by Iba1+ stain throughout the whole hippocampus and in the dorsal and ventral subregions. C, D, Phagocytic activity in the inner (C) and outer (D) dentate, as measured by the mean (±SEM) percentage area covered by CD68+ stain throughout the whole hippocampus and in the dorsal and ventral subregions. E, F, Relative degree of microglial phagocytic activity in the inner (E) and outer (F) dentate, as measured by the mean (±SEM) percentage of Iba1+ area also positive for CD68 throughout the whole hippocampus and in the dorsal and ventral subregions. G, H, Absolute microglial phagocytic activity in the inner (G) and outer (H) dentate, as measured by the mean (±SEM) percentage area positive for colocalized Iba1 and CD68 throughout the whole hippocampus, and in the dorsal and ventral subregions. N = 10/group. *p < 0.05, **p < 0.01, ***p < 0.001. I, Representative images of Iba1+ (green) and CD68+ (red) cells in the dorsal dentate gyrus. DAPI (blue) counterstaining was used to visualize nuclei, determine position relative to bregma, and create ROIs around the dentate gyrus. J, Representative image of inner and outer ROIs of the dentate gyrus. See Figure 6-1 for estimation statistics performed for microglia-related measures.
Figure 7.
Figure 7.
Correlations of microglia measures in the inner dentate with metabolic outcomes and neurogenesis in the whole hippocampus, and in dorsal and ventral subregions of male (left) and female (right) mice. Red indicates positive correlations, and blue indicates negative correlations, with intensity of the color indicative of the strength of the association. *p < 0.05, **p < 0.01.

Similar articles

Cited by

References

    1. Aarum J, Sandberg K, Haeberlein SL, Persson MA (2003) Migration and differentiation of neural precursor cells can be directed by microglia. Proc Natl Acad Sci U S A 100:15983–15988. 10.1073/pnas.2237050100 - DOI - PMC - PubMed
    1. Amrein I, Slomianka L, Poletaeva II, Bologova NV, Lipp HP (2004) Marked species and age-dependent differences in cell proliferation and neurogenesis in the hippocampus of wild-living rodents. Hippocampus 14:1000–1010. 10.1002/hipo.20018 - DOI - PubMed
    1. Barha CK, Brummelte S, Lieblich SE, Galea LA (2011) Chronic restraint stress in adolescence differentially influences hypothalamic‐pituitary‐adrenal axis function and adult hippocampal neurogenesis in male and female rats. Hippocampus 21:1216–1227. 10.1002/hipo.20829 - DOI - PubMed
    1. Barker JM, Galea LA (2008) Repeated estradiol administration alters different aspects of neurogenesis and cell death in the hippocampus of female, but not male, rats. Neuroscience 152:888–902. 10.1016/j.neuroscience.2007.10.071 - DOI - PubMed
    1. Beam CR, Kaneshiro C, Jang JY, Reynolds CA, Pedersen NL, Gatz M (2018) Differences between women and men in incidence rates of dementia and Alzheimer's disease. J Alzheimers Dis 64:1077–1083. 10.3233/JAD-180141 - DOI - PMC - PubMed

Publication types