. 2020 Jan 7;117(1):563-572.
doi: 10.1073/pnas.1915770117. Epub 2019 Dec 23.

A genetically defined disease model reveals that urothelial cells can initiate divergent bladder cancer phenotypes

Affiliations

A genetically defined disease model reveals that urothelial cells can initiate divergent bladder cancer phenotypes

Liang Wang et al. Proc Natl Acad Sci U S A. .

Abstract

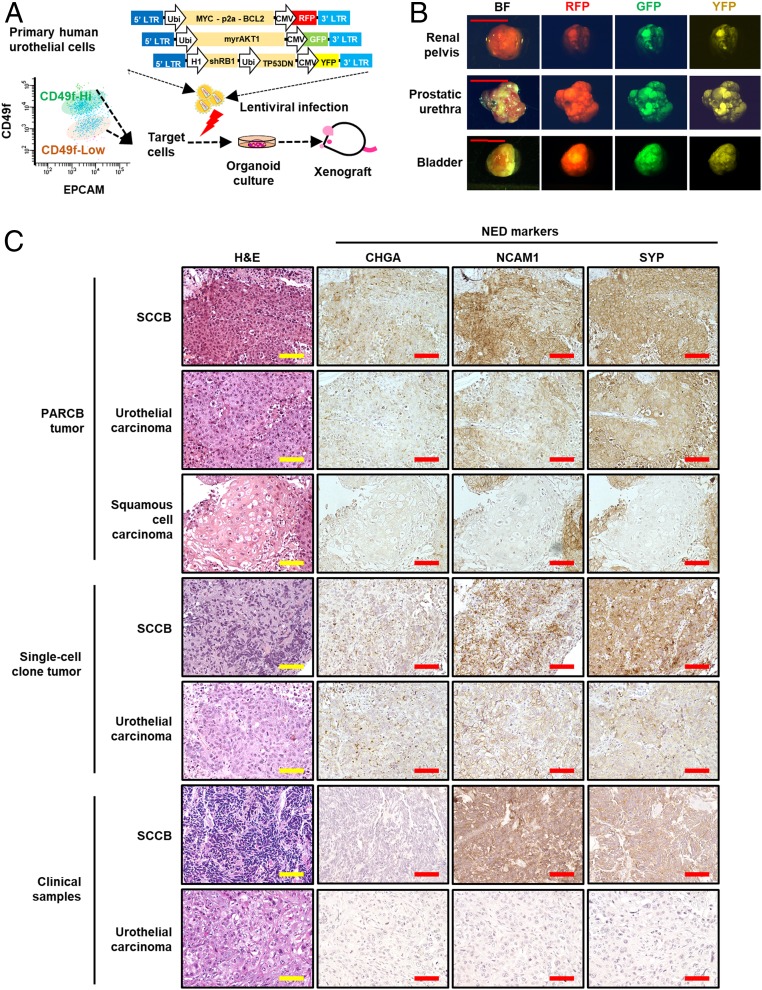
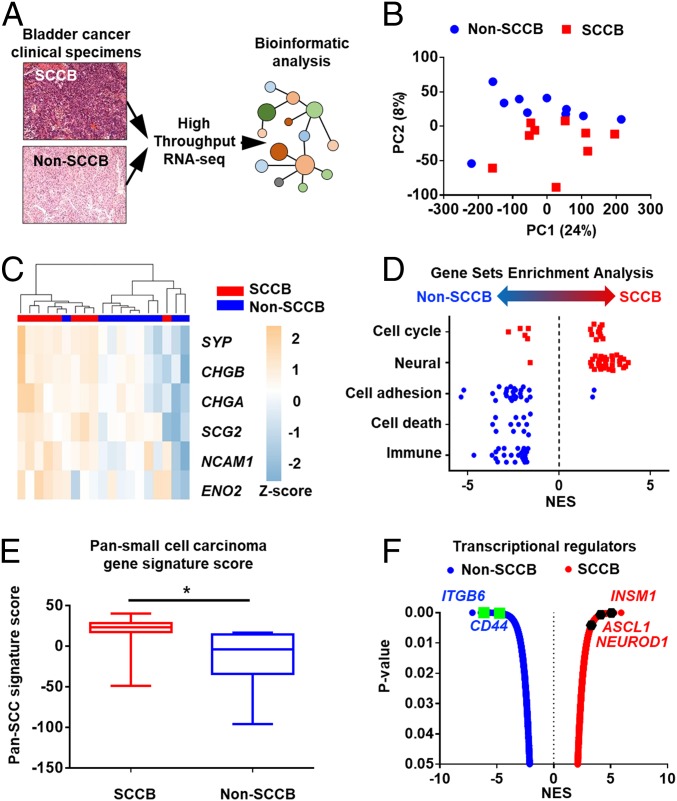
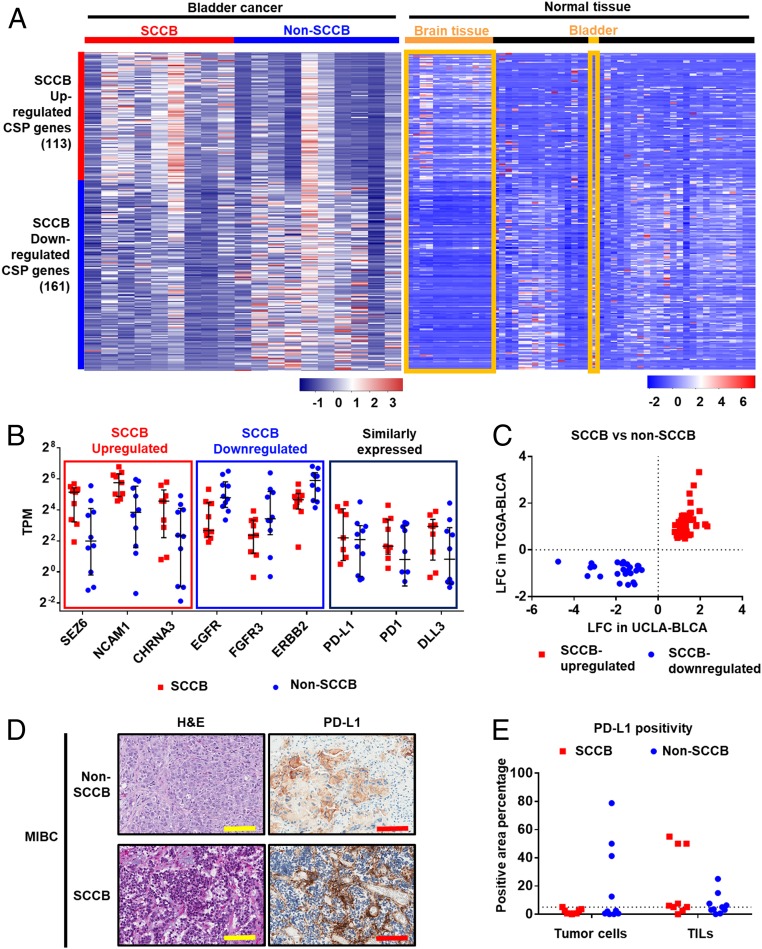
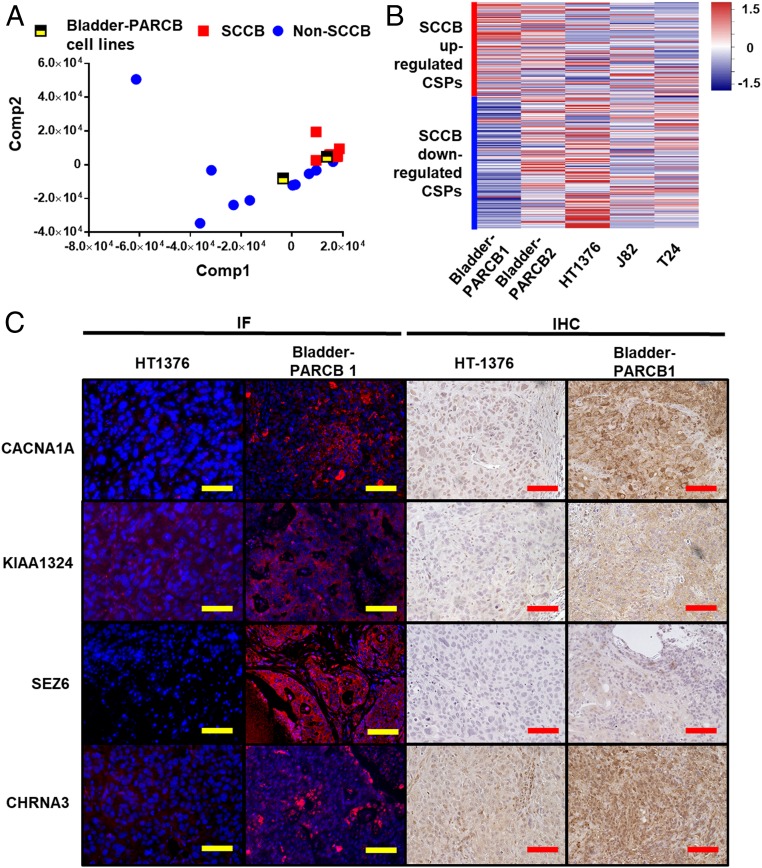
Small cell carcinoma of the bladder (SCCB) is a rare and lethal phenotype of bladder cancer. The pathogenesis and molecular features are unknown. Here, we established a genetically engineered SCCB model and a cohort of patient SCCB and urothelial carcinoma samples to characterize molecular similarities and differences between bladder cancer phenotypes. We demonstrate that SCCB shares a urothelial origin with other bladder cancer phenotypes by showing that urothelial cells driven by a set of defined oncogenic factors give rise to a mixture of tumor phenotypes, including small cell carcinoma, urothelial carcinoma, and squamous cell carcinoma. Tumor-derived single-cell clones also give rise to both SCCB and urothelial carcinoma in xenografts. Despite this shared urothelial origin, clinical SCCB samples have a distinct transcriptional profile and a unique transcriptional regulatory network. Using the transcriptional profile from our cohort, we identified cell surface proteins (CSPs) associated with the SCCB phenotype. We found that the majority of SCCB samples have PD-L1 expression in both tumor cells and tumor-infiltrating lymphocytes, suggesting that immune checkpoint inhibitors could be a treatment option for SCCB. We further demonstrate that our genetically engineered tumor model is a representative tool for investigating CSPs in SCCB by showing that it shares a similar a CSP profile with clinical samples and expresses SCCB-up-regulated CSPs at both the mRNA and protein levels. Our findings reveal distinct molecular features of SCCB and provide a transcriptional dataset and a preclinical model for further investigating SCCB biology.

Keywords: cancer phenotypes; cell surface protein; preclinical model; urothelial cell.


Conflict of interest statement

Competing interest statement: O.N.W. currently has consulting, equity, and/or board relationships with Trethera Corporation, Kronos Biosciences, Sofie Biosciences, and Allogene Therapeutics. T.G.G. currently has consulting and equity relationships with Trethera Corporation. The laboratory of T.G.G. has completed a research agreement with ImmunoActiva. None of these companies contributed to or directed any of the research reported in this article.

Figures

Fig. 1.
Fig. 1.
Tumors derived from PARCB-transduced EPCAM+/CD49f high urothelial cells recapitulate divergent bladder cancer phenotypes. PARCB induce divergent bladder cancer phenotypes in normal human urothelial cells. (A) Schematic of human urothelial cells transformation assay with isolated EpCAM+/CD49f high cells and 3 lentiviruses delivering 5 genetic factors (PARCB). The urothelial cells were isolated from human urinary tract using enzymatic digestion and were sorted using flow cytometry. The isolated cells were infected with lentiviruses contain the 5 genetic factors and were cultured in organoid format followed by subcutaneous injection in NSG mice. CMV, cytomegalovirus promoter; GFP: green fluorescent protein; LTR, long-terminal repeats; RFP, red fluorescent protein; Ubi, ubiquitin promoter; YFP, yellow fluorescent protein. (B) Representative images of tumors formed by PARCB-transduced urothelial cells from different sites of human urinary tract. PARCB tumors were harvested from subcutaneous xenograft in NSG mice. Bright-field (BF) and fluorescent pictures were taken to show the tumor size and the expression of fluorescent markers. (Scale bars, 1 cm.) (C) Representative of H&E and IHC images using antibodies against NED markers CHGA, NCAM1, and SYP, in different areas of a PARCB tumor, a single-cell clone-derived tumor, and non-SCCB and SCCB clinical samples. IHC were performed using antibodies targeting NED markers on these samples. (Scale bars, 100 μm.)
Fig. 2.
Fig. 2.
SCCB has a distinct transcriptional profile from non-SCCB phenotypes. Bioinformatics analyses revealed transcriptional differences between SCCB and non-SCCB samples in the UCLA-BLCA cohort. (A) Schematic of transcriptional analyses in the UCLA-BLCA cohort. FFPE samples were scratched and collected for RNA processing followed by high-throughput RNA-seq. (B) PCA performed using the TPM of mRNA expression of each sample from the UCLA-BLCA cohort. Figure shows that SCCB and non-SCCB samples are separated in this analysis. Each dot represents a sample with the corresponding phenotype (SCCB, red; non-SCCB, blue). (C) Unsupervised hierarchical clustering analysis using the TCGA neuroendocrine gene set separates SCCB from non-SCCB samples in the UCLA-BLCA cohort. Figure is shown by the z-score scaled by the TPM of each gene across samples. Each column represents a sample, each row represents a gene. Scale indicates the z-score. CHGB, chromogranin B; SCG2, Secretogranin II. (D) GSEA using differentially expressed gene profiles (normalized reads counts) identified gene sets that enriched in SCCB or non-SCCB samples. Each point represents a gene set associated with the category. Data are shown by normalized enrichment score (NES). Only gene sets that pass the P value filter <0.05 are shown. (E) Pan-small cell carcinoma gene-signature score of samples in the UCLA-BLCA cohort. SCCB samples has higher signature score than non-SCCB samples. Data are shown by the median and range of signature scores of all samples with corresponding phenotype (*P < 0.05, Student t test). (F) A plot shows the significance and enrichment score of transcriptional-regulators activated in corresponding phenotypes in the VIPER analysis. Each dot represents a master regulator gene that has a P < 0.05 in VIPER. NED regulators and cell-adhesion regulators are highlighted.
Fig. 3.
Fig. 3.
Profiling CSP genes identifies CSPs associated with SCCB and the expression of PD-L1 in SCCB samples. Transcriptional analyses profile CSPs genes in samples from the UCLA-BLCA cohort. (A) A heatmap shows CSP genes differentially expressed in SCCB and non-SCCB samples from the UCLA-BLCA cohort and their expression levels in normal tissues. Data are shown by the z-score normalized by genes across samples (Left) or tissues types (Right) based on the TPM of each sample (Left) or the median TPM of a tissue type (Right). Each row represents a gene in both panels. In the Left, each column represents a sample from the UCLA-BLCA cohort. In the Right, each column represents a tissue type from GTEx database. Brain tissues and bladder tissues are highlighted. Red color indicates higher expression level (higher z-score); blue color indicates lower expression level (lower z-score). Scale bar indicates the z-score. (B) mRNA expression level of selected CSP genes in each group. The SCCB up-regulated or SCCB down-regulated CSPs have P < 0.05 in the DESeq2 analysis (suggesting significantly up-regulated or down-regulated in SCCB samples comparing to non-SCCB samples.) The similarly expressed CSPs have a P value >0.05 in the DEseq2 analysis. The TPM of each sample is shown. Each dot represents a sample with corresponding phenotype. The median and interquartile range are shown. Samples with a TPM less than 0.125 is not shown in the figure. (C) A plot of LFC in UCLA-BLCA and TCGA datasets showing the LFC of CSP genes that are differentially expressed in both the UCLA-BLCA dataset and the TCGA dataset. Each dot represents a CSP gene. CSPs have been prefiltered for P < 0.05 in both UCLA-BLCA and TCGA-BLCA datasets in DESeq2 analysis comparing SCCB versus non-SCCB samples. (D) Representative images of H&E and IHC using a Food and Drug Administration-approved PD-L1 antibody (Ventana SP-142) showed PD-L1 expression in non-SCCB and SCCB sample. (Scale bars, 100 μm.) (E) Quantification analysis of PD-L1 IHC staining in the UCLA-BLCA cohort. Data are shown by the percentage of PD-L1 staining positivity in tumor cells and TILs in non-SCCB and SCCB samples. Each dot represents a sample of given phenotype. The dot line shows 5% positivity. No statistical significance is observed between SCCB and non-SCCB samples in tumor cell or TILs (Student t test).
Fig. 4.
Fig. 4.
Bladder-PARCB cell lines share similar CSP profile with clinical SCCB samples. Bladder-PARCB cell lines express SCCB-associated CSPs at mRNA and protein levels. (A) PLSR projecting the CSP transcriptional profile of bladder-PARCB cell lines to the UCLA-BLCA cohort. The bladder-PARCB1 cell line is clustered with clinical SCCB samples. (B) Heatmap summarized the expression of phenotype-associated CSPs in bladder-PARCB cell lines and urothelial carcinoma cell lines NCI-HT1376, J82, and T24. Data are shown by the z-score normalized by genes across cell lines based on the TPM of genes in each cell line. Each row represents a gene. Red color indicates higher expression level (higher z-score); blue color indicates lower expression level (lower z-score). (C) Representative image of IF or IHC using antibody against CACNA1A, KIAA1324, CHRNA3, and SEZ6 in tumor derived from HT-1376 and PARCB cell lines. In the IF panel, blue color shows nuclear staining by DAPI, red color indicates positivity of CSPs. (Scale bars, 100 μm.)

Comment in

References

    1. Sanli O., et al. , Bladder cancer. Nat. Rev. Dis. Primers 3, 17022 (2017). - PubMed
    1. Ghervan L., Zaharie A., Ene B., Elec F. I., Small-cell carcinoma of the urinary bladder: Where do we stand? Clujul Med. 90, 13–17 (2017). - PMC - PubMed
    1. Choong N. W., Quevedo J. F., Kaur J. S., Small cell carcinoma of the urinary bladder. The Mayo Clinic experience. Cancer 103, 1172–1178 (2005). - PubMed
    1. Ghatalia P., Jung K., Litwin S., Bilusic M., Small cell carcinoma of the bladder: Comparison of survival in various treatment modalities at Fox Chase Cancer Center (FCCC) from 1995 to 2015. J. Clin. Oncol. 34, 465 (2016).
    1. Morales A., Eidinger D., Bruce A. W., Intracavitary Bacillus Calmette-Guerin in the treatment of superficial bladder tumors. J. Urol. 116, 180–183 (1976). - PubMed

Publication types

MeSH terms

Substances