. 2020 Jan 7;117(1):708-716.
doi: 10.1073/pnas.1910589117. Epub 2019 Dec 23.

The olfactory basis of orchid pollination by mosquitoes

Affiliations

The olfactory basis of orchid pollination by mosquitoes

Chloé Lahondère et al. Proc Natl Acad Sci U S A. .

Abstract

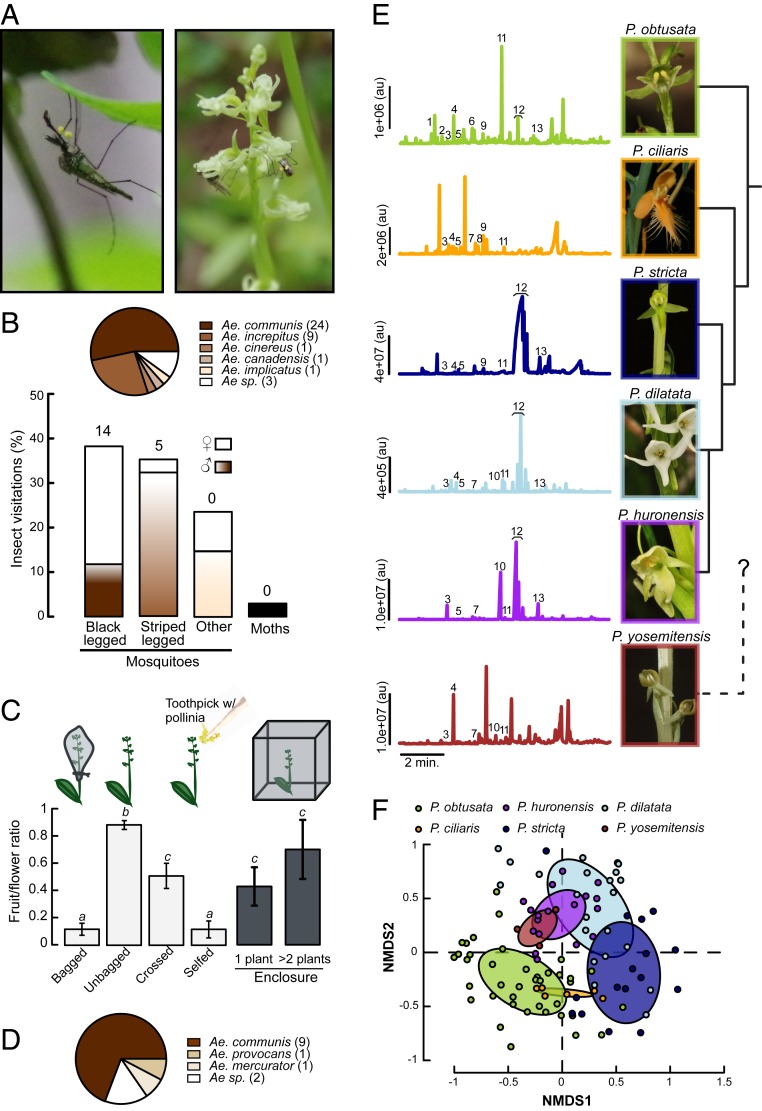
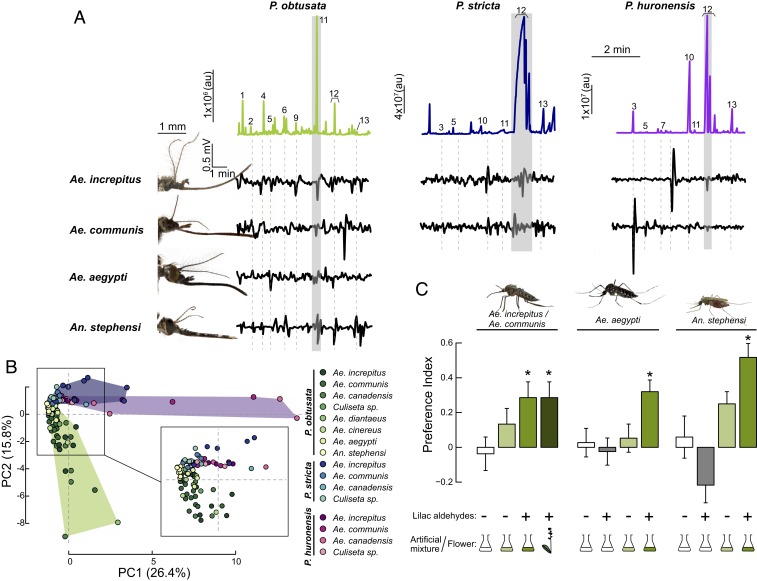
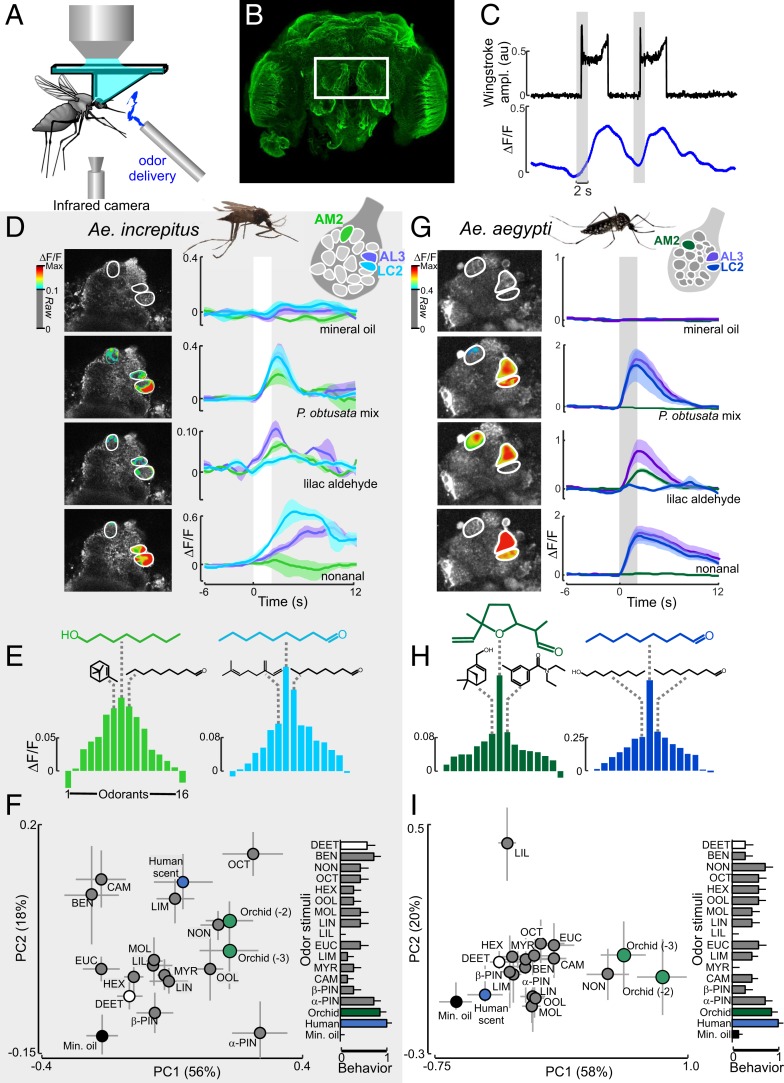
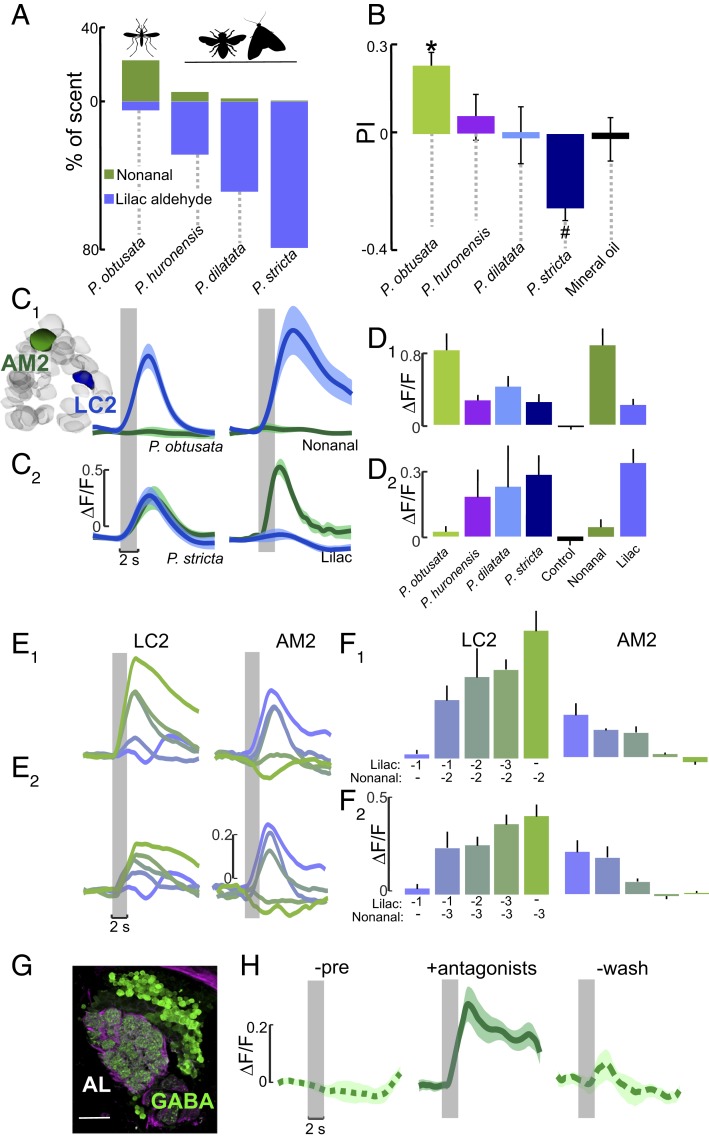
Mosquitoes are important vectors of disease and require sources of carbohydrates for reproduction and survival. Unlike host-related behaviors of mosquitoes, comparatively less is understood about the mechanisms involved in nectar-feeding decisions, or how this sensory information is processed in the mosquito brain. Here we show that Aedes spp. mosquitoes, including Aedes aegypti, are effective pollinators of the Platanthera obtusata orchid, and demonstrate this mutualism is mediated by the orchid's scent and the balance of excitation and inhibition in the mosquito's antennal lobe (AL). The P. obtusata orchid emits an attractive, nonanal-rich scent, whereas related Platanthera species-not visited by mosquitoes-emit scents dominated by lilac aldehyde. Calcium imaging experiments in the mosquito AL revealed that nonanal and lilac aldehyde each respectively activate the LC2 and AM2 glomerulus, and remarkably, the AM2 glomerulus is also sensitive to N,N-diethyl-meta-toluamide (DEET), a mosquito repellent. Lateral inhibition between these 2 glomeruli reflects the level of attraction to the orchid scents. Whereas the enriched nonanal scent of P. obtusata activates the LC2 and suppresses AM2, the high level of lilac aldehyde in the other orchid scents inverts this pattern of glomerular activity, and behavioral attraction is lost. These results demonstrate the ecological importance of mosquitoes beyond operating as disease vectors and open the door toward understanding the neural basis of mosquito nectar-seeking behaviors.

Keywords: Aedes aegypti; Platanthera; mosquitoes; nectar; olfaction.


Conflict of interest statement

Competing interest statement: A provisional patent on the odor that mimics the orchid scent was recently filed (62/808,710).

Figures

Fig. 1.
Fig. 1.
Association between the P. obtusata orchid and mosquito pollinators. (A) Picture (Left image) of a black legged male mosquito bearing 2 pollinia on its head, and (Right image) a male mosquito feeding on P. obtusata and a female with 2 pollinia attached to its head after having visited a flower. (B) Insect visitations (barplot; % insect visitation, calculated by the total number of insect visits to P. obtusata) and distribution of the mosquito species found in the field with pollinia (pie chart; numbers in legend denote the number of mosquitoes with pollinia). Both males (dark brown bars) and females (white bars) of different mosquito species visited the plants. Black-legged mosquitoes were predominantly Ae. communis, and striped legged were Ae. increpitus. Numbers above the bars indicate the number of individuals observed with pollinia. (C) Fruit-to-flower ratio for bagged (using organza bags around P. obtusata plants to prevent pollinator visitation), unbagged, self-crossed, out-crossed plants, and plants in the enclosure. Bagged and self-pollinated plants produced similar fruit-to-flower ratios (0.11 ± 0.04, 0.12 ± 0.06, respectively; Mann–Whitney U test, P = 0.99), but were significantly lower than the unbagged plants (0.89 ± 0.03; Mann–Whitney U test, P < 0.001). Although fruit weight did not differ between treatments (Student’s t test, P = 0.082), bagged plants produced significantly fewer viable seeds per fruit per flower than unbagged plants (SI Appendix, Fig. S1; Wilcoxon rank sum test, P < 0.05). Letters above bars show statistical differences between experimental conditions (Mann–Whitney U test, P < 0.05). Bars are the mean ± SEM (n = 8 to 20 plants/treatment). (D) Pie chart of the species of mosquitoes which removed pollinia from the plants in the enclosures (numbers in legend denote the number of mosquitoes with pollinia). (E) GCMS analyses of the floral volatiles emitted by P. obtusata, P. ciliaris, P. stricta, P. dilatata, P. huronensis, and P. yosemitensis. Pictures of the floral species, and their phylogenetic relationship, are shown on the Right. P. obtusata flowers emitted a low emission rate scent that is dominated by aliphatic compounds (including octanal [No. 7], 1-octanol [No. 9], and nonanal [No. 11]; 54% of the total emission), whereas the moth-visited species P. dilatata, P. huronensis, and P. stricta emit strong scents dominated by terpenoid compounds (75%, 76%, and 97% of the total emission for the 3 species, respectively), and the butterfly-visited P. ciliaris orchid is dominated by nonanal and limonene (24% and 12% of the total emission, respectively) (SI Appendix, Table S3). Numbers in the chromatograms correspond to: 1, α-pinene; 2, camphene; 3, benzaldehyde; 4, β-pinene; 5, β-myrcene; 6, octanal; 7, d-limonene; 8, eucalyptol; 9, 1-octanol; 10, (±)linalool; 11, nonanal; 12, lilac aldehydes (D and C isomers); and 13, lilac alcohol. Orchid images courtesy of G. Van Velsir, R. Coleman, and T. Nelson (photographers). (F) Nonmetric multidimensional scaling (NMDS) plot (stress = 0.265) of the chemical composition of the scent of all of the orchid species presented in B. Each dot represents a sample from a single individual plant collected in the field. The ellipses represent the SD around the centroid of their respective cluster. Differences in scent composition and emission rate are significantly different between species (composition: ANOSIM, R = 0.25, P = 0.001; emission rate: Student’s t tests, P < 0.05). au, arbitrary units.
Fig. 2.
Fig. 2.
Identification of behaviorally effective orchid volatiles in mosquitoes. (A) Gas chromatogram traces for the P. obtusata (Left), P. stricta (Middle), and P. huronensis (Right) headspaces, with electroantennogram responses to the GC peaks for 4 mosquito species (Ae. communis, Ae. increpitus, Ae. aegypti, and An. stephensi) immediately below. See chromatogram number correspondence in Fig. 1 legend. Mosquito images courtesy of A. Jewiss-Gaines (photographer) and F. Hunter (Brock University, St. Catharines, Canada). (B) PCA plot based on the antennal responses of individual mosquitoes from the different Aedes species to the peaks from the P. obtusata, P. stricta, and P. huronensis scents. Each dot corresponds to the responses of an individual mosquito; shaded areas and dots are color coded according to mosquito species and flower scent (green, P. obtusata; blue, P. stricta; and purple, P. huronensis). Antennal responses to the 3 tested orchid scents were significantly different from one another (ANOSIM, R = 0.137, P < 0.01) (n = 3 to 16 mosquitoes per species per floral extract). (C) Behavioral preferences by snow mosquitoes (Ae. communis and Ae. increpitus), Ae. aegypti, and An. stephensi mosquitoes to the P. obtusata scent and scent mixture, with and without the lilac aldehyde (at the concentration found in the P. obtusata headspace). A y-maze olfactometer was used for the behavioral experiments in which mosquitoes are released and have to fly upwind and choose between 2 arms carrying the tested compound/mixture or no odorant (control). A preference index (PI) was calculated based on these responses (see SI Appendix, Supplementary Methods for details). The colored flask denotes the use of an artificial mixture (dark green is with lilac aldehyde; light green is without); empty flask denotes the negative (solvent) control. The plant motif is the positive control (orchid flowers), and the + and − symbols represent the presence or absence of the lilac aldehyde in the stimulus, respectively. Bars are the mean ± SEM (n = 17 to 53 mosquitoes/treatment); asterisks denote a significant difference between treatments and the mineral oil (no odor) control (binomial test: P < 0.05). au, arbitrary units.
Fig. 3.
Fig. 3.
Mosquito antennal lobe responses to the P. obtusata scent. (A) Schematic of the 2-photon setup used to record calcium dynamics in the mosquito AL. (B) Ae. aegypti brain (α-tubulin stain). The white rectangle surrounds the 2 ALs that are accessible for calcium imaging. Optical sectioning using the 2-photon microscope and subsequent immunohistochemical characterization allowed us to register glomeruli to an AL atlas as well as repeatably image from the same glomeruli. Although the AL between species differed in volume (0.0029 ± 0.0001 and 0.0062 ± 0.0004 mm3 for Ae. aegypti and Ae. increpitus, respectively), they consisted of similar numbers of glomeruli (18 to 22 glomeruli) in the ventral region of the AL, ∼40 µm from the surface. (C) Representative time traces of behavioral (wing-stroke amplitude) (Top, black) and AL LC2 glomerulus response (Bottom, blue) to 2 P. obtusata odor stimulations (gray bars). (D) For Ae. increpitus mosquitoes with bath application of Fluo4, schematic of AL glomeruli imaged at the 40-µm depth (Top) and pseudocolor plot overlying the raw grayscale image (Left) and mean ∆F/F time traces (Right) for Ae. increpitus AL glomerular (AM2 [green], LC2 [blue], and AL3 [purple]) responses to mineral oil (no odor) control (Top); P. obtusata mix (Middle, Top); lilac aldehyde (Middle, Bottom); and nonanal (Bottom). White bars are the odor stimulations. Traces are the mean from 3 to 9 mosquitoes; shaded areas denote the SEM. Pseudocolor images were generated by subtracting the frame before stimulus onset from the frames during the stimulus window; only those glomerular regions of interest that were >0.1 ∆F/F are shown. (E) Response curves for the Ae. increpitus AM2 (green) and LC2 (blue) glomeruli based on a panel of 16 odorants. AM2 is most responsive to octanol (green chemical structure), followed by α-pinene and nonanal (black chemical structures). LC2 is most responsive to nonanal (blue), followed by octanal and β-myrcene (black chemical structures). Bars are the mean (n = 3 to 9). (F, Left) PC plot from responses of 20 glomeruli to the odorants. PC1 and PC2 explain 56% and 18% of the variance, respectively. The orchid mixture at 2 concentrations (1:100 and 1:1,000 dilution) and nonanal evoked stronger responses than the mineral oil (no odor) control (Kruskal–Wallis test: P < 0.05) and were significantly different in the multivariate analysis (ANOSIM: P < 0.05). Error bars represent SEM. (F, Right) Behavioral responses of the tethered mosquitoes to the odor stimuli. Responses were significantly different between the mineral oil control and the human and orchid scents (Kruskal–Wallis test: P < 0.05), although they were not significantly correlated with the glomerular representations (Spearman rank correlation: ρ = 0.35; P = 0.16). (G) As in D, but for PUb-GCaMP6s Ae. aegypti mosquitoes and the AM2 (green), LC2 (blue), and AL3 (purple) AL glomeruli. Traces are the mean (n = 7 to 14 mosquitoes); shaded area is the SEM. (H) As in E, but for the Ae. aegypti AM2 and LC2 glomeruli. AM2 is the most responsive to lilac aldehyde (green), followed by DEET and myrtenol (black chemical structures). LC2 is the most responsive to nonanal (blue), followed by octanal and octanol (black chemical structures). Bars are the mean (n = 7 to 14 mosquitoes). (I, Left) As in F, but for the Ae. aegypti mosquito and the 18 imaged glomerular responses to the panel of odorants. PC1 and PC2 explain 58% and 20% of the variance, respectively. (I, Right) Behavioral responses for the orchid and human scents were significantly different from control (P < 0.05), although the correlation with the glomerular responses was not significant (Spearman rank correlation: ρ = 0.46; P = 0.07). AM, anterior-medial; LC, lateral-central; AD, anterior-lateral.
Fig. 4.
Fig. 4.
Glomeruli encoding the orchid scents are sensitive to odorant ratios. (A) Percentage of nonanal and lilac aldehyde concentrations in the different Platanthera orchid scents, which have 6- to 40-fold higher lilac aldehyde concentrations than P. obtusata. (B) Behavioral preferences by Ae. aegypti mosquitoes to scent mixtures containing lilac aldehydes at the concentrations quantified in the different Plathanthera species. Similar to Fig. 2C, mosquitoes were released in a y-olfactometer and had to choose between 2 arms carrying the scent mixture or no odorant (control). Asterisk denotes a significant difference from the mineral oil control (binomial test: P < 0.05); number symbol denotes a significant difference from the P. obtusata scent (binomial test: P < 0.05). (C and C1) Mean ∆F/F time traces for LC2 (blue) and AM2 (green) glomeruli to P. obtusata (Left) and nonanal (Right). (C2) Same as in C1, except to the P. stricta scent (Left) and lilac aldehyde (Right). The P. obtusata and P. stricta mixtures contain the same concentration of nonanal and other constituents but differ in their lilac aldehyde concentrations (see A). Traces are the mean (n = 6 to 10 mosquitoes); shaded areas denote ± SEM. (D and D1) Responses of the LC2 glomerulus to the different Platanthera orchid mixtures, and the single odorants nonanal and lilac aldehyde. The increasing concentration of lilac aldehyde in the other orchid mixtures caused a significant suppression of LC2 response to the nonanal in the scents (Kruskal–Wallis test: P < 0.05), even though nonanal was at the same concentration as in the P. obtusata mixture. (D2) Responses of the AM2 glomerulus to the different Platanthera orchid scents and nonanal and lilac aldehyde constituents. The increasing concentration of lilac aldehyde in the other orchid scents caused a significant increase in AM2 responses compared with responses to P. obtusata (Kruskal–Wallis test: P < 0.05). Bars are the mean ± SEM. (E) ∆F/F time traces for the LC2 (Left) and AM2 (Right) glomeruli. The preparation was simultaneously stimulated using separate vials of lilac aldehyde and nonanal at different concentrations to create 10 different mixture ratios. (E1) Each trace is a different ratio of lilac aldehyde to nonanal, ranging from green (10−2 nonanal: 0 lilac aldehyde) to purple (0 nonanal: 10−1 lilac aldehyde); 10−3 to 10−1 lilac aldehyde, and 10−2 nonanal concentrations were tested. (E2) As in E1, except tested concentrations were 10−3 to 10−1 for lilac aldehyde, and 10−3 for nonanal. (F and F1) Mean ∆F/F during 2 s of odor presentation for the LC2 glomerulus (Left) and the AM2 glomerulus (Right). Bars are color coded according to the ratio of lilac aldehyde to nonanal traces in E1. (F2) As in F1, except the concentrations of lilac aldehyde and nonanal in the ratio mixtures correspond to those in E2. Bars are the mean (n = 6) ± SEM. (G) Antibody labeling against GABA (green) in the right Ae. aegypti AL; background label (α-tubulin) is purple. (Scale bar, 20 µm.) (H) Mean ∆F/F time traces for the AM2 glomerulus. GABA receptor antagonists block the suppressive effect of nonanal to AM2’s response to the lilac aldehyde in the P. obtusata mixture, causing a significantly higher response than the preapplication and wash periods (Kruskal–Wallis test: P < 0.05). Traces are the mean (n = 4 mosquitoes) ± SEM.

Similar articles

Cited by

References

    1. World Health Organization , “A global brief on vector-borne diseases” (No. WHO/DCO/WHD/2014.1, WHO Press, Geneva, Switzerland, 2014).
    1. Cardé R. T., Gibson G., Host finding by female mosquitoes: mechanisms of orientation to host odours and other cues. Olfaction vector host Interact. 2010, 115–142 (2010).
    1. McMeniman C. J., Corfas R. A., Matthews B. J., Ritchie S. A., Vosshall L. B., Multimodal integration of carbon dioxide and other sensory cues drives mosquito attraction to humans. Cell 156, 1060–1071 (2014). - PMC - PubMed
    1. Takken W., Verhulst N. O., Host preferences of blood-feeding mosquitoes. Annu. Rev. Entomol. 58, 433–453 (2013). - PubMed
    1. van Breugel F., Riffell J., Fairhall A., Dickinson M. H., Mosquitoes use vision to associate odor plumes with thermal targets. Curr. Biol. 25, 2123–2129 (2015). - PMC - PubMed

Publication types

MeSH terms