. 2020 Jan 7;117(1):439-447.
doi: 10.1073/pnas.1914072117. Epub 2019 Dec 23.

Regulation of INF2-mediated actin polymerization through site-specific lysine acetylation of actin itself

Affiliations

Regulation of INF2-mediated actin polymerization through site-specific lysine acetylation of actin itself

Mu A et al. Proc Natl Acad Sci U S A. .

Abstract

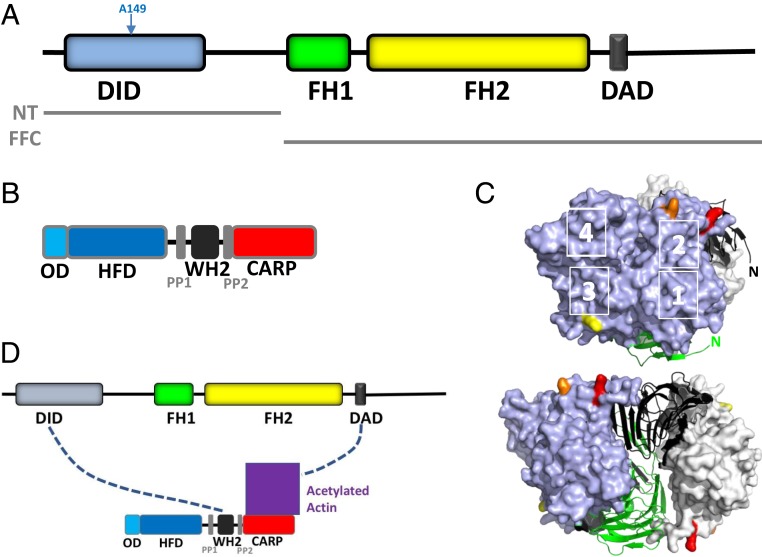
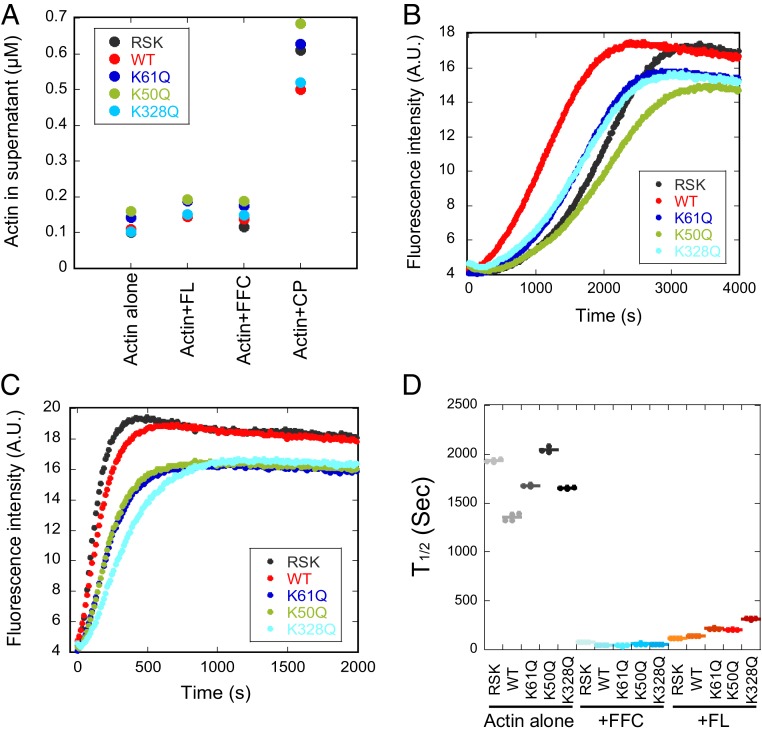
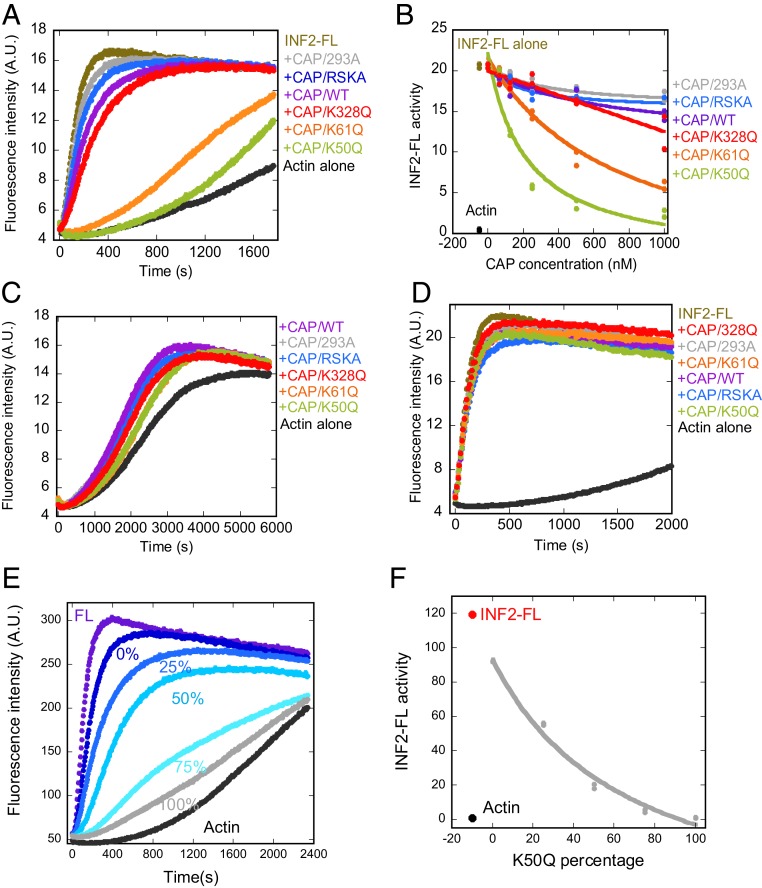
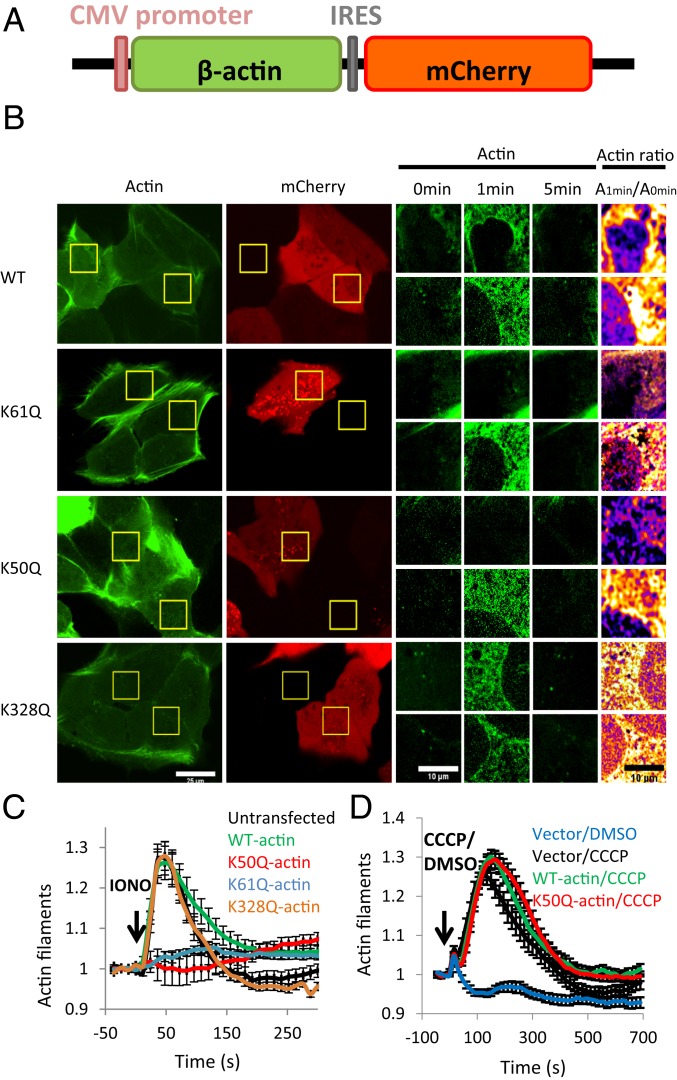
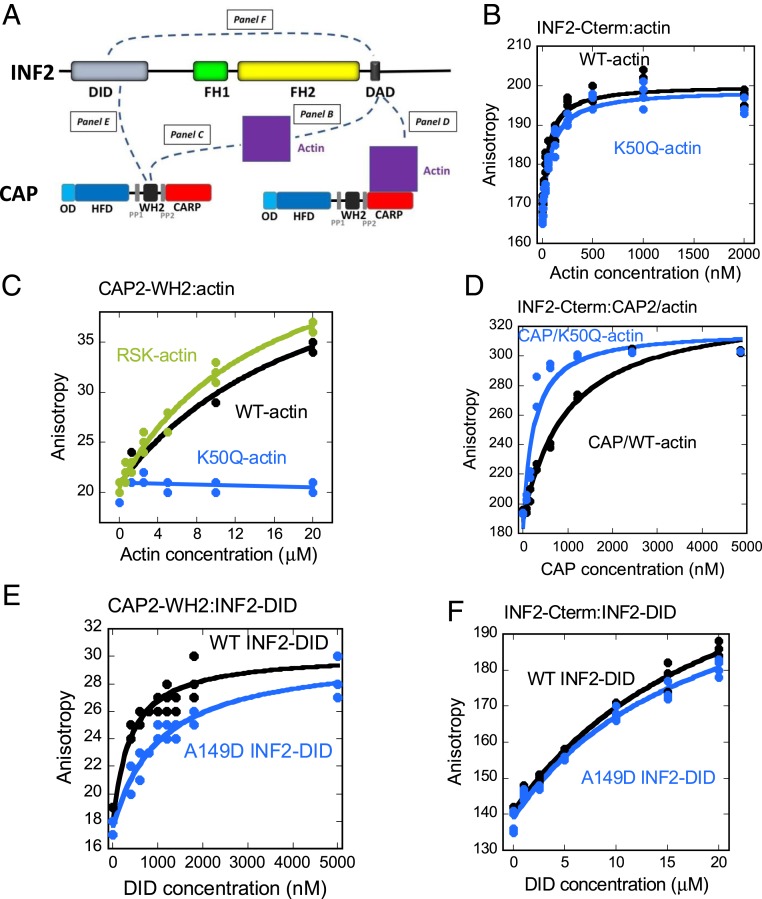
INF2 is a formin protein that accelerates actin polymerization. A common mechanism for formin regulation is autoinhibition, through interaction between the N-terminal diaphanous inhibitory domain (DID) and C-terminal diaphanous autoregulatory domain (DAD). We recently showed that INF2 uses a variant of this mechanism that we term "facilitated autoinhibition," whereby a complex consisting of cyclase-associated protein (CAP) bound to lysine-acetylated actin (KAc-actin) is required for INF2 inhibition, in a manner requiring INF2-DID. Deacetylation of actin in the CAP/KAc-actin complex activates INF2. Here we use lysine-to-glutamine mutations as acetylmimetics to map the relevant lysines on actin for INF2 regulation, focusing on K50, K61, and K328. Biochemically, K50Q- and K61Q-actin, when bound to CAP2, inhibit full-length INF2 but not INF2 lacking DID. When not bound to CAP, these mutant actins polymerize similarly to WT-actin in the presence or absence of INF2, suggesting that the effect of the mutation is directly on INF2 regulation. In U2OS cells, K50Q- and K61Q-actin inhibit INF2-mediated actin polymerization when expressed at low levels. Direct-binding studies show that the CAP WH2 domain binds INF2-DID with submicromolar affinity but has weak affinity for actin monomers, while INF2-DAD binds CAP/K50Q-actin 5-fold better than CAP/WT-actin. Actin in complex with full-length CAP2 is predominately ATP-bound. These interactions suggest an inhibition model whereby CAP/KAc-actin serves as a bridge between INF2 DID and DAD. In U2OS cells, INF2 is 90-fold and 5-fold less abundant than CAP1 and CAP2, respectively, suggesting that there is sufficient CAP for full INF2 inhibition.

Keywords: U2OS; WH2 motif; cyclase-associated protein; mitochondria; nucleation.


Conflict of interest statement

The authors declare no competing interest.

Figures

Fig. 1.
Fig. 1.
INF2, CAP, and the bridge model of INF2 inhibition. (A) Schematic of human INF2-nonCAAX (1,240 amino acids), including DID (amino acids 32 to 261), formin homology 1 domain (FH1; amino acids 421 to 520), formin homology 2 domain (FH2; amino acids 554 to 940), and DAD/WH2 (amino acids 971 to 1,000). Boundaries of the N-terminal construct (NT) and FH1-FH2-C (FFC) construct used in this study are also shown. (B) Schematic of human CAP2 (477 amino acids), including oligomerization domain (OD; amino acids 1 to 42), HFD (amino acids 43 to 217), proline-rich region 1 (PP1; amino acids 229 to 245), WH2 motif (amino acids 254 to 297), proline-rich region 2 (PP2; amino acids 308 to 323), and CARP domain (amino acids 324 to 477). (C) Actin monomers (blue, gray surfaces) bound to the dimeric CARP domain of CAP1 (black, green ribbons). K50, K61, and K328 on actin are highlighted in red, orange, and yellow, respectively. Actin subdomains are indicated by white numbers. N, amino-termini of CARP subunits. Adapted from Protein Data Bank ID code 6FM2, data from ref. . (Bottom) Structure rotated 90° to the left. (D) Bridge model of INF2 inhibition by CAP/actin, whereby INF2-DID interacts with CAP-WH2 while INF2-DAD interacts with acetylated actin, which is bound to the CARP domain of CAP.
Fig. 2.
Fig. 2.
K-to-Q mutant actins are polymerization-competent. (A) Quantification of actin concentration (μM) in supernatant from high-speed pelleting assays. Actins were polymerized for 18 h at 23 °C (2 μM actin), then ultracentrifuged to separate polymerized actin (pellet) from monomeric actin (supernatant). Four conditions were tested: actin alone (−), +20 nM INF2-FL (FL), +20 nM INF2-FFC (FFC), and +10 nM capping protein (CP). Sample gels are shown in SI Appendix, Fig. S1C. (B and C) Pyrene-actin polymerization assays of 2 μM actin alone (B) or +20 nM INF2-FL (C). Actin composition: 1.9 μM of the indicated actin +0.1 μM pyrene-labeled RSK actin. (D) Time to half-maximum polymerization, measured from pyrene-actin curves similar to those in B and C and SI Appendix, Fig. S1D. Sec, seconds; A.U., arbitrary units.
Fig. 3.
Fig. 3.
β-actin mutants K50Q and K61Q, when bound to CAP2, inhibit INF2-mediated actin polymerization in biochemical assays. (A) Pyrene-actin polymerization assays (2 μM RSK-actin, 5% pyrene-labeled) containing 20 nM INF2-FL and 1 μM of the indicated CAP/actin complex. (B) Concentration curves of CAP/actin inhibition of INF2-FL polymerization activity, from assays similar to panel A. Polymerization activity of actin alone (black) and with INF2-FL (brown) shown to left of the curves. (C) Pyrene-actin polymerization assays of actin alone (2 μM RSK-actin, 5% pyrene-labeled) or in the presence of 1 μM of the indicated CAP/actin complex. (D) Pyrene-actin polymerization assays (2 μM RSK-actin, 5% pyrene-labeled) with 20 nM INF2-FFC and 1 μM of the indicated CAP/actin complex. (E) Pyrene-actin polymerization assays similar to those in D, in which varying ratios of K50Q:WT-β-actin were exchanged onto CAP2, then assayed for inhibition of INF2-FL. The percentages listed represent the percentage of K50Q-actin in the exchange reaction. Concentrations in pyrene-actin assays: 2 μM RSK-actin (5% pyrene), 20 nM INF2-FL, and 1 μM CAP/actin. (F) Graph of INF2-FL activity in the presence of 1 μM CAP/actin as a function of percent K50Q-actin in exchange reactions, from data similar to those in E. A.U., arbitrary units.
Fig. 4.
Fig. 4.
β-actin K50Q and K61Q mutants inhibit the calcium-induced actin burst in U2OS cells. (A) Schematic of mammalian expression construct coexpressing β-actin (untagged) and mCherry. (B) Micrographs of calcium-induced actin burst for cells expressing 4 β-actin constructs: WT, K61Q, K50Q, and K328Q. U2OS cells were cotransfected with the β-actin/mCherry expression plasmid along with a plasmid containing GFP-F-tractin (to label actin filaments). Live cells were imaged for GFP and mCherry before and during stimulation with ionomycin (4 μM in serum-containing medium). The micrographs at left are full-field views of GFP and mCherry, and those in the center are zoom-in views of GFP-F-tractin at 3 time points of ionomycin stimulation (0, 1, and 5 min) for 2 cells in the field: an mCherry-expressing cell (Top) and a cell not expressing detectable mCherry (Bottom). At the right is a differential heat map showing the ratio of the actin signal at 1 min to the signal at 0 min (red/yellow colors denote a higher 1 min:0 min ratio). (Scale bars: 25 μm at left and 10 μm in the zoom-in views). (C) Quantification of the ionomycin-induced actin burst for cells expressing WT β-actin, K50Q β-actin, K61Q β-actin, and K328Q β-actin, compared with cells not expressing an actin/mCherry construct (untransfected). Results are from 3 experiments, with a total of 17 untransfected, 38 WT, 42 K61Q, 29 K50Q, and 34 K328Q cells analyzed. (D) Quantification of the CCCP-induced actin burst for cells transfected with the mCherry vector with no actin (vector/CCCP, black, 61 cells), the mCherry/WT-actin vector (WT-actin/CCCP, green, 71 cells), or the mCherry/K50Q-actin vector (K50Q-actin/CCCP, red, 72 cells). Mock-stimulation of mCherry/no actin-transfected cells (Vector/DMSO, blue, 40 cells) shown for comparison. Results are from 3 independent experiments.
Fig. 5.
Fig. 5.
CAP’s WH2 binds INF2 DID, while INF2’s DAD binds CAP/KAc-actin. (A) Schematic of binding interactions measured in B–F, showing bars for INF2 (top bar) and CAP (bottom bars) and a purple square for actin. (BF) Fluorescence anisotropy measurements using TAMRA-INF2-Cterm (50 nM) or FITC-CAP2-WH2 (100 nM). (B) Interaction between INF2-Cterm and WT-β-actin (black) or K50Q-β-actin (blue). (C) Interaction between CAP2-WH2 and RSK-actin (green), WT-β-actin (black) or K50Q-β-actin (blue). CAP1-WH2 results are presented in SI Appendix, Fig. S5B. (D) Interaction between INF2-Cterm and CAP/WT-β-actin (black) or CAP/K50Q-β-actin (blue) complex. (E) Interaction between CAP2-WH2 and INF2-Nterm (black) or INF2-A149D-Nterm (blue). CAP1-WH2 results are presented in SI Appendix, Fig. S5C. (F) Interaction between INF2-Cterm (right) and INF2-Nterm (black) or INF2-A149D-Nterm (blue). All anisotropy values are in milli-anisotropy units.

Similar articles

Cited by

References

    1. Higgs H. N., Formin proteins: A domain-based approach. Trends Biochem. Sci. 30, 342–353 (2005). - PubMed
    1. Goode B. L., Eck M. J., Mechanism and function of formins in the control of actin assembly. Annu. Rev. Biochem. 76, 593–627 (2007). - PubMed
    1. Sun H., Schlondorff J. S., Brown E. J., Higgs H. N., Pollak M. R., Rho activation of mDia formins is modulated by an interaction with inverted formin 2 (INF2). Proc. Natl. Acad. Sci. U.S.A. 108, 2933–2938 (2011). - PMC - PubMed
    1. Li F., Higgs H. N., The mouse formin mDia1 is a potent actin nucleation factor regulated by autoinhibition. Curr. Biol. 13, 1335–1340 (2003). - PubMed
    1. Dominguez R., The WH2 domain and actin nucleation: Necessary but insufficient. Trends Biochem. Sci. 41, 478–490 (2016). - PMC - PubMed

Publication types

LinkOut - more resources