. 2020 Jan;22(1):38-48.
doi: 10.1038/s41556-019-0439-6. Epub 2019 Dec 23.

Combined single-cell and spatial transcriptomics reveal the molecular, cellular and spatial bone marrow niche organization

Affiliations

Combined single-cell and spatial transcriptomics reveal the molecular, cellular and spatial bone marrow niche organization

Chiara Baccin et al. Nat Cell Biol. 2020 Jan.

Abstract

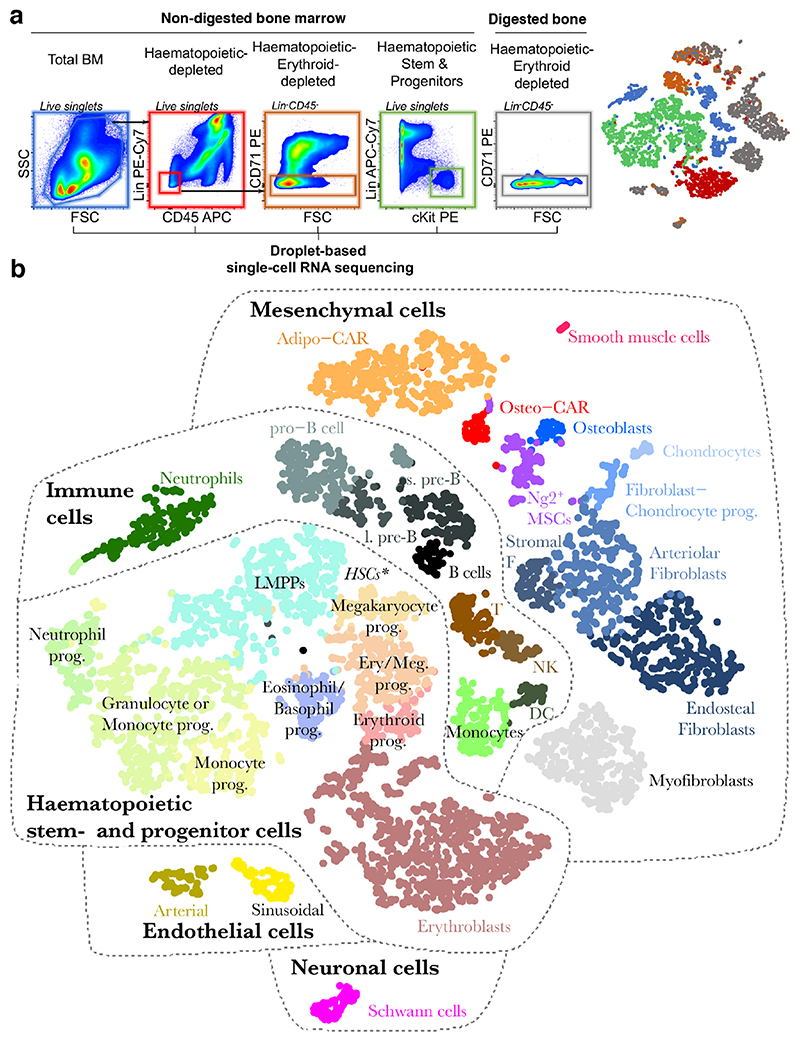
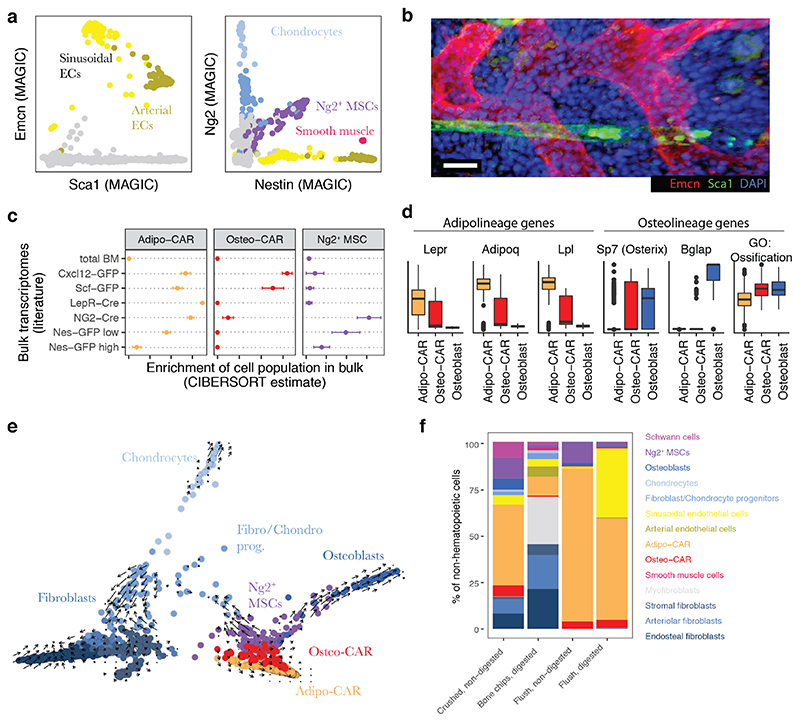
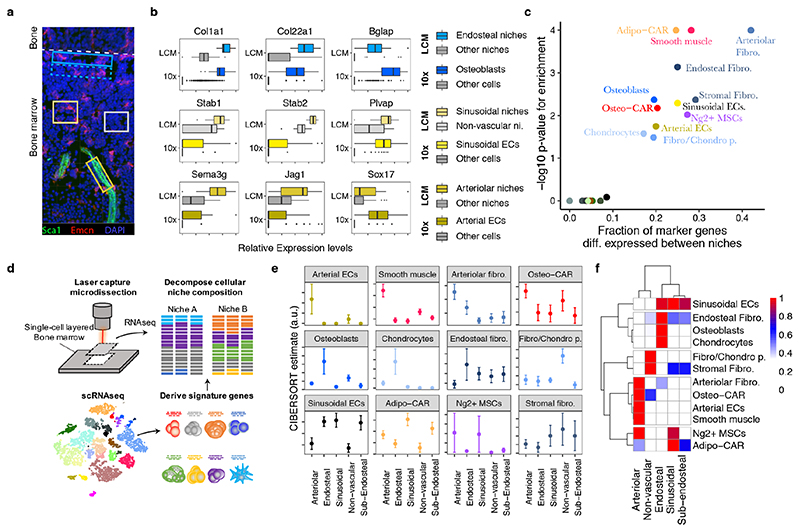
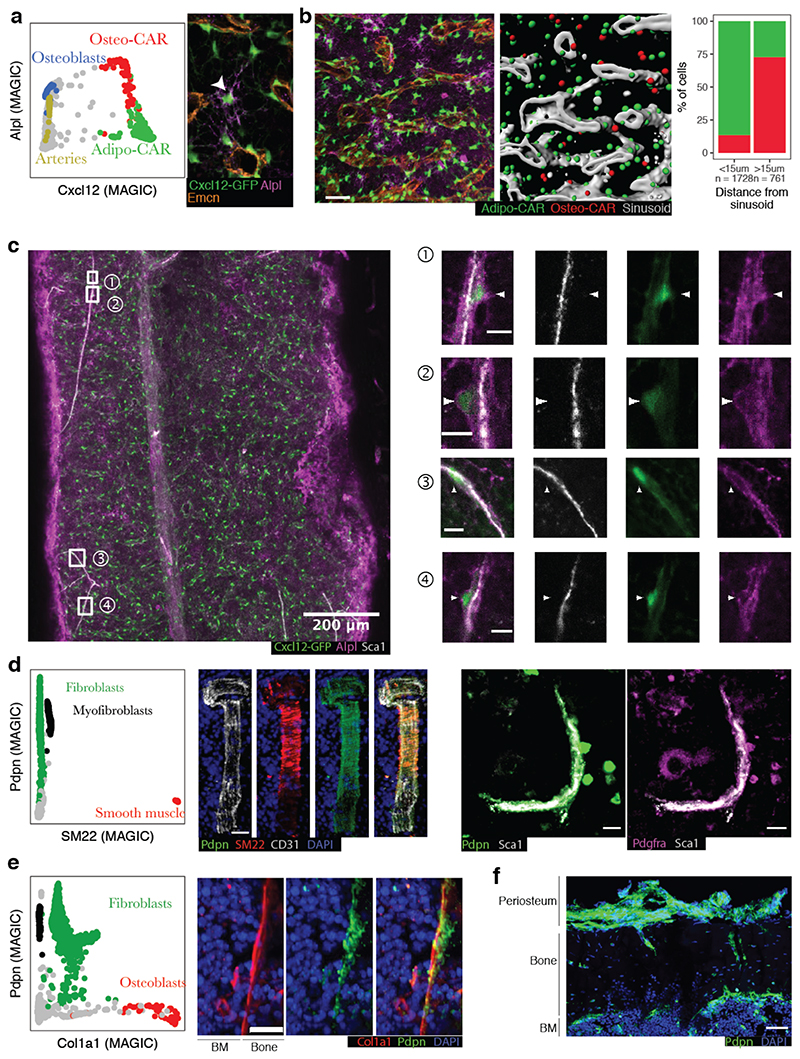
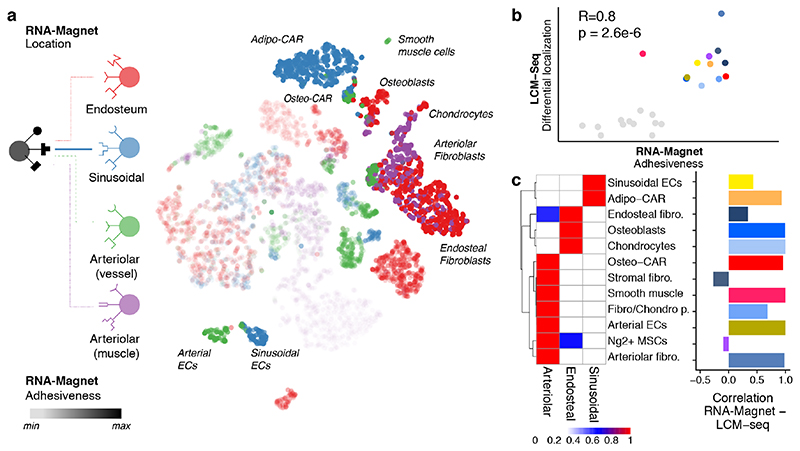
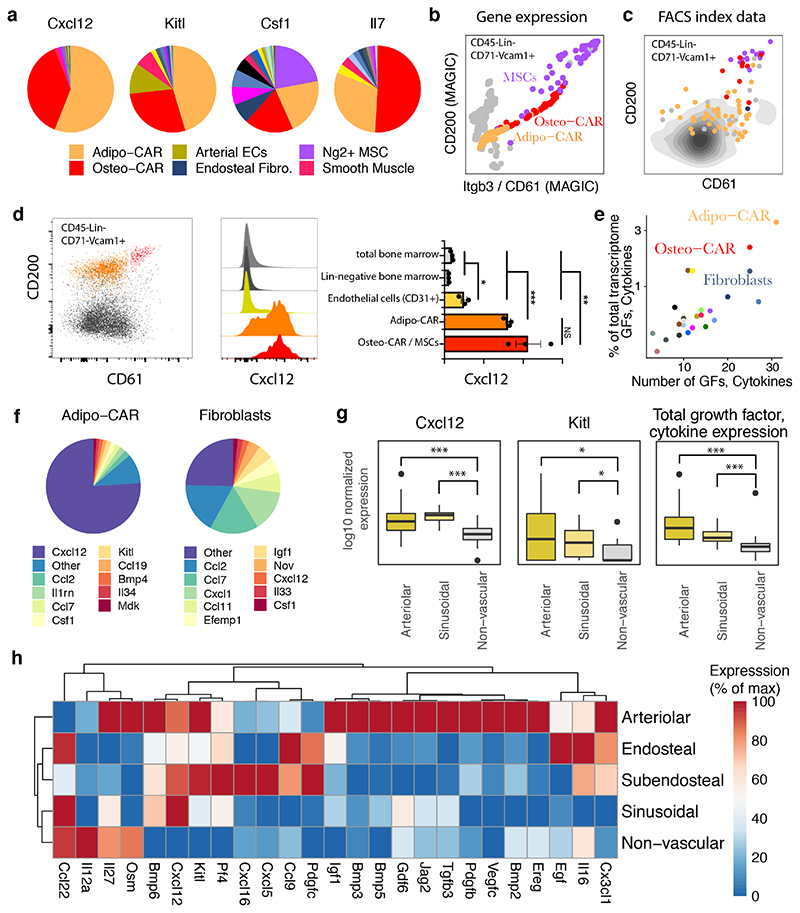
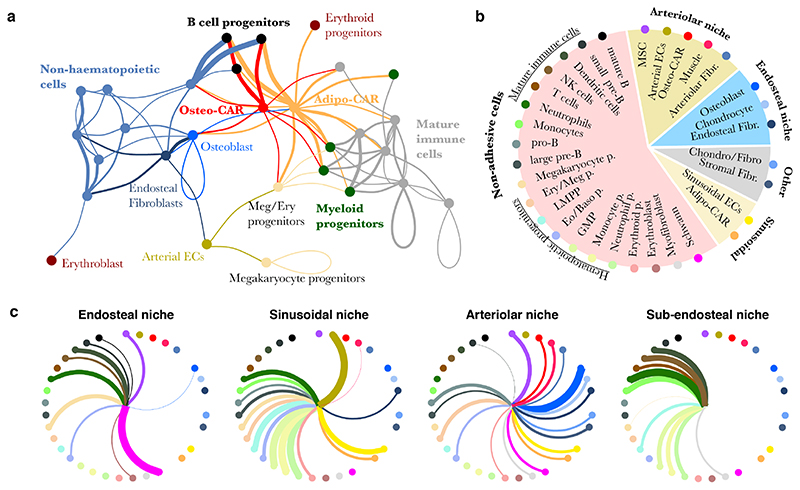
The bone marrow constitutes the primary site for life-long blood production and skeletal regeneration. However, its cellular and spatial organization remains controversial. Here, we combine single-cell and spatially resolved transcriptomics to systematically map the molecular, cellular and spatial composition of distinct bone marrow niches. This allowed us to transcriptionally profile all major bone-marrow-resident cell types, determine their localization and clarify sources of pro-haematopoietic factors. Our data demonstrate that Cxcl12-abundant-reticular (CAR) cell subsets (Adipo-CAR and Osteo-CAR) differentially localize to sinusoidal and arteriolar surfaces, act locally as 'professional cytokine-secreting cells' and thereby establish peri-vascular micro-niches. Importantly, the three-dimensional bone-marrow organization can be accurately inferred from single-cell transcriptome data using the RNA-Magnet algorithm described here. Together, our study reveals the cellular and spatial organization of bone marrow niches and offers a systematic approach to dissect the complex organization of whole organs.


Conflict of interest statement

Competing Interests statement

The authors declare no competing interests.

Figures

Figure 1
Figure 1. Identification of BM resident cell types by scRNA-seq.
a, Overview of the FACS sorting strategy. In total, 5 consecutive single-cell RNA sequencing runs were performed. Right panel: t-SNE projection of all cells with respective experiment colour-coded. b, t-SNE projection of all cells with clusters colour-coded. Abbreviations used: T: T cells, NK: Natural killer cells, s. pre-B: small pre-B cells, l. pre-B: large pre-B cells, DC: Dendritic cells, Prog.: progenitor. * Lin-Kit+Sca1high HSCs reside at the interface of LMPPs and Megakaryocyte progenitors, see also figure S3g.
Figure 2
Figure 2. Characterization of BM resident cell types.
a, Gene expression levels of Sca1, Endomucin (Emcn), Nestin, and Ng2, with relevant populations colour-coded. MAGIC was used for imputation of drop-out values. b, Deep imaging of a BM section immunostained with antibodies against Sca-1 and Emcn. Scale bar = 20 μm. c, Enrichment of gene expression signatures of Ng2+ MSCs, Adipo-CAR and Osteo-CAR cells in previously published transcriptomes of relevant genetically labelled populations,–. See Figure S4b for further populations, and the supplementary note for a detailed evaluation of the algorithm used (CIBERSORT). Error bars indicate the standard error of the mean across n=3 bulk transcriptome samples per class. d, Boxplots of the scaled expression level of selected genes in single cells from the Adipo-CAR, Osteo-CAR and Osteoblast populations. For the right panel, the mean expression of all genes annotated with the gene ontology term ‘ossification’ was computed for each cell. e, Projection of all mesenchymal cell types using PHATE with time derivatives of gene expression state, as determined by RNA velocity, highlighted as arrows. f, Comparison of cell type frequencies between distinct cell isolation methods used for scRNAseq.
Figure 3
Figure 3. Spatial allocation of BM resident cell types by integrated single-cell and spatial transcriptomics.
a, Scheme of experimental design. 12 μm bone sections were stained for arterioles (Sca1) and sinusoids (Emcn), respectively. Areas of approximately 14.500 μm2 surrounding arteries (dark yellow box), sinusoids (yellow box) and the endosteum (blue box), as well as areas with no vessels (grey box) and sub-endosteal areas (dotted blue box) were collected by laser capture dissection and subjected to RNA-seq. A confocal image is shown for illustrative purposes. For images acquired under the laser capture dissection microscope and selected areas see Figure S7b. b, Expression of osteoblast-, sinusoid- and arteriole-specific genes in scRNA-seq data (10x) and spatial transcriptomics from different niches (LCM: LCM-seq data). c, Enrichment of population marker genes (Table S1) among genes with differential expression between niches (Table S2). d, Schematic outline of the computational data analysis strategy used. e,f, Estimated abundance of different cell types in microscopically distinct niches. Error bars indicate standard error of the mean of the estimate across n=11 to n=28 samples per class.
Figure 4
Figure 4. Localization of key mesenchymal cell types by immunofluorescence.
a, Left panel: Single-cell gene expression levels of Cxcl12 and Alpl with relevant cluster identity colour-coded. MAGIC was used to impute drop-out values. Right panel: Sample high-resolution ROI from a whole-mount image of a femur from a Cxcl12-GFP mouse, stained for Alpl and the sinusoidal marker Emcn. An Alpl+Cxcl12-GFP+ cell distant from sinusoids is highlighted by an arrowhead. b, Quantitative analysis of a full whole-mount image, see also Figure S9a. Left panel: Sample ROI, scale bar: 50μm. Central panel: 3D segmentation of the same ROI. Cxcl12-GFP+ cells were classified as Osteo- or Adipo-CAR cells based on the Alpl signal. Right panel: Quantitative assessment of Alpl+ Osteo-CAR cells (red) and Alplneg Adipo-CAR cells (green) between sinusoidal and non-sinusoidal niches in central BM. c, Whole-mount imaging of a femur from a Cxcl12-GFP mouse, stained for Alpl and the arteriolar marker Sca1. Arrowheads point to Alpl+Cxcl12+ cells near, but not overlapping with, Sca1+ arteriolar endothelial cells. Scale bars in ROIs: 10μm. See figure S9b for a second whole-mount image. d, Left panel: Single-cell gene expression levels of SM22 (Tagln) and Pdpn with relevant cluster identity colour-coded. Central panel: Immunofluorescence staining of a BM arteriole stained for SM22, Pdpn and CD31. Right panel: Immunofluorescence staining of a BM arteriole stained for Pdpn, Sca1 and Pdgfra. Scale bar: 20 μm. e, Left panel: Single-cell gene expression levels of Col1a1 and Pdpn with relevant cluster identity colour-coded. Right panel: Immunofluorescence staining of Col1a1, Pdpn and DAPI at the endosteal surface. Scale bar: 20 μm. f, Immunofluorescence staining of Pdpn at the endoestum, cortical bone and periosteum.
Figure 5
Figure 5. Inference of cellular interactions from single-cell gene expression data by RNA-Magnet.
a, t-SNE highlighting the cell type each single cell is most likely to physically interact with (RNA-Magnet: Location, indicated by colour), and the estimated strength of adhesion (RNA-Magnet: Adhesiveness, indicated by opacity). b, Scatter plot comparing the estimated strength of adhesion (RNA-Magnet score) to the degree to which each cell type is differentially localised between niches (spatial transcriptomics, see also Figure 3c). c, Left panel: Heatmap depicting a summary of inferred localisation based on RNA-Magnet. Fraction of cells assigned to a certain niche is colour-coded. Right panel: Bar chart indicating the correlation between the RNA-Magnet estimate of localization and the LCM-seq estimate of localization.
Figure 6
Figure 6. Cellular and spatial sources of key cytokines in the bone marrow.
a, Contribution of cell types to distinct cytokine pools. Mean gene expression across all cells constituting each cell type is compared. b, Single-cell gene expression levels of Cd200 and Itgb3 (CD61) from 10x genomics data in CD45negLinnegCD71negVcam1+ cells. MAGIC was used to impute drop-out values. Relevant populations are colour-coded. c, Surface marker levels of CD200 and CD61 from indexed scRNAseq data in CD45negLinnegCD71negVcam1+ cells. FACS index values for n=91 cells subjected to indexed scRNAseq (see methods). The colour indicates the most similar cell type from the main data set as identified by scmap. d, Intra-cellular FACS analyses of Cxcl12 expression in total BM, lineage-negative BM, Lin-CD31+ endothelial cells and CD61/CD200 subpopulations of CD45negLinnegCD71negCD51+Vcam1+ CAR cells. Statistics were performed using an unpaired t test. ***: p < 0.001, **: p<0.01*,: p<0.05 e, Quantification of the number of growth factors (GFs) and cytokines expressed by each cell type, and the fraction of total mRNA devoted to producing growth factors and cytokines. For a list of growth factors and cytokines used, see Table S3. f, Relative expression of cytokines and growth factors in Adipo-CAR cells and Fibroblasts. g, Expression of Cxcl12, Kitl, and summed expression of all cytokines and growth factors in arteriolar, sinusoidal and non-vascular niches from spatial transcriptomics data. P-values for differential expression relative to non-vascular niches are from limma/voom (Cxcl12, Kitl) or a Wilcoxon ranksum test (sum); ***: p < 0.001, *: p<0.05. h, Expression of cytokines, chemokines and growth factors in the different niches measured by LCM-seq. Only factors with significant differences between niches are included.
Figure 7
Figure 7. Systems-level analysis of signaling potential in the BM.
a, Inference of signaling interactions between cell types by RNA-Magnet. If a cell type is enriched in expression of ligands for receptors expressed by a second cell type, a line is drawn between these cell types, with colour indicating the ligand-producing cell type and line width indicating the strength of enrichment. For details, see methods and figure S9e for a fully labelled version of the figure. b, Summary of niche composition, as estimated from LCM-seq (see also figure 3f). c, Inference of signalling interactions between niches and cell types. Line width indicates the strength of enrichment for expression of ligand-receptors pairs. Cell types are arranged as in subfigure b.

Comment in

  • Unraveling bone marrow architecture.
    Lucas D, Salomonis N, Grimes HL. Lucas D, et al. Nat Cell Biol. 2020 Jan;22(1):5-6. doi: 10.1038/s41556-019-0447-6. Nat Cell Biol. 2020. PMID: 31871318 No abstract available.

References

    1. Ramasamy SK, et al. Regulation of Hematopoiesis and Osteogenesis by Blood Vessel-Derived Signals. Annu Rev Cell Dev Biol. 2016;32:649–675. - PubMed
    1. Morrison SJ, Scadden DT. The bone marrow niche for haematopoietic stem cells. Nature. 2014;505:327–334. - PMC - PubMed
    1. Wei Q, Frenette PS. Niches for Hematopoietic Stem Cells and Their Progeny. Immunity. 2018;48:632–648. - PMC - PubMed
    1. Sugiyama T, Kohara H, Noda M, Nagasawa T. Maintenance of the hematopoietic stem cell pool by CXCL12-CXCR4 chemokine signaling in bone marrow stromal cell niches. Immunity. 2006;25:977–88. - PubMed
    1. Ding L, Saunders TL, Enikolopov G, Morrison SJ. Endothelial and perivascular cells maintain haematopoietic stem cells. Nature. 2012;481:457–62. - PMC - PubMed

Publication types

MeSH terms