. 2019 Dec 13:4:55.
doi: 10.1038/s41392-019-0081-6. eCollection 2019.

Integrative analysis of DNA methylation and gene expression identified cervical cancer-specific diagnostic biomarkers

Affiliations

Integrative analysis of DNA methylation and gene expression identified cervical cancer-specific diagnostic biomarkers

Wanxue Xu et al. Signal Transduct Target Ther. .

Abstract

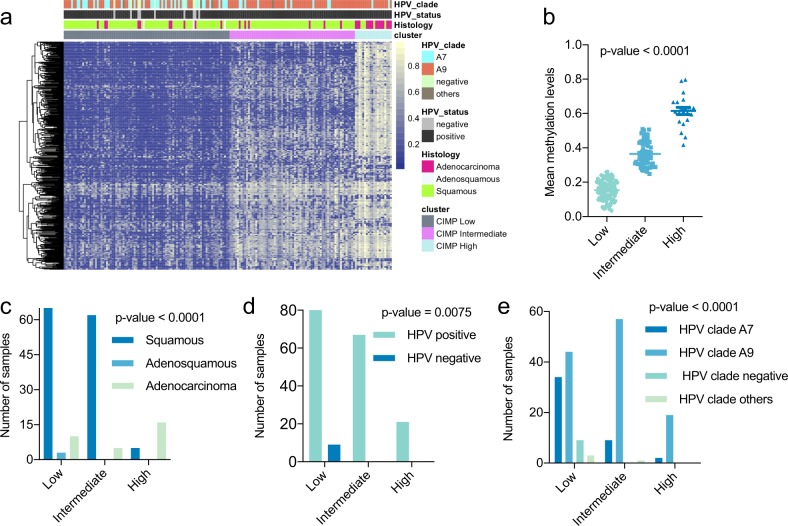
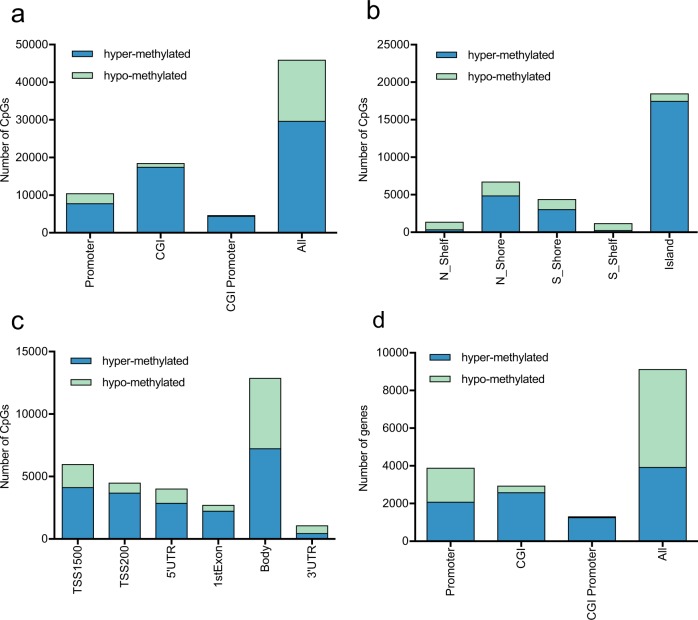
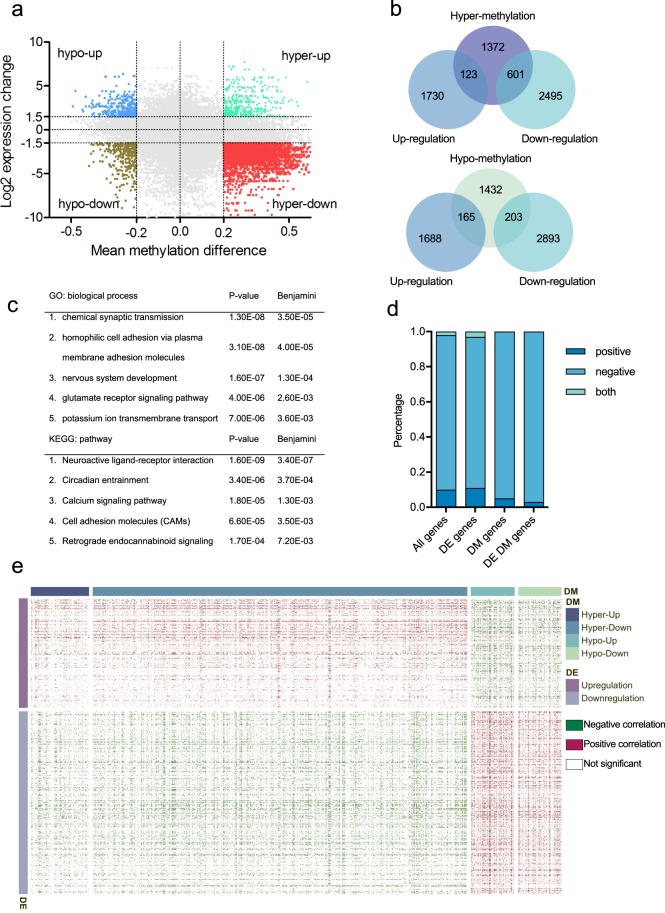
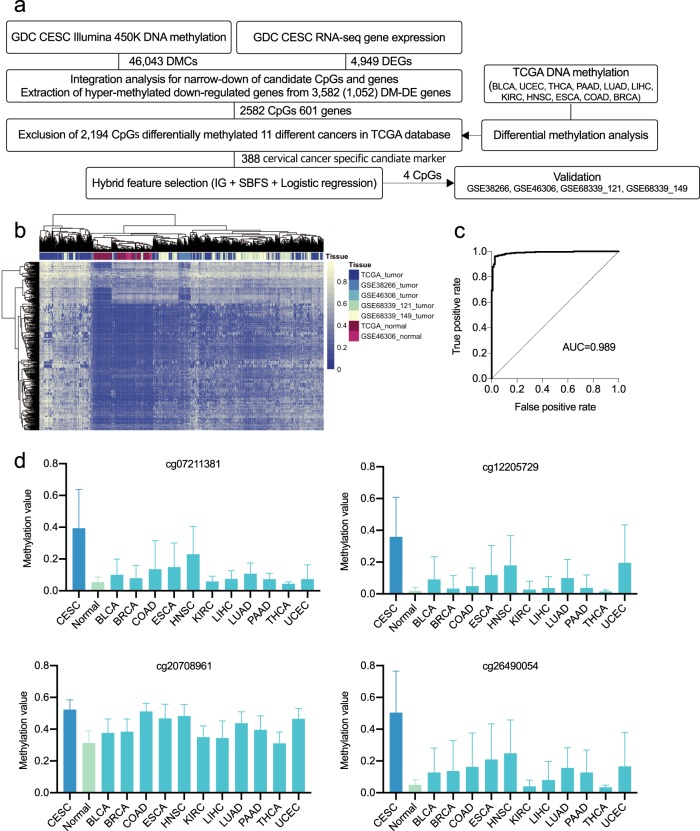
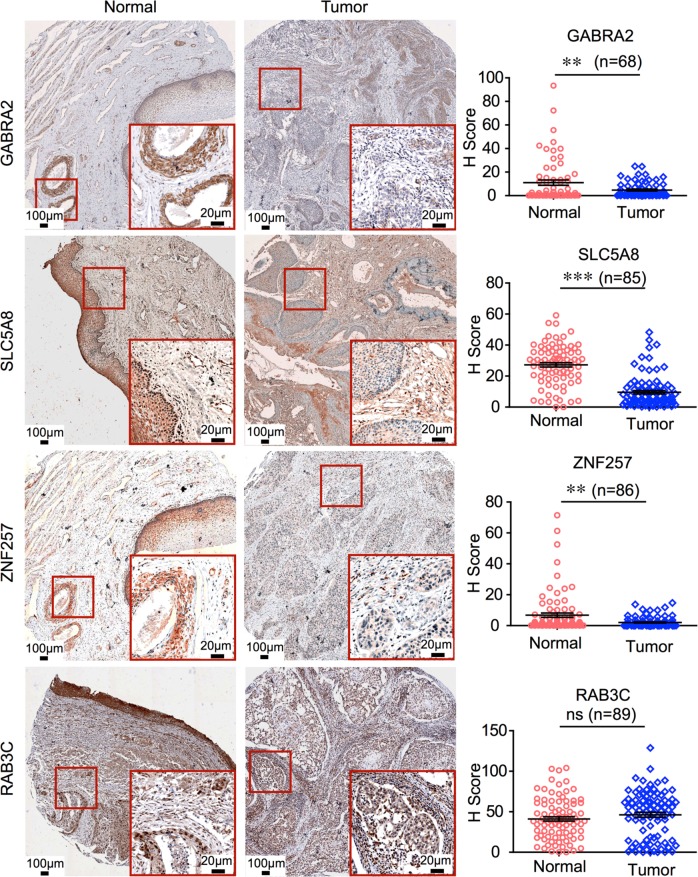
Cervical cancer is the leading cause of death among women with cancer worldwide. Here, we performed an integrative analysis of Illumina HumanMethylation450K and RNA-seq data from TCGA to identify cervical cancer-specific DNA methylation markers. We first identified differentially methylated and expressed genes and examined the correlation between DNA methylation and gene expression. The DNA methylation profiles of 12 types of cancers, including cervical cancer, were used to generate a candidate set, and machine-learning techniques were adopted to define the final cervical cancer-specific markers in the candidate set. Then, we assessed the protein levels of marker genes by immunohistochemistry by using tissue arrays containing 93 human cervical squamous cell carcinoma samples and cancer-adjacent normal tissues. Promoter methylation was negatively correlated with the local regulation of gene expression. In the distant regulation of gene expression, the methylation of hypermethylated genes was more likely to be negatively correlated with gene expression, while the methylation of hypomethylated genes was more likely to be positively correlated with gene expression. Moreover, we identified four cervical cancer-specific methylation markers, cg07211381 (RAB3C), cg12205729 (GABRA2), cg20708961 (ZNF257), and cg26490054 (SLC5A8), with 96.2% sensitivity and 95.2% specificity by using the tenfold cross-validation of TCGA data. The four markers could distinguish tumors from normal tissues with a 94.2, 100, 100, and 100% AUC in four independent validation sets from the GEO database. Overall, our study demonstrates the potential use of methylation markers in cervical cancer diagnosis and may boost the development of new epigenetic therapies.

Keywords: Genome informatics; Tumour biomarkers.


Conflict of interest statement

Competing interestsThe authors declare no competing interests.

Figures

Fig. 1
Fig. 1
The DNA methylation landscape of cervical carcinoma. a Unsupervised clustering of methylation levels in cervical cancer. Samples are presented in columns, and the 591 most variable CpG loci (mean methylation level β < 0.05 in normal samples and a standard deviation σ > 0.20 in tumor samples) are presented in rows. The three identified clusters were denoted as CIMP-high (n = 20, CpG island methylator phenotype), CIMP-intermediate (n = 69), and CIMP-low (n = 89). Primary tumor features significantly associated across the three clusters (Fisher’s exact test p-value <0.001) are indicated at the top of the heat map. b Differences (p-value < 0.0001) in the methylation levels of the three consensus clusters. The CIMP-high group exhibited significant hypermethylation compared with the other groups. ce The sample distributions in terms of HPV status, histology, and HPV clade in the three clusters are presented in ce, respectively
Fig. 2
Fig. 2
The number of hypo- and hypermethylated CpGs and genes. a Distribution of DMCs in different genomic locations, including promoters (1500 bp upstream of TSSs), CpG islands (CGI), promoters within CpG islands (CGI promoter), and the whole genomic region (all). b Distribution of DMCs in different regions related to CGIs, including CpG islands, CpG shores, and CpG shelves. c Distribution of DMCs across gene regions (TSS1500, TSS200, 5′ UTRs, first exons, gene bodies, and 3′ UTRs). d Distribution of DEGs in different genomic locations
Fig. 3
Fig. 3
Integrative analysis of DNA methylation and gene expression. a Scatter plot of mean methylation difference versus log2 expression change. Each point represents a CpG-gene pair. b Venn diagrams summarizing the intersection between hypermethylated genes and DEGs (top) and between hypomethylated genes and DEGs (bottom). A gene was considered to be differentially methylated if there was at least one DMC in its promoter region. c Representative gene ontology (GO) terms and Kyoto Encyclopedia of Genes and Genomes (KEGG) pathways enriched in hyper–down genes. The functional annotation analysis was conducted by using DAVID, and the top five biological processes and pathways are reported with their p-values and Benjamini–Hochberg values. d Correlation between DNA methylation and gene expression (local regulation). Pearson’s correlation coefficient was calculated for all genes, DEGs, DMGs, and differentially expressed and methylated genes. The cutoffs for a significant correlation were γ| >0.3 and an adjusted p-value < 0.05. e Correlation between DNA methylation and gene expression (distant regulation). The Pearson correlation was calculated between 1092 CpGs in differentially expressed and methylated genes and 4949 DEGs
Fig. 4
Fig. 4
Identification of cervical cancer-specific biomarkers. a The workflow used to identify cervical cancer-specific methylation markers (GDC: Genomic Data Commons; CESC: cervical squamous cell carcinoma and endocervical adenocarcinoma). b Hierarchical clustering of the 388 candidate CpGs in samples from TCGA, GSE38266, GSE46306, and GSE68339. c Receiver-operating characteristic (ROC) curve and AUC values for TCGA data with tenfold cross-validation. d The distribution of the methylation levels for the four final selected markers in TCGA data of cervical tumors, normal tissues, and other cancers
Fig. 5
Fig. 5
GABRA2, SLC5A8, and ZNF257 are weakly expressed in human cervical squamous cell carcinoma (CSCC). IHC staining of the indicated proteins in a human CSCC tissue array containing 93 intact cancer tissues and paired normal adjacent tissues. Representative images are shown in the left panels. Magnified images are shown in red boxes. The H-score-based quantification results are shown in the right panels. **p < 0.01, ***p < 0.001, Student’s t test

References

    1. Network CGAR. Integrated genomic and molecular characterization of cervical cancer. Nature. 2017;543:378. doi: 10.1038/nature21386. - DOI - PMC - PubMed
    1. Bray F, et al. Global cancer statistics 2018: GLOBOCAN estimates of incidence and mortality worldwide for 36 cancers in 185 countries. CA Cancer J. Clin. 2018;68:394–424. doi: 10.3322/caac.21492. - DOI - PubMed
    1. Murillo R, Herrero R, Sierra MS, Forman D. Cervical cancer in Central and South America: burden of disease and status of disease control. Cancer Epidemiol. 2016;44:S121–S130. doi: 10.1016/j.canep.2016.07.015. - DOI - PubMed
    1. Kloth JN, et al. Combined array-comparative genomic hybridization and single-nucleotide polymorphism-loss of heterozygosity analysis reveals complex genetic alterations in cervical cancer. BMC Genomics. 2007;8:53. doi: 10.1186/1471-2164-8-53. - DOI - PMC - PubMed
    1. Rusan M, Li YY, Hammerman PS. Genomic landscape of human papillomavirus–associated cancers. Clin. Cancer Res. 2015;21:2009–2019. doi: 10.1158/1078-0432.CCR-14-1101. - DOI - PMC - PubMed

Publication types