Review
. 2019 Oct 31:16:100146.
doi: 10.1016/j.pacs.2019.100146. eCollection 2019 Dec.

Minimally invasive photoacoustic imaging: Current status and future perspectives

Affiliations
Review

Minimally invasive photoacoustic imaging: Current status and future perspectives

Tianrui Zhao et al. Photoacoustics. .

Abstract

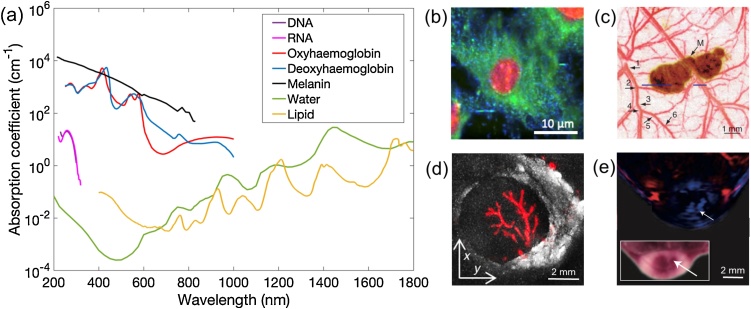
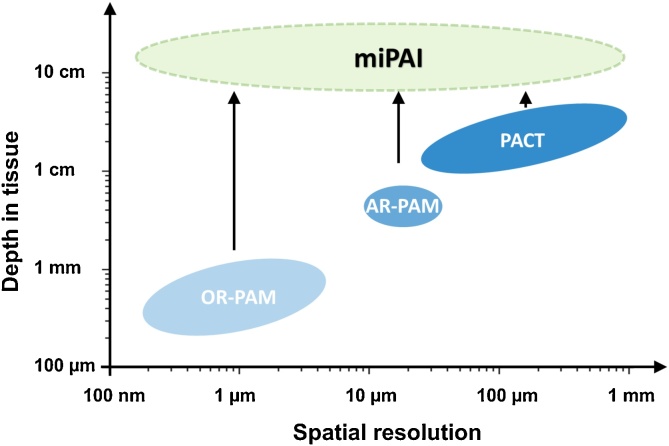
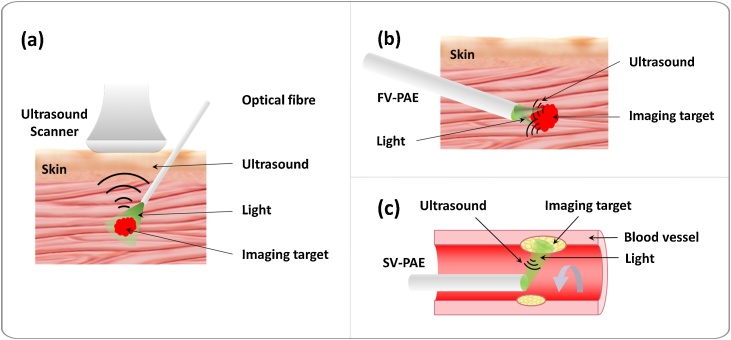
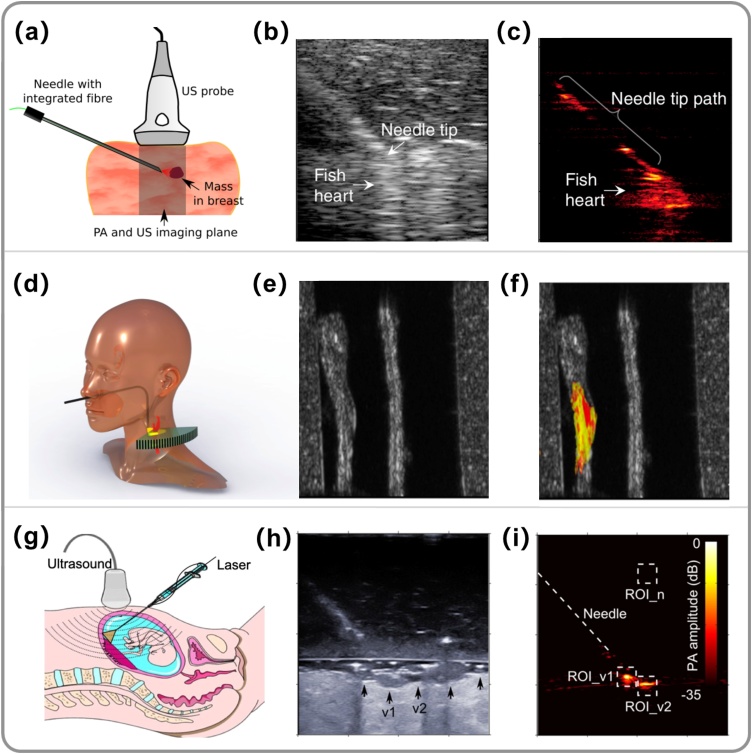
Photoacoustic imaging (PAI) is an emerging biomedical imaging modality that is based on optical absorption contrast, capable of revealing distinct spectroscopic signatures of tissue at high spatial resolution and large imaging depths. However, clinical applications of conventional non-invasive PAI systems have been restricted to examinations of tissues at depths less than a few cm due to strong light attenuation. Minimally invasive photoacoustic imaging (miPAI) has greatly extended the landscape of PAI by delivering excitation light within tissue through miniature fibre-optic probes. In the past decade, various miPAI systems have been developed with demonstrated applicability in several clinical fields. In this article, we present an overview of the current status of miPAI and our thoughts on future perspectives.

Keywords: Interventional photoacoustic imaging; Minimally invasive procedures; Multi-modal imaging; Photoacoustic computed tomography; Photoacoustic endoscopy; Photoacoustic imaging; Photoacoustic microscopy.


Conflict of interest statement

The authors declare that there are no conflicts of interest. A.E.D. is a Director and Shareholder of Echopoint Medical, London, UK, and T.V. holds shares from Mauna Kea Technologies, Paris, France, which, however, did not support this work.

Figures

Fig. 1
Fig. 1
Endogenous tissue chromophores in photoacoustic imaging. (a) Optical absorption spectra of the main tissue chromophores, including DNA (data adapted from [20]), RNA (data adapted from [22]), oxyhaemoglobin, deoxyhaemoglobin (150 g L−1), melanin (data from https://omlc.org/spectra/), water and lipid (data adapted from [18]). (b) Ultraviolet localised photoacoustic (PA) image of a fibroblast cell with lipids, protein and nucleic acids contents shown in pseudo-coloured blue, green and red, respectively. This image was adapted from Ref [21] with permission. (c) PA image of a melanoma mouse model in vivo. Melanoma (pseudo-coloured brown) visualised with 784 nm excitation was surrounded by microvasculature (pseudo-coloured red) visualised at 584 nm with six orders of vessel branching. M, Melanoma. This image was adapted from Ref. [15] with permission. (d) PA image of a human lymph node with lipid (grayscale) and haemoglobin (pseudo-coloured red) contrast with optical excitation at 1210 nm and 530 nm, respectively. This image was adapted from Ref. [26] with permission. (e) Multispectral PAI of a mouse tumour model. Oxyhaemoglobin and deoxyhaemoglobin distributions were pseudo-coloured in red and blue, respectively. White arrows indicated the region of a tumour core with a low level of blood oxygen concentration. Inset is a photograph of the corresponding cross-section of the imaged tumour region. This image was adapted from Ref. [6] with permission.
Fig. 2
Fig. 2
Spatial resolution versus depth of examinations for conventional and minimally invasive photoacoustic imaging (miPAI) techniques. OR-PAM, optical resolution-photoacoustic microscopy; AR-PAM, acoustic resolution-photoacoustic microscopy; PACT, photoacoustic computed tomography. For simplicity purposes, the spatial resolution of OR-RAM only represents the lateral resolution. With excitation light delivered within tissue through miniature fibre-optic probes, miPAI greatly extended the depths of examinations of conventional non-invasive photoacoustic imaging modalities including OR-PAM, AR-PAM and PACT.
Fig. 3
Fig. 3
Schematic illustrations of the three embodiments of minimally invasive photoacoustic imaging (miPAI) techniques including (a) Interventional photoacoustic imaging (iPAI), (b) Forward-viewing photoacoustic endoscopy (FV-PAE), and (c) Side-viewing photoacoustic endoscopy (SV-PAE).
Fig. 4
Fig. 4
Embodiments of interventional photoacoustic imaging (iPAI) systems and their targeted clinical applications. (a) Schematic diagram of an iPAI system for guiding breast biopsy, in which the excitation light (1064 nm) was delivered through an optical fibre embedded in a breast biopsy needle and photoacoustic (PA) signals were detected by a clinical ultrasound imaging probe. To demonstrate the concept, (b) Ultrasound (US) and (c) PA images were obtained during needle insertions towards a tumour-mimicking target (fish heart). (b)-(c) were adapted from Ref. [62] with permission. (d) Schematic diagram of an iPAI system for the diagnosis of carotid artery atherosclerosis. Excitation light was proposed to be delivered transnasally via a side-firing optical fibre to illuminate the carotid artery in the pharynx cavity, while US detection used an external linear array transducer placed at the neck side. The system was validated with an ex vivo diseased human carotid artery embedded in a neck phantom. Co-registered grayscale US (e) and colour-coded PA (f) images demonstrated complementary information, with US visualising anatomical structure and PA revealing the lipid composition of the plaque. (d)-(f) were adapted from Ref. [81] with permission. (g) Schematic diagram of a multispectral iPAI system for guiding the treatment of twin-to-twin transfusion syndrome, in which the light was delivered through the working channel of a fetoscope via an optical fibre to visualise the placenta vasculature. US detection was performed by an external linear array US probe at the abdomen. This concept was demonstrated with a freshly excised human twin placenta. An agar block was placed between the US probe and the placenta to mimic the ammonitic fluid. US images (h) revealed the anatomical structure of the placenta; a few surface blood vessels were barely visible. In contrast, PA images (i) clearly visualised two blood vessels (v1 and v2) under illumination. (h)-(i) were adapted from Ref. [63] with permission.
Fig. 5
Fig. 5
Embodiments of forward-viewing photoacoustic endoscopy (PAE) systems. (a) Schematic diagram of an optical-resolution PAE system based on a multi-core coherent fibre bundle and 2D galvanometer mirrors. Excitation light was focused at the proximal end of the fibre bundle and raster-scanned by the galvanometer mirrors for photoacoustic (PA) excitation. M, mirror; GS, glass; PD, photodiode; C1, C2, controllers; DX, DY, X and Y axis mirror drivers; OL, objective lens. (b) PA image of carbon fibre network. (c) PA image of the microvascular of a mouse ear. (a)-(c) were adapted from Ref. [65] with permission. (d) Schematic diagram of an optical-resolution PAE system based on a multimode optical fibre and a spatial light modulator (SLM). After calibration, the SLM modulated the incident light field to focus light through the multimode fibre for PA excitation. CMOS, complementary metal oxide semiconductor camera; BS1, beam splitter; L1, tube lens; OBJ, objective. (e) White light optical image and (f) PA image of a wire knot. (d)-(f) were adapted from Ref. [67] with permission. (g) Schematic diagram of an optical-resolution PAE system based on a multimode optical fibre and speckle illuminations. Pre-recorded speckle patterns were generated by a digital micro-mirror device at the distal end of the fibre for PA excitation. A model-based algorithm was used for image reconstruction. f1, tube lens; SMF, single-mode fibre; MMF, multimode fibre; CMOS, complementary metal oxide semiconductor camera. (h) Bright-field microscopy and (i) PA images of an absorbing micro-structure. Scale bar, 30 μm. (g)-(i) were adapted from Ref. [92] with permission. (j) Schematic diagram of an acoustic-resolution PAE system that is based on a multi-core coherent fibre bundle with a Fabry-Pérot (FP) cavity at its distal end to serve as a 2D array of ultrasound detectors. (k-l) PA images of the mouse abdominal skin microvasculature. (j)-(l) were adapted from Ref. [66] with permission.
Fig. 6
Fig. 6
Schematic diagrams of embodiments of side-viewing photoacoustic endoscopy (PAE) probes. (a) An acoustic-resolution PAE probe with a colinear design. A ring-shaped ultrasound (US) transducer was integrated with an optical fibre, and a mirror was placed in front of the fibre to deflect both light and US. This image was adapted from Ref. [57] with permission. (b) An acoustic-resolution PAE probe with a non-colinear design. The distal end of a multimode fibre was angle-polished at 34° for side-way illuminations, and an US transducer was placed in front of the fibre tip facing the illuminated region. AWG, Arbitrary wave generator; DAQ, data acquisition, exp, expander; lim, limiter; bpf, bandpass filter, and amp, amplifier. This image was adapted from Ref. [56] with permission. (c) An acoustic-resolution PAE probe with a compact colinear design. The distal end of a multimode fibre was polished to 47° to deflect generated photoacoustic signals to an US transducer. This image was adapted from Ref. [104] with permission. (d) An optical-resolution PAE probe with a compact colinear design and a micro-ring resonator US detector. This image was adapted from Ref. [109] with permission.
Fig. 7
Fig. 7
Multimodal endoscopy. (a-d) Tri-modal photoacoustic (PA), ultrasound (US), optical coherence tomography (OCT) imaging of a human artery. (a) PA; (b) US; (c) OCT, and (d) overlay. (a)-(d) was adapted from Ref. [116] with permission. (e) PA image of a mouse ear. (f) Co-registered PA and fluorescence image of a mouse ear at the same location with (e). (e)-(f) was adapted from Ref. [87] with permission. (g) PA image of a rabbit rectum. The blood oxygen saturation in two regions (dash boxes) are shown in corresponding hyperspectral images in (h) and (i). (g)-(i) was adapted from Ref. [118] with permission.
Fig. 8
Fig. 8
Embodiments of potential clinical applications of photoacoustic endoscopy (PAE) systems. (a-c) Cross-sectional ultrasound (US), photoacoustic (PA), and PA and US overlay images of a swine coronary artery in vivo. PAI clearly visualised a lipid core (in yellow circle). (a)-(c) was adapted from Ref. [126] with permission. (d-f) Cross-sectional US, PA, and PA and US overlay images of a vascular stent of rabbit thoracic artery in vivo. (d)-(f) was adapted from Ref. [127] with permission. (g) co-registered 3D PA (red) and US (green) image of a rat colon. The dotted arrows marked mesenteric tissue entangled around the tract. SP, sphincter. Horizontal scale bar, 1 cm; vertical scale bar, 5 mm. (h) functional image of the blood oxygen saturation level from the inside of the colon shown in (g). (g)-(h) was adapted from Ref. [57] with permission.

References

    1. Beard P. Biomedical photoacoustic imaging. Interface Focus. 2011;1:602–631. - PMC - PubMed
    1. Omar M., Aguirre J., Ntziachristos V. Optoacoustic mesoscopy for biomedicine. Nat. Biomed. Eng. 2019;(April (15)):1. - PubMed
    1. Wang L.V. Multiscale photoacoustic microscopy and computed tomography. Nat. Photon. 2009;3:503–509. - PMC - PubMed
    1. Zhou Y., Yao J., Wang L.V. Tutorial on photoacoustic tomography. J. Biomed. Opt. 2016;21 - PMC - PubMed
    1. Ntziachristos V. Going deeper than microscopy: the optical imaging frontier in biology. Nat. Methods. 2010;7:603–614. - PubMed

LinkOut - more resources