

Gene Expression Meta-Analysis Reveals Concordance in Gene Activation, Pathway, and Cell-Type Enrichment in Dermatomyositis Target Tissues
- PMID: 31872188
- PMCID: PMC6917332
- DOI: 10.1002/acr2.11081
Gene Expression Meta-Analysis Reveals Concordance in Gene Activation, Pathway, and Cell-Type Enrichment in Dermatomyositis Target Tissues
Erratum in
-
Erratum.ACR Open Rheumatol. 2020 Nov;2(11):690-693. doi: 10.1002/acr2.11201. ACR Open Rheumatol. 2020. PMID: 33205609 Free PMC article. No abstract available.
Abstract
Objective: We conducted a comprehensive gene expression meta-analysis in dermatomyositis (DM) muscle and skin tissues to identify shared disease-relevant genes and pathways across tissues.
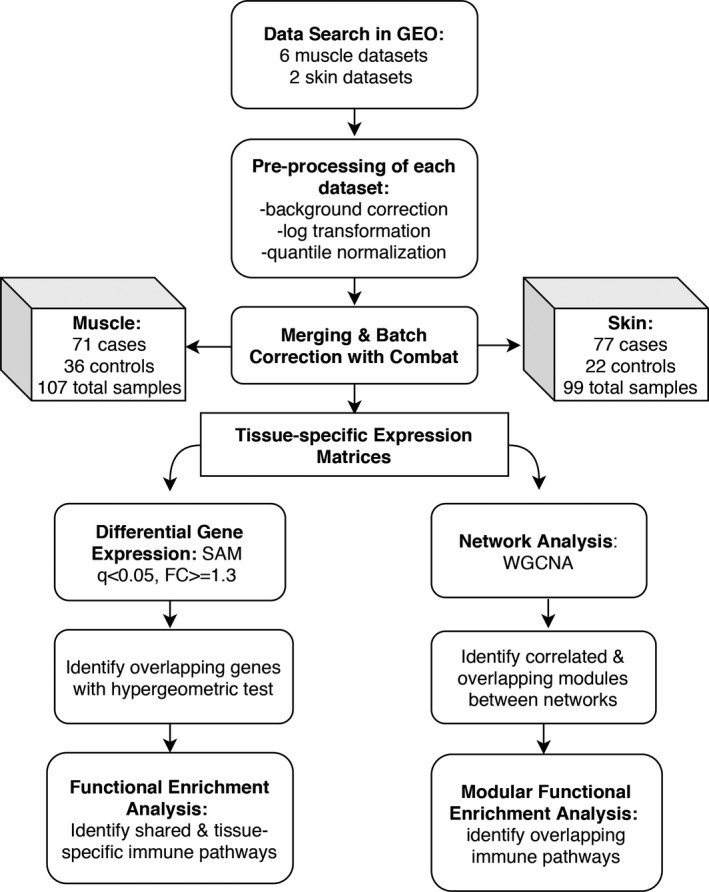
Methods: Six publicly available data sets from DM muscle and two from skin were identified. Meta-analysis was performed by first processing data sets individually then cross-study normalization and merging creating tissue-specific gene expression matrices for subsequent analysis. Complementary single-gene and network analyses using Significance Analysis of Microarrays (SAM) and Weighted Gene Co-expression Network Analysis (WGCNA) were conducted to identify genes significantly associated with DM. Cell-type enrichment was performed using xCell.
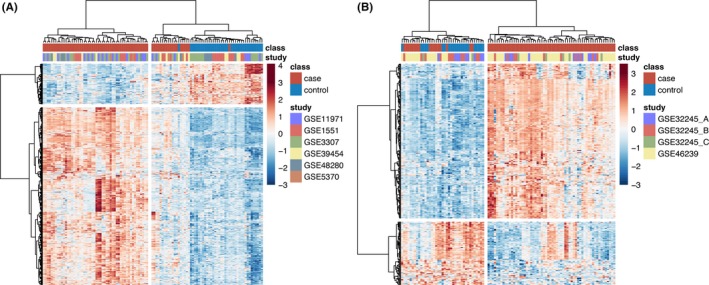
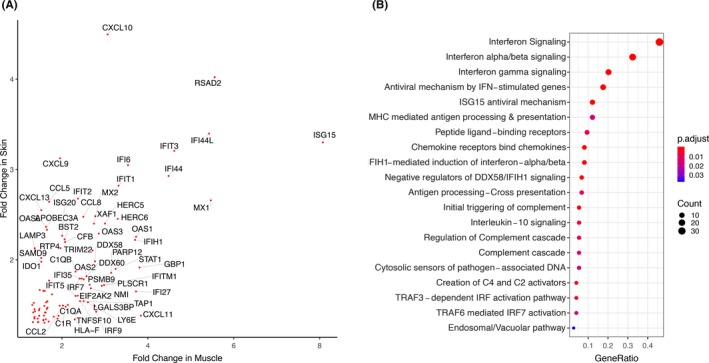
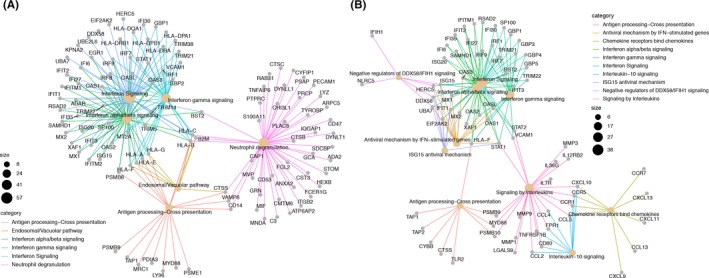
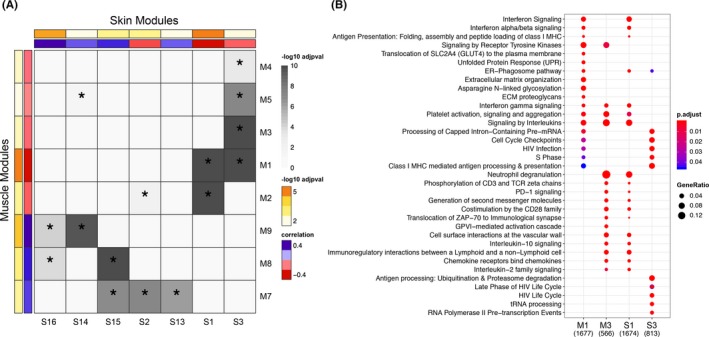
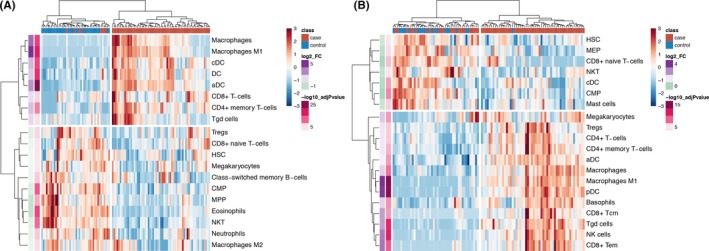
Results: There were 544 differentially expressed genes (FC ≥ 1.3, q < 0.05) in muscle and 300 in skin. There were 94 shared upregulated genes across tissues enriched in type I and II interferon (IFN) signaling and major histocompatibility complex (MHC) class I antigen-processing pathways. In a network analysis, we identified eight significant gene modules in muscle and seven in skin. The most highly correlated modules were enriched in pathways consistent with the single-gene analysis. Additional pathways uncovered by WGCNA included T-cell activation and T-cell receptor signaling. In the cell-type enrichment analysis, both tissues were highly enriched in activated dendritic cells and M1 macrophages.
Conclusion: There is striking similarity in gene expression across DM target tissues with enrichment of type I and II IFN pathways, MHC class I antigen-processing, T-cell activation, and antigen-presenting cells. These results suggest IFN-γ may contribute to the global IFN signature in DM, and altered auto-antigen presentation through the class I MHC pathway may be important in disease pathogenesis.
© 2019 The Authors. ACR Open Rheumatology published by Wiley Periodicals, Inc. on behalf of American College of Rheumatology.
Figures
References
-
- Greenberg SA, Pinkus JL, Pinkus GS, Burleson T, Sanoudou D, Tawil R, et al. Interferon‐α/β‐mediated innate immune mechanisms in dermatomyositis. Ann Neurol 2005;57:664–78. - PubMed
-
- Greenberg SA, Higgs BW, Morehouse C, Walsh RJ, Kong SW, Brohawn P, et al. Relationship between disease activity and type 1 interferon‐ and other cytokine‐inducible gene expression in blood in dermatomyositis and polymyositis. Genes Immun 2012;13:207–13. - PubMed
-
- Huard C, Gullà SV, Bennett DV, Coyle AJ, Vleugels RA, Greenberg SA. Correlation of cutaneous disease activity with type 1 interferon gene signature and interferon β in dermatomyositis. Br J Dermatol 2017;176:1224–30. - PubMed
Grants and funding
LinkOut - more resources
Full Text Sources
Research Materials
