. 2019 Dec 24:8:e50793.
doi: 10.7554/eLife.50793.

Unstructured regions in IRE1α specify BiP-mediated destabilisation of the luminal domain dimer and repression of the UPR

Affiliations

Unstructured regions in IRE1α specify BiP-mediated destabilisation of the luminal domain dimer and repression of the UPR

Niko Amin-Wetzel et al. Elife. .

Abstract

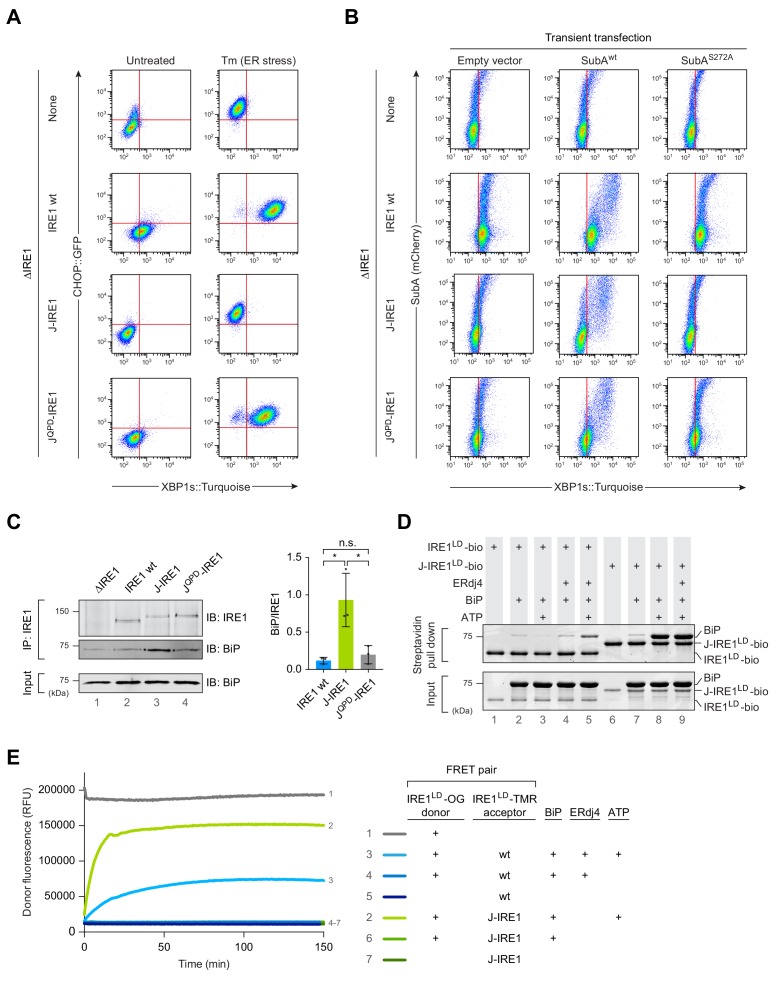
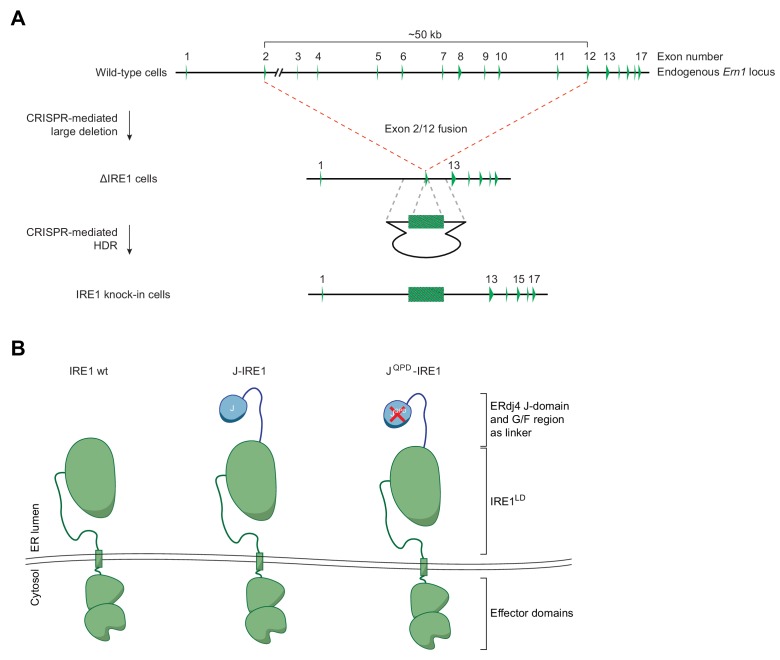
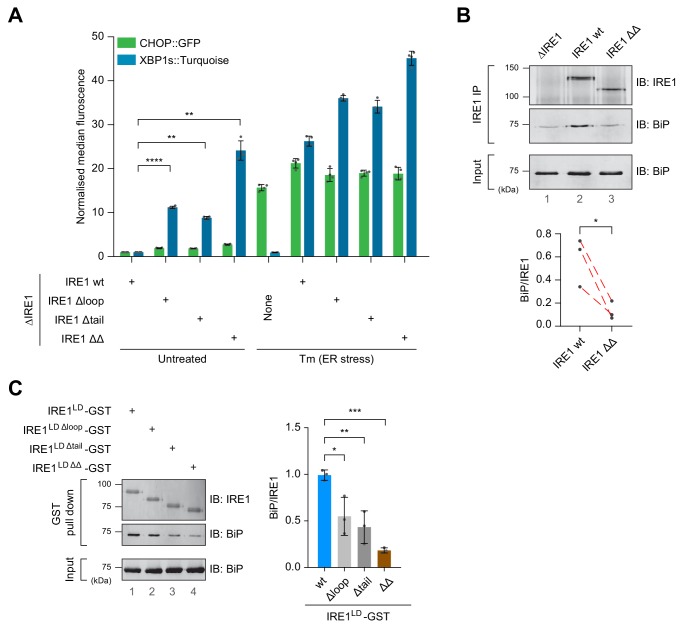
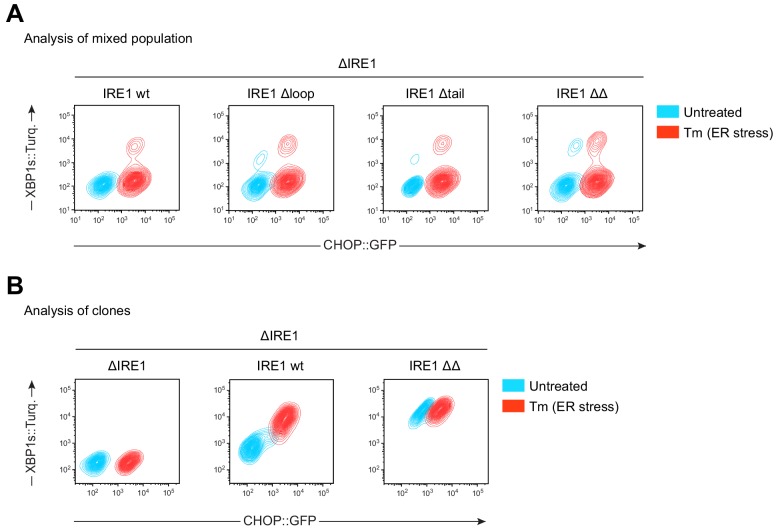
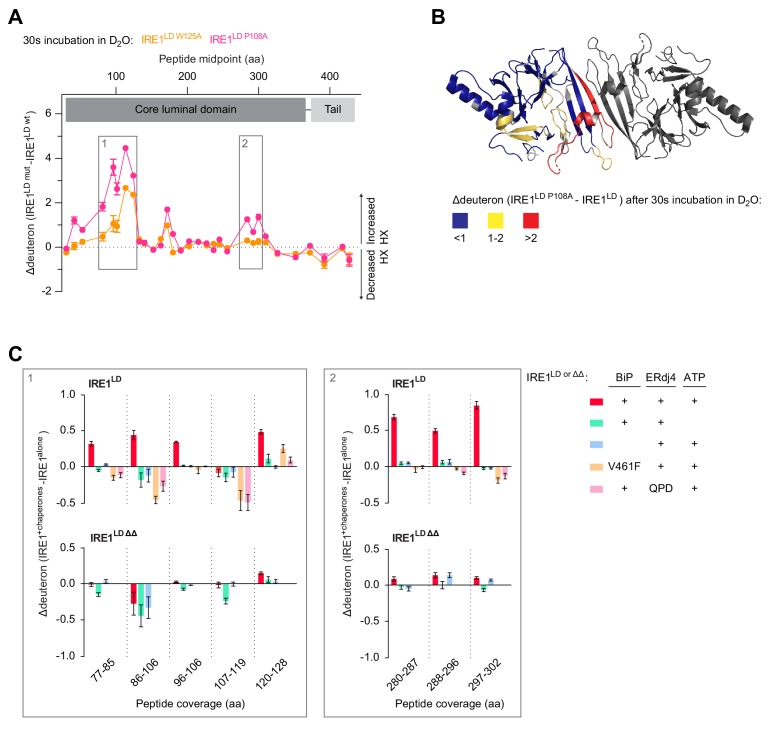
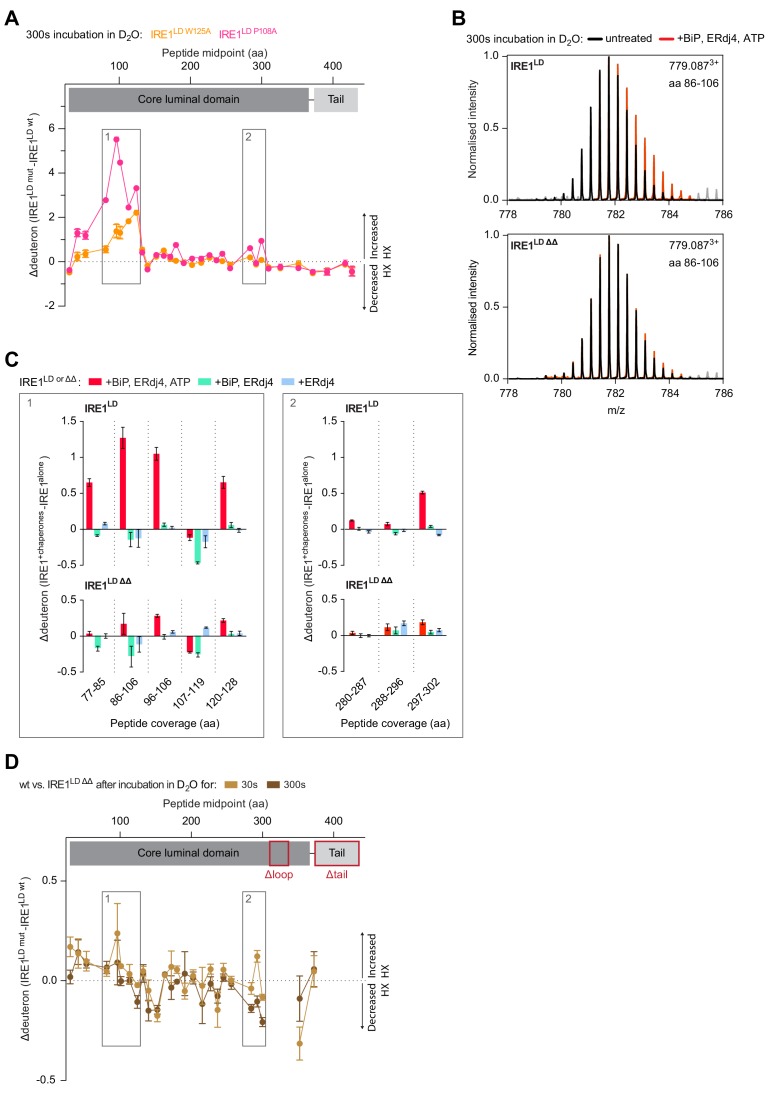
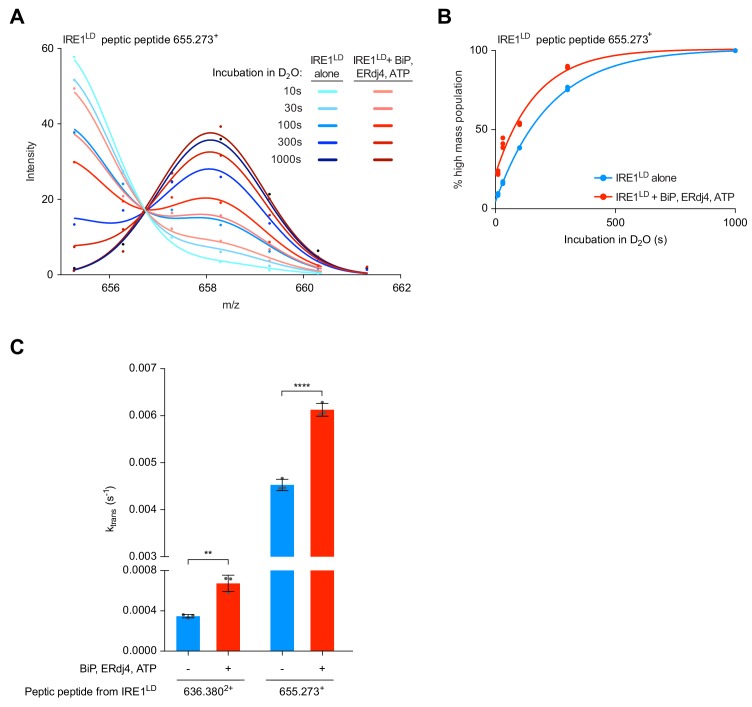
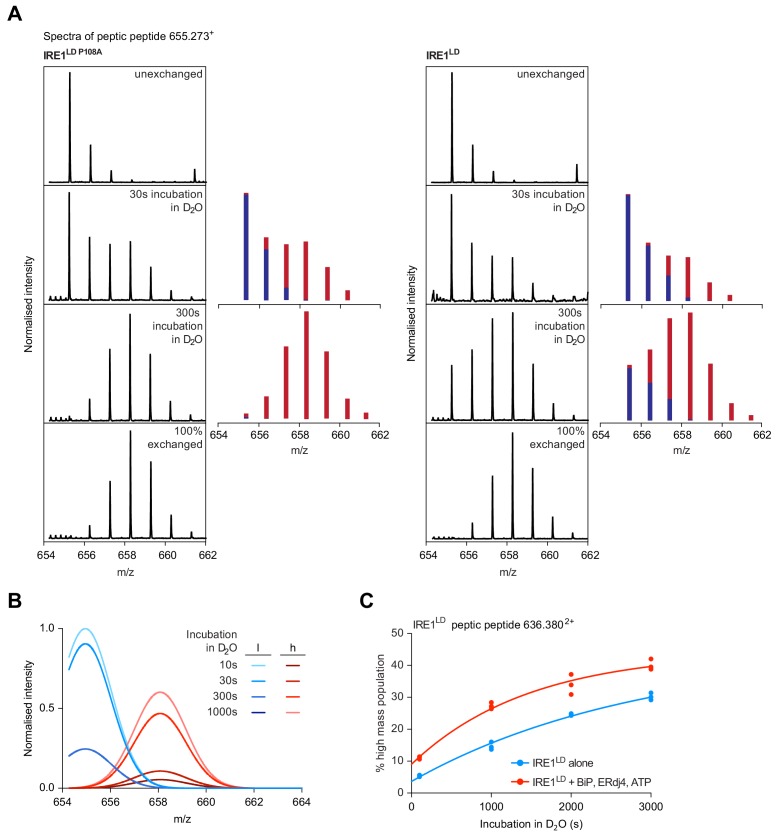
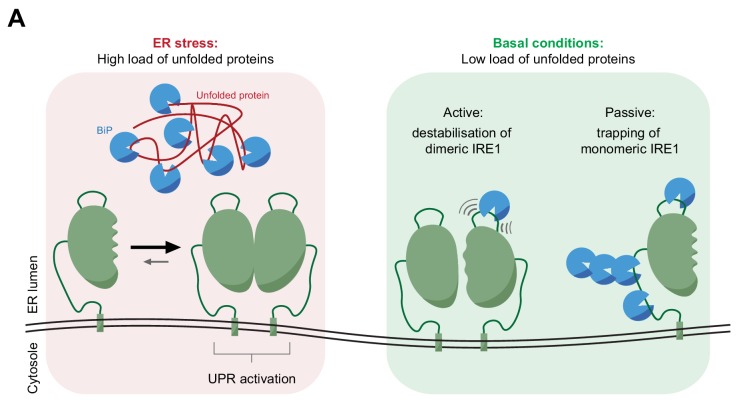
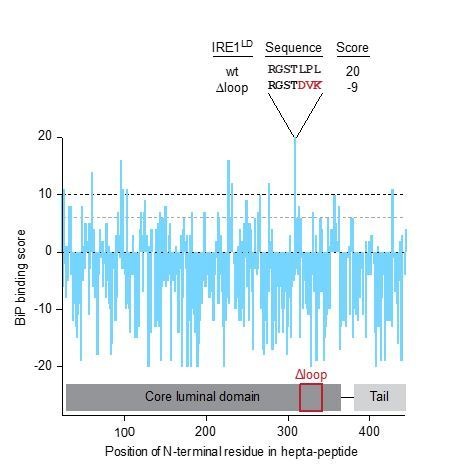
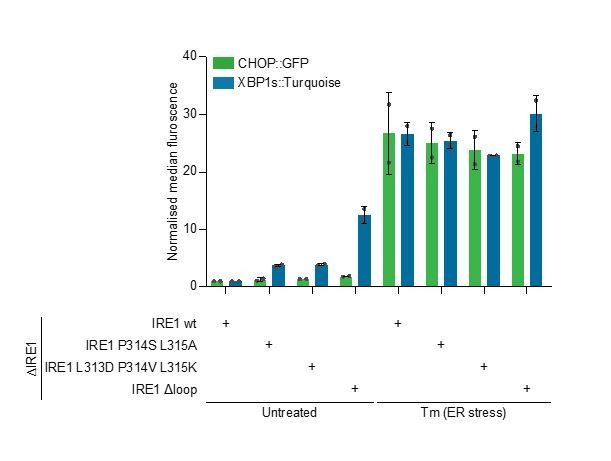
Coupling of endoplasmic reticulum (ER) stress to dimerisation-dependent activation of the UPR transducer IRE1 is incompletely understood. Whilst the luminal co-chaperone ERdj4 promotes a complex between the Hsp70 BiP and IRE1's stress-sensing luminal domain (IRE1LD) that favours the latter's monomeric inactive state and loss of ERdj4 de-represses IRE1, evidence linking these cellular and in vitro observations is presently lacking. We report that enforced loading of endogenous BiP onto endogenous IRE1α repressed UPR signalling in CHO cells and deletions in the IRE1α locus that de-repressed the UPR in cells, encode flexible regions of IRE1LD that mediated BiP-induced monomerisation in vitro. Changes in the hydrogen exchange mass spectrometry profile of IRE1LD induced by ERdj4 and BiP confirmed monomerisation and were consistent with active destabilisation of the IRE1LD dimer. Together, these observations support a competition model whereby waning ER stress passively partitions ERdj4 and BiP to IRE1LD to initiate active repression of UPR signalling.

Keywords: BiP/Grp78; Chinese Hamster Ovary (CHO) cells; E. coli; ERdj4/DNAJB9; IRE1; cell biology; endoplasmic reticulum (ER); unfolded protein response (UPR).


Conflict of interest statement

NA, LN, YY, MM No competing interests declared, DR Senior editor, eLife

Figures

Figure 1.
Figure 1.. Fusion of ERdj4’s J-domain to IRE1LD promotes efficient BiP association thereby repressing IRE1 activity in cells.
(A) Two dimensional plots of CHOP::GFP and XBP1s::Turquoise signals from CHO-K1 dual UPR reporter cells stably expressing the indicated IRE1 variants [IRE1 wild-type (wt), J-IRE1 or JQPD-IRE1 fusion; see Figure 1—figure supplement 1A, for schema of the alleles] from the endogenous Ern1 locus untreated and treated with the ER stressor tunicamycin (Tm). Clones used for the analysis were derived from an IRE1 null (ΔIRE1) parental cell line. A representative data set out of three independent experiments is shown. Note the low XBP1::Turquoise intensity in stressed J-IRE1 rescued ΔIRE1 cells. (B) Two dimensional plots of mCherry and XBP1s::Turquoise signals of clones described in ‘A’ transiently transfected with a plasmid encoding the SubA protease, which cleaves BiP at its interdomain linker and an mCherry fluorescent transfection marker. The inactive SubAS272A mutant was used as control. Representative data from nine biological repeats is shown. (C) Immunoblot (IB) of endogenous IRE1 and associated BiP recovered from the indicated cell lines by immunoprecipitation (IP) of IRE1. Quantification of the ratio of BiP to IRE1 signals in three independent experiments is shown on the right (mean ± standard deviation, n.s.: not significant, *: p<0.05, unpaired parametric Student’s t test). BiP in input cell lysates is provided as loading control. (Figure 1—source data 1) (D) Coomassie-stained SDS-PAGE gel of biotinylated IRE1LD (IRE1LD-bio) and a fusion of ERdj4’s J-domain to IRE1LD (J-IRE1LD-bio, as in ‘A’) and BiP, both recovered on a streptavidin matrix from samples constituted as indicated. Protein concentrations were 5 µM IRE1LD-bio variants, 30 µM BiP, 8 µM ERdj4, and 2 mM ATP. Proteins were eluted in SDS sample buffer. A representative data set out of three independent experiments is shown. (E) Time-dependent change in donor fluorescence of the indicated IRE1LD FRET pair incubated at t = 0 with the components shown to the right. IRE1LD proteins were either labelled with the donor molecule Oregon green 488 (OG) or the acceptor molecule TAMRA (TMR). Protein concentrations were 0.2 µM IRE1LD FRET pair, 30 µM BiP, 2.5 µM ERdj4 and 2 mM ATP. A representative graph of three independent experiments is shown (Figure 1—source data 2).
Figure 1—figure supplement 1.
Figure 1—figure supplement 1.. Modification of the endogenous Ern1 locus to introduce IRE1LD variants.
(A) Schematic description of the homologous recombination platform for creating IRE1-encoding alleles at the endogenous Ern1 locus (ΔIRE1, Kono et al., 2017). Cas9-CRISPR guides generated a large in-frame deletion between exons 2 and 11 in the endogenous Ern1 locus. In the resultant Ern1 null cell line (ΔLD15) the locus can be targeted with a unique Cas9-CRISPR guide and appropriate repair templates containing an intron-free minigene consisting of exons 2–11 to generate IRE1LD variants stably expressed from the endogenous locus by homology-directed repair (HDR). (B) Scheme of IRE1 variants: wild-type IRE1 (wt) and chimeric J-domain IRE1 fusion proteins expressed from the endogenous Ern1 locus to probe the effect of BiP binding to IRE1 activity in cells. The J-domain (or QPD mutant) of ERdj4 was fused N-terminally to IRE1LD, whereby ERdj4’s glycine-phenylalanine-rich (G/F) region was included as a flexible linker between both domains.
Figure 2.
Figure 2.. Binding of MPZ-N peptide to IRE1LD does not promote IRE1LD dimerisation.
(A) Size-exclusion chromatography (SEC) elution profiles of TAMRA (TMR)-labelled wild-type IRE1LD at the indicated concentrations in presence and absence of MPZ-N peptide. TMR fluorescence is plotted against elution time (see: Figure 2—source data 1). (B) SEC elution profiles (as in ‘A’), but with protein absorbance at 280 nm (A280) plotted against elution time. The inset is a zoom into the segment of the chromatogram encompassing the IRE1LD proteins, whose absorbance is dwarfed by the peak of free peptide (eluting at ~24 min). The heterogenous peaks eluting between 15 and 20 min in the sample loaded with 1 mM MPZ-N peptide, likely reflected peptide oligomerisation (see: Figure 2—source data 1). (C) Cartoon representation of the IRE1LD dimer (PDB: 2HZ6) is shown on the left with coloured secondary structures (cyan for helices, red for sheets and magenta for loops). The Gln105 side chain is shown as sticks, a closer view of which is shown on the top right. The bottom right panel shows a similar view of the Gln105Cys mutant (crystallised here), which forms a disulphide bond, covered with clear electron density (black mesh represents the 2mFo − DFc map, contoured at 1.0 σ, including density within 2 Å of the cysteine residues). (D) Anisotropy of FAM labelled MPZ-N peptide (100 nM) in presence of increasing concentrations of either wild-type IRE1LD or disulphide-linked dimeric IRE1Q105C SS. Shown are data from three independent experiments (mean ± SD). Curve fitting was performed in Prism GraphPad 7.0 using Equation 2 in Materials and methods (see: Figure 2—source data 2).
Figure 2—figure supplement 1.
Figure 2—figure supplement 1.. Biochemical properties of disulphide-linked dimeric IRE1LD Q105C SS and monomeric variants used to study MPZ-N’s interaction with IRE1LD.
(A) Size-exclusion chromatography (SEC) elution profiles of wild-type (wt) and monomeric IRE1LD W125A and IRE1LD P108A proteins at the indicated concentrations. Protein absorbance at 280 nm (A280) is plotted against elution time. Note the delayed peak elution times of the IRE1LD monomeric variants. The observation that IRE1LD wt and IRE1LD W125A variants eluted in a single peak yet shifting to later elution times with decreasing protein concentrations suggests that these proteins existed in a monomer-dimer exchange regime that is faster than the time scale of SEC. By contrast, IRE1LD P108A was monomeric at all tested concentrations. (B) Cartoon representation of the IRE1LD dimer interface with protomers in light and dark grey (PDB: 2HZ6). Residues that were mutated to create the monomeric variants IRE1LD W125A and IRE1LD P108A are located in close proximity to the dimer interface and are shown in orange or pink sticks, respectively. (C) Coomassie stained non-reducing SDS-PAGE gel of wt IRE1LD and disulphide-linked IRE1LD Q105C SS. (D) Scatter plot of the melting temperature (Tm) of the indicated IRE1LD proteins (at 5 µM) in absence or presence of the reducing agent TCEP or increasing concentrations of MPZ-N peptide measured by differential scanning fluorimetry (DSF) is depicted on the left. Shown are the data points of three independent experiments [mean ± standard deviation (SD)] with monomeric IRE1LD W125A and IRE1LD P108A, wt IRE1LD and a disulphide-linked dimeric IRE1LD Q105C SS or its reduced version IRE1LD Q105C SH. Statistical analysis for indicated conditions was performed in comparison to wt IRE1LD (***: p<0.001, ****: p<0.0001, ordinary one-way ANOVA). Traces of melt curves with their negative first derivatives from a representative experiment are shown on the right (peak fluorescence was normalised). (E) Overlay of the cartoon representation of IRE1LD (PDB: 2HZ6) and the disulphide-linked IRE1LD Q105C SS. The root-mean squared deviation (RMSD) over 227 Cα atoms is 0.46 Å.
Figure 2—figure supplement 2.
Figure 2—figure supplement 2.. Implications of the distance constraint arising from the paramagnetic relaxation enhancement (PRE) experiments with IRE1LD and an MPZ-proxyl-labelled peptide (Karagöz et al., 2017) to the possible modes of peptide binding.
(A) Cartoon representation of the IRE1LD dimer with protomers in light and dark grey (PDB: 2HZ6). The two helices flanking the MHC-like groove are coloured in blue. The isoleucines (Ile) whose peaks were suppressed or broadened upon introduction of the spin-labeled MPZ peptide are highlighted in red and yellow, respectively (from Figure 5 in Karagöz et al., 2017, doi.org/10.7554/eLife.30700.016). The incorporated spin label causes broadening of Ile peaks in a range of 10 to 25 Å or entirely erases them within distances of <10 Å (Gottstein et al., 2012). Therefore, the broadening of peaks observed in the NMR spectra of IRE1LD serves as a distance constraint, positioning the labelled residue of the MPZ peptide within 10 Å of Ile186 (in red). The blue mesh of 10 Å diameter centred on Ile186 depicts the distance constrain on the proxyl-labelled Cys5 of the MPZ peptide (LIRYCWLRRQAALQRRISAME). (B). As in ‘A’, but with two extra spheres centred at Ile186 with diameters of 26 Å (yellow meshes) and 58 Å (grey meshes) to show the possible location of the MPZ peptide in either helical or extended conformation, respectively. Also shown is the 8-residues-long peptide (magenta) present in the yeast IRE1LD crystal structure (Credle et al., 2005, PDB: 2BE1, superimposed onto the human model) and a superimposed peptide (cyan) found in the PERKLD structure (Wang et al., 2018, PDB: 5V1D). Note: There are 16 residues between Cys5 and the C-terminus of the MPZ peptide. If extended, the peptide is free to sample a sphere with a radius of ~48 Å from Cys5. Given that the PRE experiments place Cys5 of the peptide anywhere within 10 Å of IRE1LD Ile186, if extended, the peptide is free to explore the entire space encompassed by the grey mesh. Even if constrained to assume a compressed helical conformation, the peptide could be found anywhere within the yellow mesh. The numerous perturbations to the NMR spectrum arising from the presence of unlabelled peptide may reflect either the consequences of a peptide-IRE1LD interaction or an induced conformational change in the IRE1LD (as noted by Karagöz et al., 2017). Therefore, they do not constrain the location of the peptide. Constraint is provided by the PRE experiments, noted above, but these are not incompatible with the peptide binding outside the MHC-like groove.
Figure 3.
Figure 3.. Identification of flexible regions in IRE1LD that are important for the regulation of IRE1 activity in cells.
(A) Left panel shows a bar diagram of the percentage of amide hydrogen exchange (%ex) of the indicated by IRE1LD segments after 30 and 300 s incubation in D2O. The amino acids (aa) covered by the peptic fragments are indicated on the left. Exchange was corrected for back exchange using a fully deuterated IRE1LD preparation. Protein concentration was 5 µM. Shown are the data of three independent experiments (mean ± standard deviation). Right panel shows a cartoon of the IRE1LD dimer (PDB: 2HZ6) with the left protomer coloured according to %ex at 30 s (areas with no sequence coverage are uncoloured). The location of the putative loop (residues 308–357) and the tail (residues 390–444) are schematically represented as dotted lines (see: Figure 3—source data 1) (B) Schematic description of a directed in vivo CRISPR-Cas9 mutagenesis strategy to probe regions of IRE1LD for their relevance to regulating activity in CHO-K1 cells. Cas9 guides (red triangles) targeted sites across the Ern1 genomic locus encoding the protein’s region of interest. Transfection of individual or pairs of guides resulted in a collection of mutations (insertions and deletions, depicted as blue and red lines). Cell harbouring rare de-repressing mutations of IRE1 (blue) were selected by fluorescence-activated cell sorting (FACS) gated on XBP1s::Turquoise high and CHOP::GFP low signals. The resultant clones were isolated and genotyped. (C) Left panel is a histogram of XBP1s::Turquoise intensity of CHO-K1 dual UPR reporter cell populations transfected with guide-Cas9 encoding plasmids targeting a putative unstructured loop (aa 308–357) within IRE1LD (identified in ‘A’). XBP1s::Turquoise bright cells within population 0 were collected by FACS (FACS1) yielding population 1, followed by a second round of enrichment for bright cells (FACS2 yielding population 2). Population 2 was treated with the IRE1 inhibitor 4µ8c to select against clones exhibiting IRE1-independent reporter activity. The final population was genotypically analysed (representative sequences are shown on the right). Frameshift mutations are coloured in blue and Cas9 cut sites are indicated below.
Figure 3—figure supplement 1.
Figure 3—figure supplement 1.. IRE1’s tail region is involved in maintaining the repressed state of IRE1 in vivo.
(A) Schematic representation of IRE1. The signal peptide (SP), luminal domain (LD), comprised of a structured core (CLD) and an unstructured tail, the transmembrane (TM) domain and the cytosolic effector domains are indicated with their corresponding amino acid (aa) resides below. (B) Representative sequences of clones that were selected as described in Figure 3C after transfection of cells with guide-Cas9 encoding plasmids targeting IRE1’s tail (residues 368–444). Frameshift mutations are coloured in blue and Cas9 cut sites are indicated by arrowheads below.
Figure 4.
Figure 4.. Cells expressing IRE1LD deletion variants exhibit a de-repressed IRE1 phenotype that correlates with less BiP bound to IRE1.
(A) Bar diagram of median XBP1::Turquoise and CHOP::GFP signals from untreated and tunicamycin (Tm)-treated CHO-K1 dual UPR reporter cells with Ern1 alleles encoding wild-type (wt) or the indicated deletion variants of IRE1 (∆loop, missing residues 313–338, ∆tail, missing residues 391–444, or ∆∆, missing both). Data from four independent experiments is shown [mean ± standard deviation (SD), **: p<0.01, ****: p<0.0001, one-way ANOVA with Sidak’s multiple comparison test] (Figure 4—source data 1). (B) Representative immunoblot (IB) of endogenously-expressed wt or the IRE1 ∆∆ deletion mutant (see ‘A’) and associated BiP recovered by immunoprecipitation (IP) of IRE1. BiP in input cell lysates is provided as a loading control. Quantification of the ratio of BiP to IRE1 signals after IP of three independent experiments is shown below (mean ± SD, *: p<0.05, ratio paired parametric Student’s t test) (see: Figure 4—source data 2) (C) Left panel shows a representative immunoblot of the indicated IRE1 variants with glutathione S-transferase (GST) replacing the cytosolic domain. The proteins were introduced into CHO-K1 cells by transient transfection, and the associated endogenous BiP recovered by glutathione pull down. BiP in input cell lysates is provided as a loading control. Quantification of the ratio of BiP to IRE1 signals in the IP of three independent experiments is shown to the right (mean ± SD, *: p<0.05, **: p<0.01, ***: p<0.001, one-way ANOVA with Sidak’s multiple comparison test).
Figure 4—figure supplement 1.
Figure 4—figure supplement 1.. Single or double deletion of a flexible loop and the tail within IRE1LD de-repressed IRE1 basal activity.
(A) Two dimensional contour plots of untreated and tunicamycin (Tm)-treated CHO-K1 CHOP::GFP and XBP1s::Turquoise dual UPR reporter cells expressing the indicated alleles (as in Figure 4A) analysed by flow cytometry. The measurements were performed after transient transfection of Cas9-CRISPR guides together with the respective repair templates yielding populations that had and had not undergone homologous recombination (‘Analysis of mixed population’). Representative data from four independent experiments is shown. (B) Contour plot (as in ‘A’) of clonal cell lines expressing the same alleles used in the experiment shown in Figure 4B. Representative data from three biological repeats is shown.
Figure 5.
Figure 5.. Impaired BiP binding and monomerisation of IRE1LD ΔΔ in vitro.
(A) Left panel shows Bio-Layer Interferometry (BLI)-derived association (assoc.) and dissociation (dissoc.) traces of streptavidin sensors loaded with the indicated biotinylated ligands [a fusion of ERdj4’s J-domain to IRE1LD wild-type (wt) or ∆∆, as in Figure 1D] and exposed sequentially to the indicated solutions of analyte (containing wt BiP or the client-binding mutant BiPV461F). A representative experiment of three independent repetitions is shown. The traces were subtracted against a background derived from a BLI sensor with no ligand and the BLI signals (displacement) were set to zero after the first washing step. Quantification of the dissociation rate constants koff after association in presence of 0.15 µM BiP and 2 mM ATP are shown to the right. Traces were fitted to a two-phase dissociation function in Prism GraphPad 7.0. Shown are the mean ± standard deviation (SD) of three independent repetitions (n.s.: not significant, unpaired parametric Student’s t test). (B) Coomassie-stained SDS-PAGE gel of biotinylated wt IRE1LD (IRE1LD-bio), double deleted IRE1LD ∆∆ (IRE1LD ∆∆-bio) and BiP, recovered on a streptavidin matrix from samples constituted as indicated. 2 mM ATP was used during wash steps of the matrix when indicated. A representative data set is shown. Quantification of the ratio of BiP to IRE1 signals in the relevant samples after pull down from three independent experiments is shown on the right (mean ± SD, *: p<0.05, **: p<0.01, one-way ANOVA with Sidak’s multiple comparison test). (C) Time-dependent change in donor fluorescence of the indicated IRE1LD FRET pair incubated at t = 0 with the components shown to the right. The asterisks mark samples set up with a mock FRET sensor lacking the IRE1LD donor-labelled molecule. Protein concentrations were 0.2 µM FRET pair, 30 µM BiP, 2.5 µM full-length ERdj4 (or its isolated J-domain) and 2 mM ATP. A representative experiment of three independent repetitions is shown. When indicated, the data points were fitted to a one-phase association function in Prism GraphPad 7.0; the initial velocity represents the slope of the curve at time point zero (mean ± SD, ***: p<0.001, unpaired parametric Student’s t test) (see: Figure 5—source data 1).
Figure 5—figure supplement 1.
Figure 5—figure supplement 1.. The ∆∆ deletion does not affect the stability of the IRE1LD dimer.
(A) Bio-Layer Interferometry (BLI)-derived association (assoc.) and dissociation (dissoc.) traces of streptavidin sensors loaded with the indicated biotinylated ligands [wild-type (wt) or IRE1LD ∆∆] and exposed sequentially to the indicated solutions of analyte. 2 µM BiP, 6.8 µM full-length ERdj4, or isolated J-domain and 2 mM ATP. A representative experiment of three independent repetitions is shown (processed as in Figure 5A). (B) As in Figure 5A but comparing the monomeric J-IRE1LD P108A and the disulphide-linked J-IRE1LD Q105C SS proteins as ligands on the sensor. A representative experiment of three independent repetitions is shown. (C) Size-exclusion chromatography (SEC) elution profiles of TAMRA (TMR)-labelled wt and IRE1LD ΔΔ proteins at the indicated concentrations. TMR fluorescence is plotted against elution time [note: fluorescent labelling was used to detect a signal at the low protein concentration (conc.) required to generate a pool of monomeric IRE1LD] (see: Figure 5—source data 2) (D) Plot of peak elution time points derived from ‘C’ against the protein concentration on a logarithmic scale for IRE1LD and IRE1LD ΔΔ. Curve fitting was performed in Prism GraphPad 7.0 using a sigmoidal function and calculated K1/2 max values are displayed underneath the curves.
Figure 6.
Figure 6.. BiP-mediated monomerisation of IRE1LD ∆∆ assessed by hydrogen exchange mass spectrometry (HX-MS).
(A) Difference plot of deuteron incorporation comparing wild-type (wt) IRE1LD with the monomeric mutants IRE1LD W125A (orange trace) or IRE1LD P108A (pink trace) after 30 s incubation in D2O [see Table 2 for the amino acid (aa) sequence of the individual segments]. Protein concentration was 5 µM. Shown are data from three independent experiments [mean ± standard deviation (SD)]. Boxes 1 and 2 highlight regions of greater hydrogen exchange (HX) in the monomeric mutants compared to wt IRE1LD that were analysed in presence of chaperones in ‘C’ (see Figure 6—source data 1). (B) Cartoon representation of the IRE1LD dimer (PDB: 2HZ6) coloured according to the difference of deuteron incorporation between wt and IRE1LD P108A after 30 s of incubation in D2O (from ‘A’). (C) Difference plot of the deuteron incorporation between the untreated sample and samples exposed to the indicated additives. The data for the same peptic peptides from wt IRE1LD and the IRE1LD ΔΔ mutant are displayed separately. Protein concentrations were 5 µM IRE1LD (wt or ∆∆ mutant), 30 µM BiP (wt or V461F mutant), 6 µM ERdj4 (wt or QPD mutant) and 2 mM ATP. Shown are the means ± SD of three data sets acquired after 30 s incubation in D2O (the corresponding 300 s data set is presented in Figure 6—figure supplement 1A and C) (see Figure 6—source data 2).
Figure 6—figure supplement 1.
Figure 6—figure supplement 1.. HX-MS evidence for impaired BiP- and ERdj4-driven monomerisation of IRE1LD ΔΔ.
(A) Difference plot of deuteron incorporation into the indicated peptic peptides of wild-type (wt) versus IRE1LD W125A or wt versus IRE1LD P108A after 300 s incubation in D2O (as in Figure 6A) (see Figure 6—source data 1). (B) Overlay of representative spectra showing the isotope cluster of peptic fragment 779.0873+ (residues 86–106) from wt or IRE1LD ∆∆, untreated (black) or exposed to BiP, ERdj4 and ATP (red) after 300 s incubation in D2O. Peaks arising from overlapping BiP peptides are coloured in grey. Note the stronger shift of the peaks towards higher m/z values (indicating an increased deuteron incorporation) in case of wt IRE1LD in presence of BiP, ERdj4 and ATP. (C) Difference plot of the deuteron incorporation between the untreated sample and samples exposed to the indicated additives. The data for the same peptic peptides from wt and the IRE1LD ΔΔ mutant are displayed separately (as in Figure 6C, but after 300 s incubation in D2O) (see Figure 6—source data 2) (D) Difference plot of deuteron incorporation into the indicated peptic peptides of wt versus IRE1LD ∆∆ mutant after 30 or 300 s incubation in D2O as in Figure 6A (in absence of chaperones). Regions deleted in IRE1LD ΔΔ are excluded from the difference plot.
Figure 7.
Figure 7.. Analysis of bimodally-distributed isotope clusters of IRE1LD peptic peptides reveals active destabilisation of the IRE1LD dimer by BiP.
(A) Intensity distributions of the isotope clusters of peptide 655.273+ (residues 297–302) from IRE1LD, untreated or exposed to BiP, ERDj4 and ATP (30 min at 30°C) following different incubation times in D2O, as indicated. Curves are fits of the sum of two Gaussian distributions (Prism GraphPad 7.0, see Equation 4 in Materials and methods). A representative plot of three independent experiments is shown. (see: Figure 7—source data 1) (B) Plot of time-dependent change in the fractional contribution of high mass species to the isotope clusters of peptide 655.273+ (from ‘A’) calculated as described in Figure 7—figure supplement 1A and B. Shown are data points from three independent samples of IRE1LD in presence and absence of BiP, ERdj4 and ATP. The curves were fitted to a one-phase association model in Prism GraphPad 7.0. Data for a second informative peptide is shown in Figure 7—figure supplement 1C. (C) Bar diagram of the transition rate constant ktrans extracted by analysis of bimodal distributions in the isotope clusters of peptic fragments 636.3802+ and 655.273+ from IRE1LD in presence and absence of BiP, ERdj4 and ATP (from Figure 7B and Figure 7—figure supplement 1C). All the data points from three independent experiments are shown and the mean ± standard deviation (**: p<0.01, ****: p<0.0001, one-way ANOVA with Sidak’s multiple comparison test).
Figure 7—figure supplement 1.
Figure 7—figure supplement 1.. Analysis of the bimodal distributions of the isotope clusters detected by HX-MS.
(A) Shown are original spectra of peptic peptide 655.273+ (residues 297–302) from monomeric IRE1LD P108A (left panel) or wild-type IRE1LD (right panel) at the indicated time point of incubation in D2O. The contribution of the low (blue) and high (red) exchanging populations to the peaks was extracted by fitting the data to a two Gaussian distribution model (Equation 4). Unexchanged and 100% exchanged spectra are provided as references. (B) Plot of the two individual Gaussian distributions of the high (h) and low (l) exchanging populations deconvoluted computationally in Prism GraphPad 7.0 from the composite data set shown in Figure 7A for each time point of incubation in D2O. (C) Plot of time-dependent change in the fractional contribution of high mass species to the isotope clusters of peptic peptide 636.3802+ (residues 96–106). Shown are data points from three independent samples of IRE1LD in presence and absence of BiP, ERdj4 and ATP (as in Figure 7B). The curves were fitted to a one-phase association model in Prism GraphPad 7.0.
Figure 8.
Figure 8.. Cartoon depicting features of BiP-mediated regulation of IRE1 activity.
In stressed cells unfolded proteins compete for BiP, exposing IRE1LD to a default dimeric active state, specified by the kinetics of the monomer-dimer equilibrium (left panel). In compensated cells BiP (assisted by ERdj4 and possibly other J-domain proteins, not shown) binds flexible regions of IRE1LD. Engagement of these regions in the IRE1LD dimer may favor active dimer disassembly by entropic pulling or allosterically induced conformational changes (right panel). BiP binding to the same flexible regions of the IRE1LD monomer, may inactivate IRE1 by disfavoring re-dimerisation (right panel). The dynamic nature of BiP binding, which entails cycles for ATP hydrolysis-driven client engagement and nucleotide exchange-mediated release, ensures that IRE1 activity is kinetically coupled to the balance between unfolded protein load and folding capacity of the cell.
Author response image 1.
Author response image 1.. BiP binding score based on Blond-Elguindi et al. (1993) of hepta-peptides within the entire human IRE1LD’s sequence.
Hepta-peptides having a score of >10 are predicted to have an extremely high probability of binding (black dashed line), peptides with scores between +6 and +10 are predicted to have odds of three to one of having binding activity (grey dashed line), scores between 0 and +5 are predicted to have little predictive value and peptides with scores below 0 are predicted to almost always lack the capacity to bind BiP.
Author response image 2.
Author response image 2.. Bar diagram of median XBP1::Turquoise and CHOP::GFP signals from untreated and tunicamycin (Tm)-treated CHO-K1 dual UPR reporter cells with Ern1 alleles encoding wild type (wt) or the indicated mutant variants of IRE1 (∆loop, missing residues 313-338).
Data from two independent experiments is shown (means ± range)..

References

    1. Abravaya K, Myers MP, Murphy SP, Morimoto RI. The human heat shock protein hsp70 interacts with HSF, the transcription factor that regulates heat shock gene expression. Genes & Development. 1992;6:1153–1164. doi: 10.1101/gad.6.7.1153. - DOI - PubMed
    1. Amin-Wetzel N, Saunders RA, Kamphuis MJ, Rato C, Preissler S, Harding HP, Ron D. A J-Protein Co-chaperone recruits BiP to monomerize IRE1 and repress the unfolded protein response. Cell. 2017;171:1625–1637. doi: 10.1016/j.cell.2017.10.040. - DOI - PMC - PubMed
    1. Avezov E, Cross BC, Kaminski Schierle GS, Winters M, Harding HP, Melo EP, Kaminski CF, Ron D. Lifetime imaging of a fluorescent protein sensor reveals surprising stability of ER thiol redox. The Journal of Cell Biology. 2013;201:337–349. doi: 10.1083/jcb.201211155. - DOI - PMC - PubMed
    1. Bakunts A, Orsi A, Vitale M, Cattaneo A, Lari F, Tadè L, Sitia R, Raimondi A, Bachi A, van Anken E. Ratiometric sensing of BiP-client versus BiP levels by the unfolded protein response determines its signaling amplitude. eLife. 2017;6:e27518. doi: 10.7554/eLife.27518. - DOI - PMC - PubMed
    1. Behnke J, Feige MJ, Hendershot LM. BiP and its nucleotide exchange factors Grp170 and Sil1: mechanisms of action and biological functions. Journal of Molecular Biology. 2015;427:1589–1608. doi: 10.1016/j.jmb.2015.02.011. - DOI - PMC - PubMed

Publication types

MeSH terms

Associated data