. 2019 Dec 23;9(1):19710.
doi: 10.1038/s41598-019-56232-1.

The Rarity of Depth Refugia from Coral Bleaching Heat Stress in the Western and Central Pacific Islands

Affiliations

The Rarity of Depth Refugia from Coral Bleaching Heat Stress in the Western and Central Pacific Islands

Roberto M Venegas et al. Sci Rep. .

Abstract

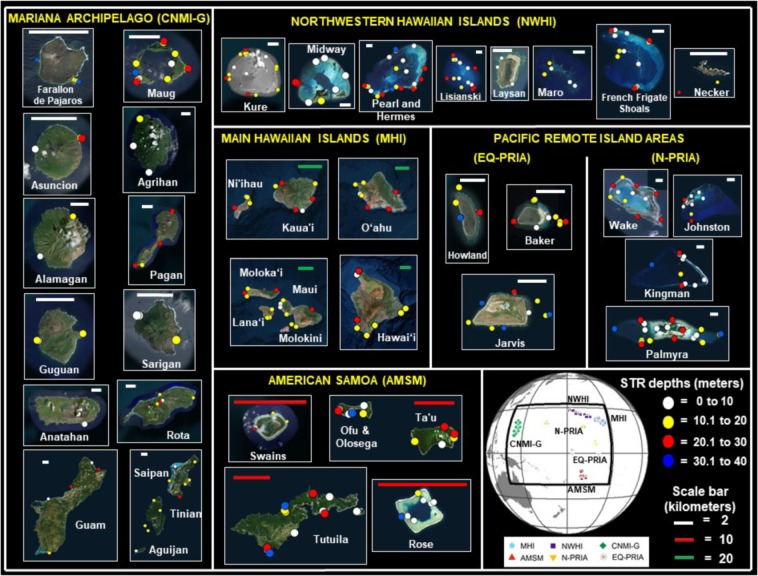
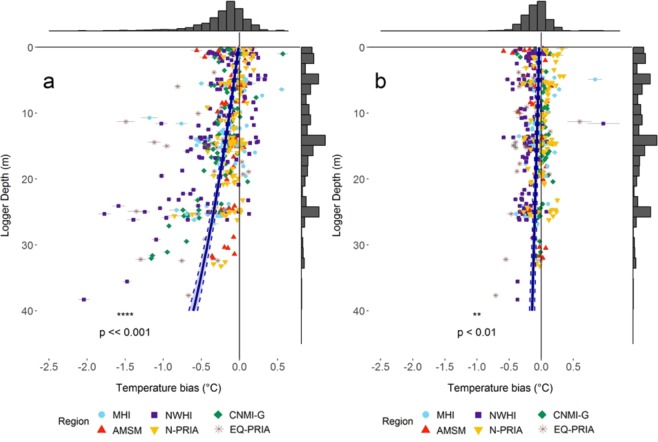
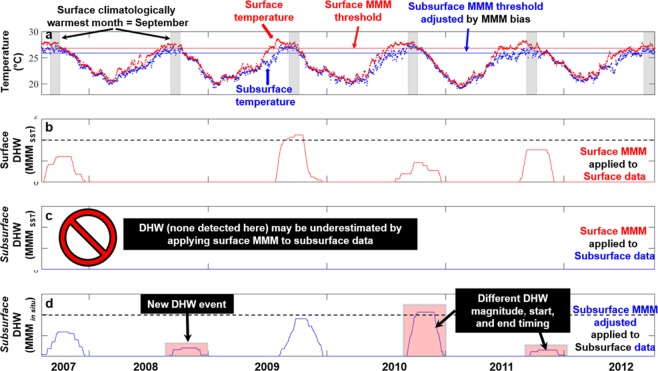
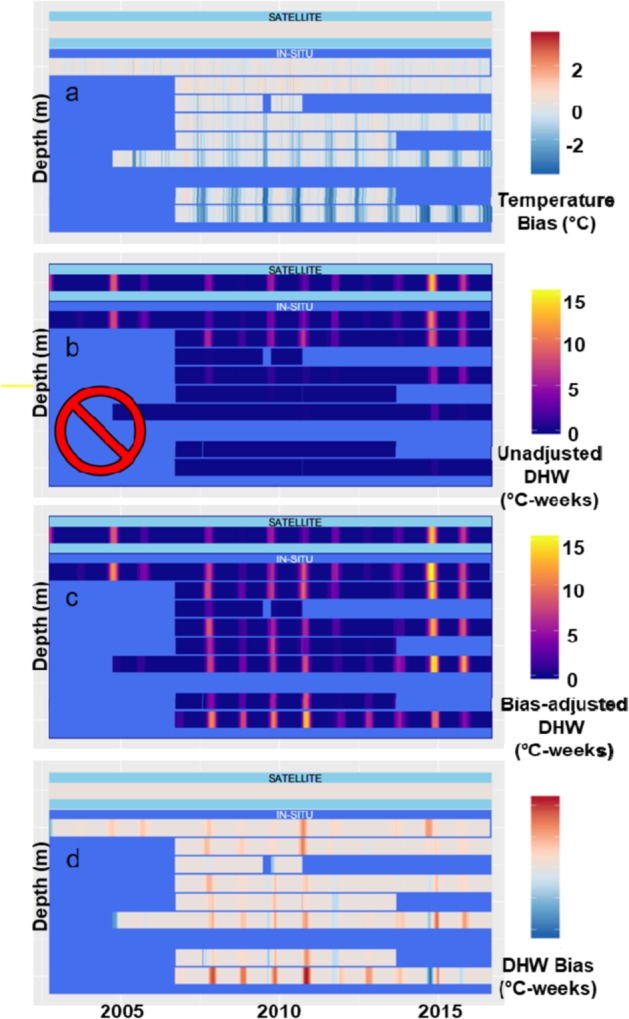
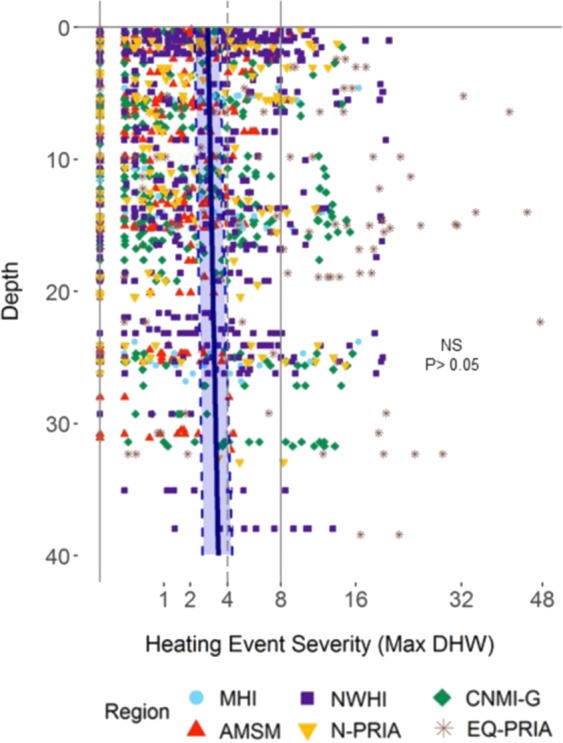
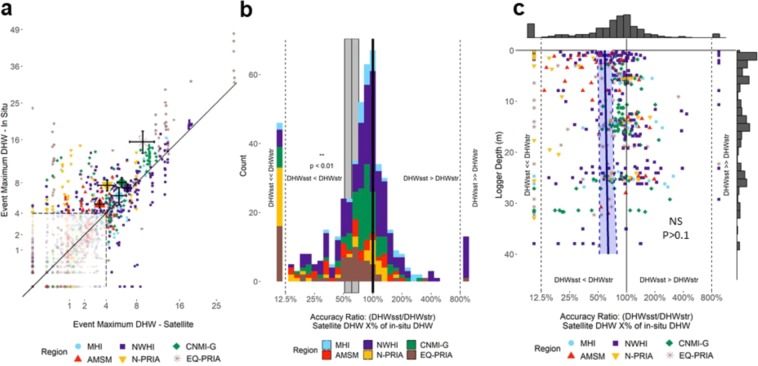
Some researchers have suggested that corals living in deeper reefs may escape heat stress experienced by shallow corals. We evaluated the potential of deep coral reef refugia from bleaching stress by leveraging a long record of satellite-derived sea surface temperature data with a temporal, spatial, and depth precision of in situ temperature records. We calculated an in situ stress metric using a depth bias-adjusted threshold for 457 coral reef sites among 49 islands in the western and central Pacific Ocean over the period 2001-2017. Analysis of 1,453 heating events found no meaningful depth refuge from heat stress down to 38 m, and no significant association between depth and subsurface heat stress. Further, the surface metric underestimated subsurface stress by an average of 39.3%, across all depths. Combining satellite and in situ temperature data can provide bleaching-relevant heat stress results to avoid misrepresentation of heat stress exposure at shallow reefs.


Conflict of interest statement

The authors declare no competing interests.

Figures

Figure 1
Figure 1
Subsurface temperature recorder (STR) study sites monitored by NOAA’s Pacific Reef Assessment and Monitoring Program (Pacific RAMP) in the six archipelagic regions: The Commonwealth of the Northern Mariana Islands and Guam (CNMI-G) with 17 islands (subsurface Santa Rosa Reef, Supply Reef, and Zealandia Bank not shown); the Northwestern Hawaiian Islands (NWHI) with nine islands (Gardner Pinnacles not shown); the Main Hawaiian Islands (MHI) with 10 islands (Lehua and Five Fathom Pinnacle not shown); American Samoa (AMSM) with six islands (South Bank not shown); the Northern Pacific Remote Island Areas (N-PRIA) with four islands; and the equatorial Pacific Remote Island Areas (EQ-PRIA) with three islands. A total of 1076 individual STR were deployed in depths ranging between 1 and 38 m at a total of 492 coral reef sites distributed among 49 islands in the six regions. Circles indicate the 457 sites with at least 365 consecutive days of data analyzed in the study. Color in circles represent STR deployment depths in meters (White = 0 to 10, Yellow = 10.1 to 20, Red = 20.1 to 30, and Blue = 30.1 to 40). Overlapping in the location of STRs (circles) is due to instrument proximity. Global map insert shows the location of the 457 sites at the six regions, and their associated names and symbols. The maps were generated by using the free version of Google Earth Pro (https://www.google.com/earth) with data from the following providers: Image Landsat/Copernicus, Image @2019 Maxar Technologies, and Image @ 2019 CNES/Airbus. The NOAA Pacific RAMP STRs location is overlapped to the individual maps.
Figure 2
Figure 2
Nighttime temperature bias (in situ STR minus satellite SST) at depth for 457 sites from all six regions (n = 457). (a) Summer temperature bias during the climatologically warmest month as determined by the SST record (Fig. S8 and Table S1 shows details on statistics underlying data). (b) Winter temperature bias during the month that is six months offset from the summer climatologically warmest month (Fig. S9 and Table S2 shows details on statistics underlying data). In both seasons the blue line represents the linear mixed model regression and the dashed lines represent standard error of the model fit. The six regions are identified with different symbols and colors as defined in the legend. Both summer and winter temperature bias show significant association with depth (p ≪ 0.001 and p < 0.01, respectively). Histogram on top of plots refers to x-axis and represents the total count of sites associated to temperature bias bins. Histogram on right side of plots refers to y-axis and represents the total count of STRs associated to depth bins.
Figure 3
Figure 3
Satellite (SST) and 23 m-depth in situ (STR) temperature and calculated heat stress (DHW) for Pearl and Hermes Atoll, 2007–2012. (a) SST (red dots) and STR (blue dots) daily temperature time series with SST and STR bias-adjusted MMM thresholds (red and blue lines, respectively) for the SST climatologically warmest month (September, gray bars). (b) Surface DHW (MMM applied to SST surface temperature). (c) Subsurface unadjusted DHW (MMM applied directly to STR temperature) – the inappropriate nature of this combination is identified with the red prohibition sign). (d) Bias-adjusted subsurface DHW (bias-adjusted MMM applied to STR temperature). Horizontal black dashed line in (b,d) represents the threshold of DHW associated with the start of severe bleaching (i.e., DHW = 4 °C-weeks).
Figure 4
Figure 4
An example results of the new method of using bias-adjusted MMM to estimate DHW at depth of 38 m at Pearl & Hermes Atoll site between 2002 and 2016 (depths binned every 5 m, n = 30). (a) In situ (STR) temperature bias relative to satellite (SST) data (red = STR warmer, blue = STR cooler). (b) Subsurface DHW at depth using unadjusted MMM threshold (inappropriate in situ DHW calculation identified with red prohibition sign). (c) Subsurface DHW using bias-adjusted MMM threshold. (d) Difference between surface and bias-adjusted subsurface DHW (red indicates surface DHW is greater and blue indicates surface DHW lower than subsurface DHW).
Figure 5
Figure 5
Maximum subsurface heat stress estimates for all 1,453 heating events at depth for all six regions and 457 sites across the western and central Pacific (n = 1,453). The blue line represents the linear mixed model regression fit and the blue dashed lines bound the standard error of the model fit showing no significant association between depth and observed heat stress events (NS, p > 0.05). Vertical light gray lines show DHW values reflecting likely bleaching (DHW = 4 °C-weeks, dashed) and likely widespread bleaching and significant mortality (DHW = 8 °C-weeks, solid). Fig. S10 and Table S3 shows statistical summary from linear mixed model of relationship between Maximum DHW and depth during major warming events. The six regions are identified with different symbols and colors as defined in the legend. Table S3 shows details on statistics underlying data.
Figure 6
Figure 6
Subsurface (DHWSTR) and surface (DHWSST) DHW comparison for 501 severe heat stress events (n = 501), defined as events with a maximum severity of 4 °C-weeks or greater by either metric. (a) Subsurface vs surface DHW maximum event severity. Region-mean DHW (only major events) is shown by a larger symbol with black whiskers indicating standard error (Fig. S11 and Table S4 shows details on statistics underlying data). Minor DHW events of <4 °C-weeks by both metrics are shown in pale colors for reference. (b) Distribution of ratio of surface to subsurface DHW for severe heating events (DHWSST/DHWSTR), plotted on a log2 transformed axis (Fig. S12 and Table S5 shows details on statistics underlying data). Counts with DHWSST = 0 are plotted at ratio = 10%; counts with DHWSTR = 0 are plotted at ratio = 1000%; and counts with both DHW values = 0 are plotted at 100%. The vertical gray bar highlights the mean mixed model estimate of ratio of surface to subsurface DHW (i.e. black line at 60.7%) with standard error of the model fit in gray (±1 standard error range: 51.4–71.7%), indicating overall underestimation by DHWSST of 39.3% (**p < 0.01). (c) Relationship between depth and Accuracy Ratio in DHW estimates shows no significant association (NS, p > 0.05. Fig. S13 and Table S6 shows details on statistics underlying data). The six regions are identified with different symbols and/or colors as defined in the legend.

References

    1. McWilliams JP, Côté IM, Gill JA, Sutherland WJ, Watkinson AR. Accelerating Impacts of Temperature-Induced Coral Bleaching in the Caribbean. Ecology. 2005;86:2055–2060. doi: 10.1890/04-1657. - DOI
    1. Eakin, C. M. Coral Bleaching. In Coral Bleaching (ed. M. J. H. van Oppen, J. M. L.) 205, (Springer-Verlag, 2009).
    1. Liu G, et al. Reef-scale thermal stress monitoring of coral ecosystems: New 5-km global products from NOAA coral reef watch. Remote Sens. 2014;6:11579–11606. doi: 10.3390/rs61111579. - DOI
    1. Hughes TP, et al. Global warming transforms coral reef assemblages. Nature. 2018;556:492–496. doi: 10.1038/s41586-018-0041-2. - DOI - PubMed
    1. Hoegh-Guldberg O. Climate change, coral bleaching and the future of the world’s coral reefs. Mar. Freshw. Res. 1999;50:839–866.

Publication types