. 2020 Jan;52(1):126-134.
doi: 10.1038/s41588-019-0550-4. Epub 2019 Dec 23.

Identifying cross-disease components of genetic risk across hospital data in the UK Biobank

Affiliations

Identifying cross-disease components of genetic risk across hospital data in the UK Biobank

Adrian Cortes et al. Nat Genet. 2020 Jan.

Abstract

Genetic risk factors frequently affect multiple common human diseases, providing insight into shared pathophysiological pathways and opportunities for therapeutic development. However, systematic identification of genetic profiles of disease risk is limited by the availability of both comprehensive clinical data on population-scale cohorts and the lack of suitable statistical methodology that can handle the scale of and differential power inherent in multi-phenotype data. Here, we develop a disease-agnostic approach to cluster the genetic risk profiles for 3,025 genome-wide independent loci across 19,155 disease classification codes from 320,644 participants in the UK Biobank, representing a large and heterogeneous population. We identify 339 distinct disease association profiles and use multiple approaches to link clusters to the underlying biological pathways. We show how clusters can decompose the variance and covariance in risk for disease, thereby identifying underlying biological processes and their impact. We demonstrate the use of clusters in defining disease relationships and their potential in informing therapeutic strategies.


Conflict of interest statement

Competing interests: G.M. is a cofounder of, holder of shares in, and consultant to Genomics PLC, and is a partner in Peptide Groove LLP. The other authors declare no competing financial interests.

Figures

Extended Data Fig. 1
Extended Data Fig. 1. Comparison of estimated log10(BFtree) in the two implementations of TreeWAS for 25,000 SNPs in the hospital episode statistics data set.
Pearson correlation between the two analysis is noted in text.
Extended Data Fig. 2
Extended Data Fig. 2. Derivation of an allele frequency-specific log10(BFtree) significance threshold to maintain a false positive rate below 1%.
The threshold for each allele frequency bin was set to be at least log10(BFtree) = 5.
Extended Data Fig. 3
Extended Data Fig. 3. Concordance of TreeWAS analysis results in the two sources of phenotype data from the UK Biobank, self-reported (SR) data-field 20002 and hospitalisation in-patient records (HES) data-fields 41142 and 41078.
We observed high concordance of the observed evidence of association (log10(BFtree)) for 3,025 independent SNPs and 25,640 GWAS catalog SNPs, with Pearson’s correlation of 0.87 and 0.56, respectively.
Extended Data Fig. 4
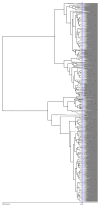
Extended Data Fig. 4. Hierarchical clustering of 3,025 SNP risk profiles across the ICD-10 classification tree in the UK Biobank HES data set.
Y-axis is the distance between pairs. Blue line is at height value 0 and red line at height value -5.
Extended Data Fig. 5
Extended Data Fig. 5. Estimates of relationship between the genetic risk profiles for 339 clusters.
For all pairwise comparisons we computed the |D'| statistic and the Jaccard index (see Section Disease ontology analyses in the Supplementary Note).
Extended Data Fig. 6
Extended Data Fig. 6. Schematic illustration of the model that is used to motivate the focal phenotype analysis.
We hypothesize that a set of variants, G, that influences risk for a common set of disease phenotypes, Z, can be acting through a single underlying biological process, X. Typically, we are unlikely to have direct measurement of this variable, though of those disease codes that are mediated by this latent variable, some are likely to be closer to it than others, where closer means a larger absolute value for the regression coefficient of the latent variable on the observed outcome (See Supplementary Note).
Extended Data Fig. 7
Extended Data Fig. 7. Principal component analysis of genome-wide genotype data in the UK Biobank cohort.
Each plot corresponds to a projection into two dimensions of the principal component analysis. Individuals in blue were determined to be of recent and genome-wide British Isles ancestry.
Figure 1
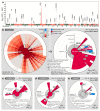
Figure 1. Genome-wide evidence for association to the UK Biobank hospital episode statistics (HES) phenotype data set.
(A) Manhattan plot depicting evidence of association (log10 BFtree) across the HES data set. SNPs labelled with gene names exemplify notable associations to common human diseases (see text). (B) Posterior decoding of genetic effect direction and strength of evidence for the rs532965 SNP in the MHC class II region. The ICD-10 classification is depicted as a radial tree where the first orbit represents the 22 ICD-10 Chapters, followed by an orbit representing blocks of categories, and then by two consecutive orbits representing ICD-10 categories including the observed annotation codes. To simplify the representation of the posterior decoding of the ICD-10 codes (left tree) we only colour ICD-10 codes with a posterior probability of association above 0.99 (right tree). Posterior decoding for the SNPs rs4420638 (C), rs10455872 (D) and rs505922 (E) in the APOE, LPA and ABO genes, respectively.
Figure 2
Figure 2. ICD-10 ontology within UKB HES data captures a substantial fraction of variants known to impact human disease phenotypes in the GWAS Catalog.
(A) Measure of association at GWAS Catalogue SNPs. GWAS Catalog SNPs were grouped into 16 experimental factor ontology (EFO) categories based on the individual SNP annotation found in the GWAS Catalog. For each category we identified the ICD-10 code with the highest evidence of association by taking the product of the posterior of each SNP in the category for all ICD-10 codes. (B) Relationship between the evidence of association of a SNP and the number of phenotypes associated with the SNP (PP ≥ 0.99).
Figure 3
Figure 3. Genetic risk profiles across common diseases in the HES data set.
(A) Schematic of the study design from genome-wide TreeWAS analysis to hierarchical genetic-risk SNP profile clustering and enrichment analyses. A hierarchical tree was constructed using the pairwise distances between the 3,025 lead SNPs. SNP clusters were determined by cutting the tree at a threshold (see methods). For each cluster a joint genetic risk profile was inferred. (B) Relationship between the number of SNPs and the number of associated ICD-10 codes for the 339 identified clusters. (C) Evidence for enrichment of Biological Processes Gene Ontology terms in SNP sets assigned to each cluster. For each cluster SNP set we calculate enrichment statistics for all GO terms and record the minimal P-value observed across all terms. We then, for each cluster, calculate an empirical P-value which is the proportion of times the minimal GO term P-value is smaller than those observed by randomly generating SNP sets from background of the same size (see Methods).
Figure 4
Figure 4. Posterior decoding for cluster 34 and a selection of individuals variants assigned to this cluster.
For each profile ICD-10 codes with PP ≥ 0.99 are shown. Individual SNP profiles for six out of the 16 variants assigned to Cluster 34 are shown (figures for all variants can be accessed at www.treewas.org.
Figure 5
Figure 5. Heterogeneity in genetic risk profiles associated with hypertension.
27 risk profiles for clusters associated with the ICD-10 term I10 “Essential (primary) hypertension” (PP ≥ 0.99). Colour labels indicate terms mentioned in the text.
Figure 6
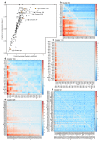
Figure 6. Identification of focal phenotypes within clusters.
(A) Relationship between the median cross-trait GRS effect-size for the driver phenotype in each cluster and the fraction of cross-trait GRS effects that are above one. (B)-(F) Individual cross-trait GRS effect size heatmaps for five of the 339 clusters, cluster 34, 110, 184, 328 and 52, respectively. In each heatmap the ICD-10 codes are sorted by the sum of their cross-trait GRS effect-sizes, with the putative focal phenotype of the left-hand side of the heatmap.

References

    1. Bulik-Sullivan B, et al. An atlas of genetic correlations across human diseases and traits. Nat Genet. 2015;47:1236–1241. - PMC - PubMed
    1. Pickrell JK, et al. Detection and interpretation of shared genetic influences on 42 human traits. Nat Genet. 2016;48:709–717. - PMC - PubMed
    1. Malik R, et al. Multiancestry genome-wide association study of 520,000 subjects identifies 32 loci associated with stroke and stroke subtypes. Nat Genet. 2018;50:524–537. - PMC - PubMed
    1. Warren HR, et al. Genome-wide association analysis identifies novel blood pressure loci and offers biological insights into cardiovascular risk. Nat Genet. 2017;49:403–415. - PMC - PubMed
    1. Cross-Disorder Group of the Psychiatric Genomics Consortium et al. Genetic relationship between five psychiatric disorders estimated from genome-wide SNPs. Nat Genet. 2013;45:984–994. - PMC - PubMed

Publication types